 ICACT20210141 Slide.01
[Big Slide] |
Chrome  Click!! |
 |
Hello everybody, my name is WuZhongqiang. For ICACT 2021, I am very honored to be here to attend this conference. Our presentation today is about a method based on 3D CNN and LSTM with attention mechanism for Sea surface Temperature prediction. And now I’ll start my presentation.
|
| ICACT20210141 Slide.02
[Big Slide]
|
Chrome Click!! |
 |
This is an outline I shared this time, which consists of the following five parts, Introduction, Description of SST prediction problem, SST Prediction Approach, Experiments Approach, Experiments and Results and Conclusions
|
| ICACT20210141 Slide.03
[Big Slide]
|
Chrome Click!! |
 |
At first, I want to have an Introduction about this topic
|
| ICACT20210141 Slide.04
[Big Slide]
|
Chrome Click!! |
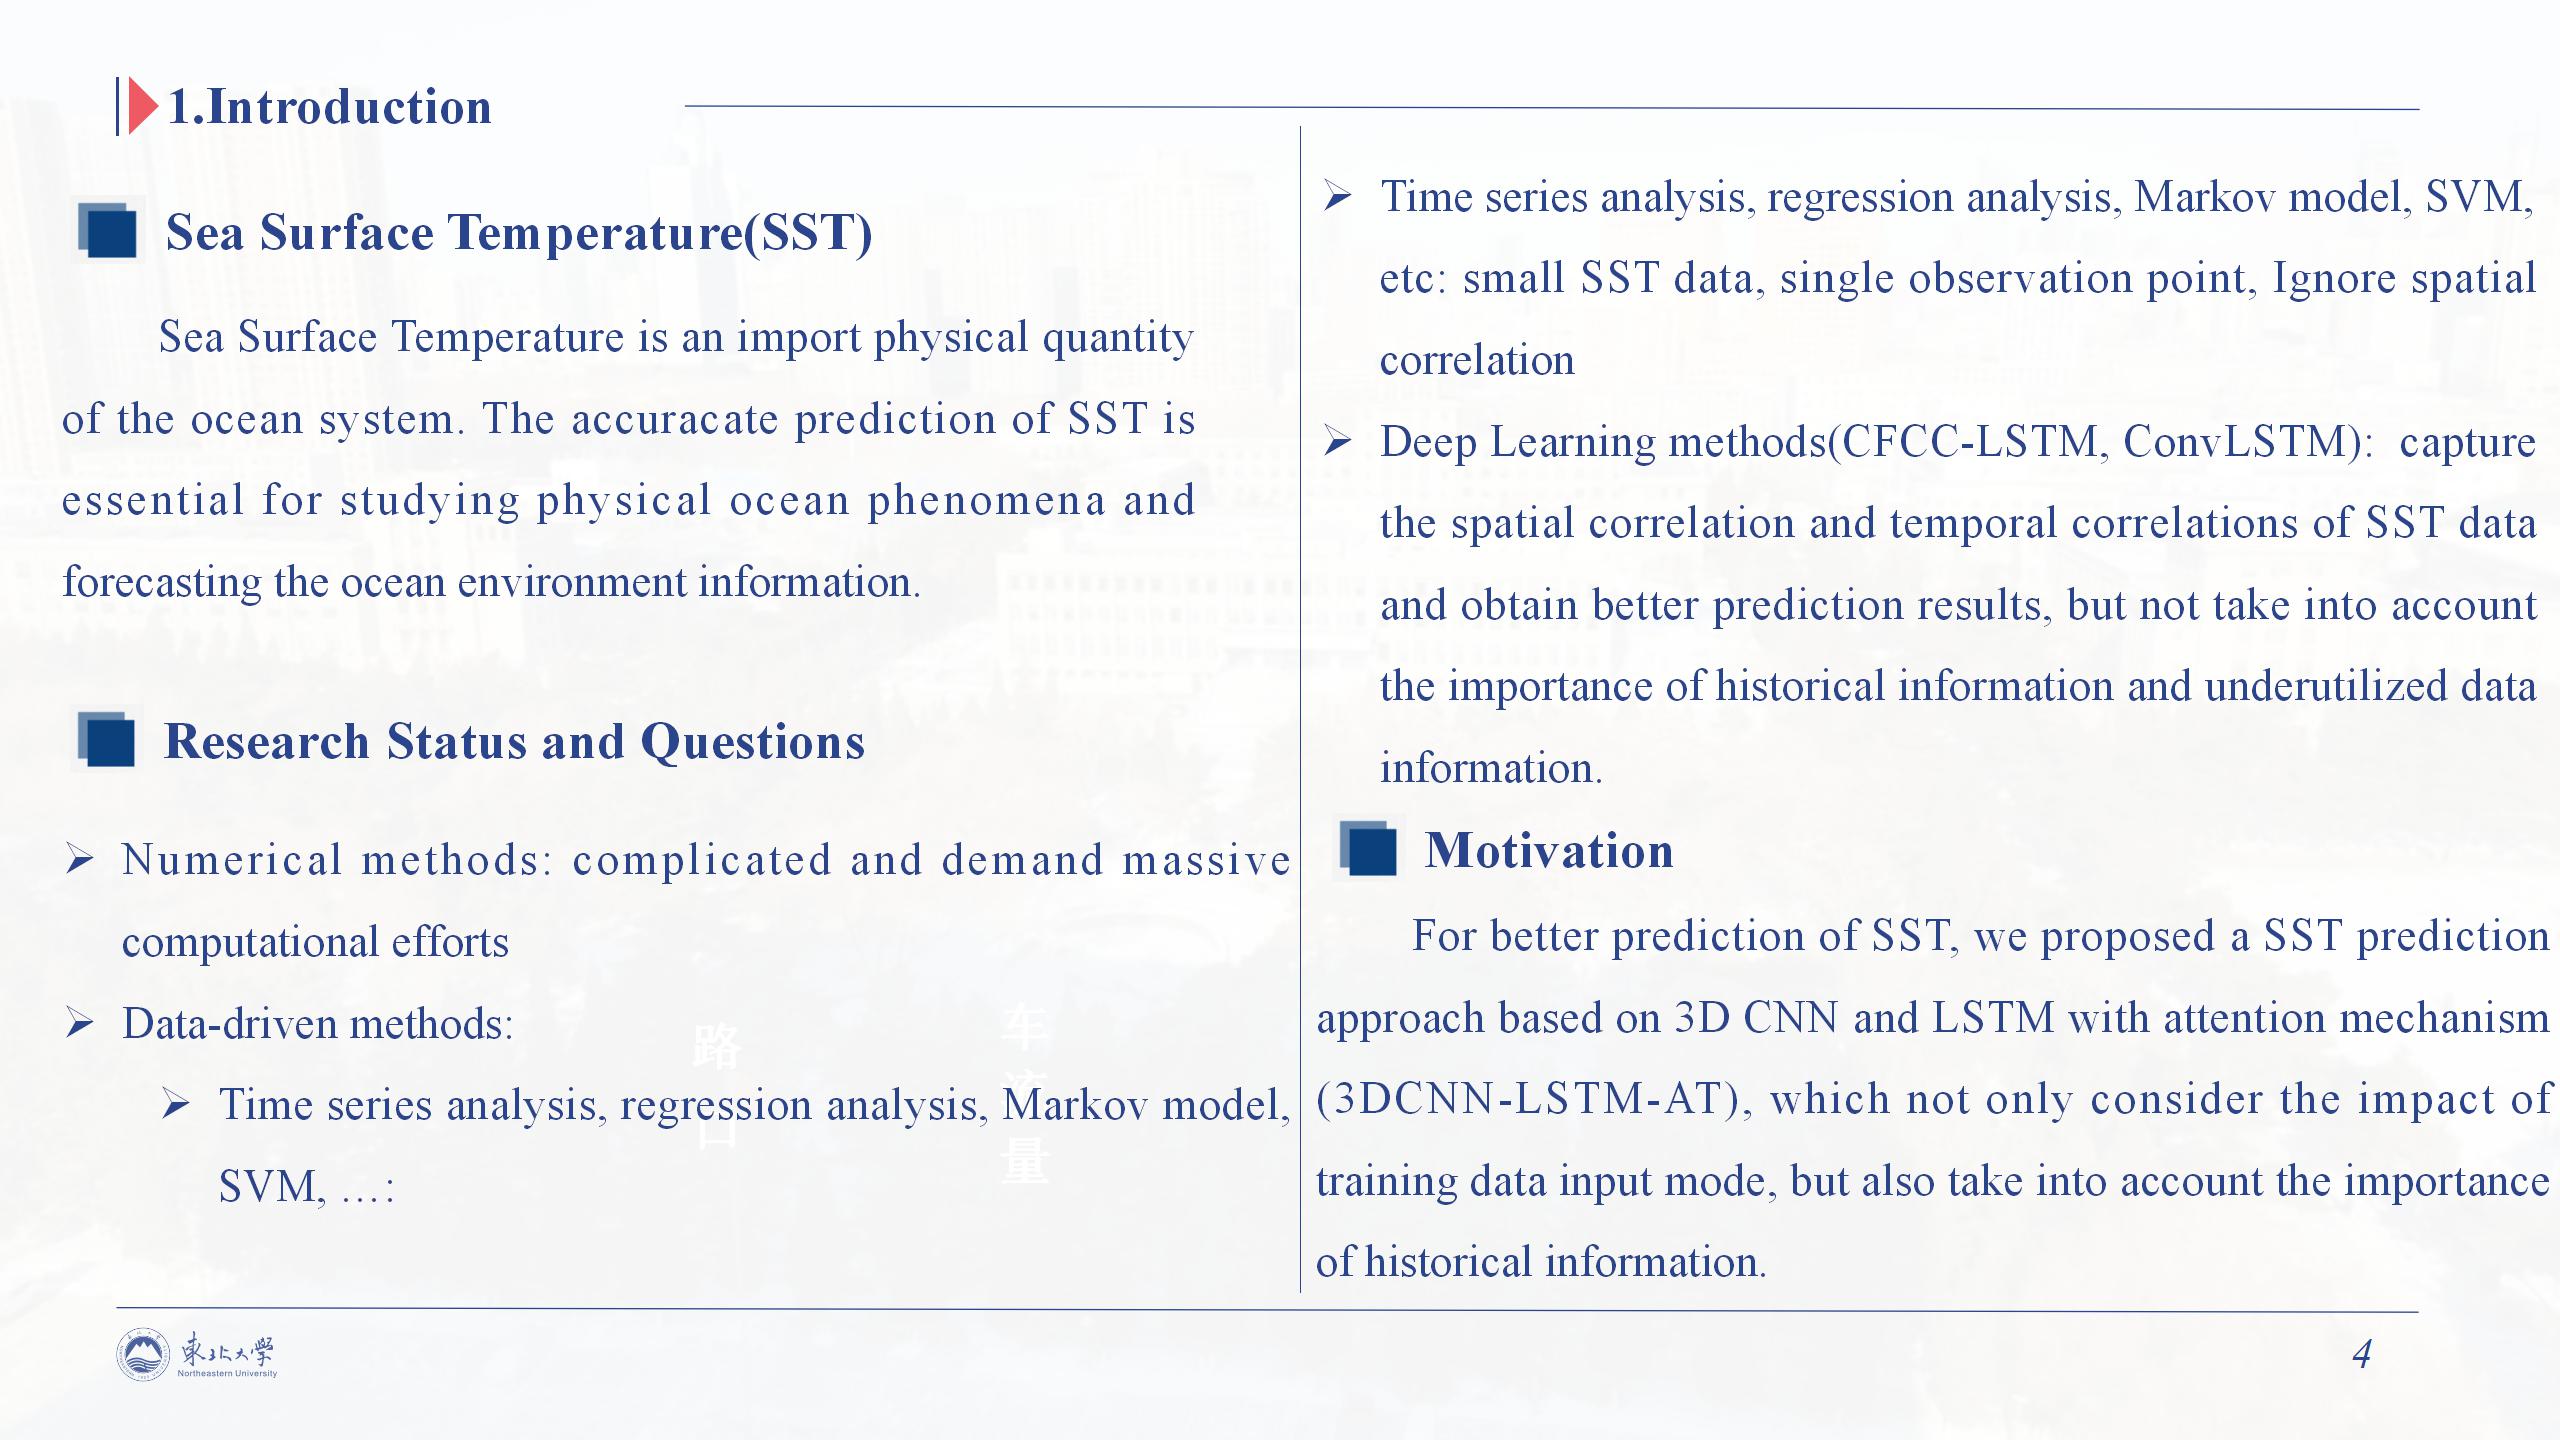 |
What is the Sea surface Temperature? It is an import physical quantity of the ocean system. The accuracate prediction of SST is essential for studying physical ocean phenomena and forecasting the ocean environment information. Current research methods for predicting sea surface temperature fall into two broad categories: Numerical methods and Data-driven methods. The former has the problem that it can only be used for small data sets, single-point prediction problems, and ignores the interactions between points. The latter does not take into account the importance of historical information and does not take advantage of the regularity information of the data itself. So for better prediction of SST, we proposed a new approach based on 3D CNN and LSTM with attention mechanism. which not only consider the impact of training data input mode, but also take into account the importance of historical information.
|
| ICACT20210141 Slide.05
[Big Slide]
|
Chrome Click!! |
 |
Next I will describe the details of the sea surface temperature problem.
|
| ICACT20210141 Slide.06
[Big Slide]
|
Chrome Click!! |
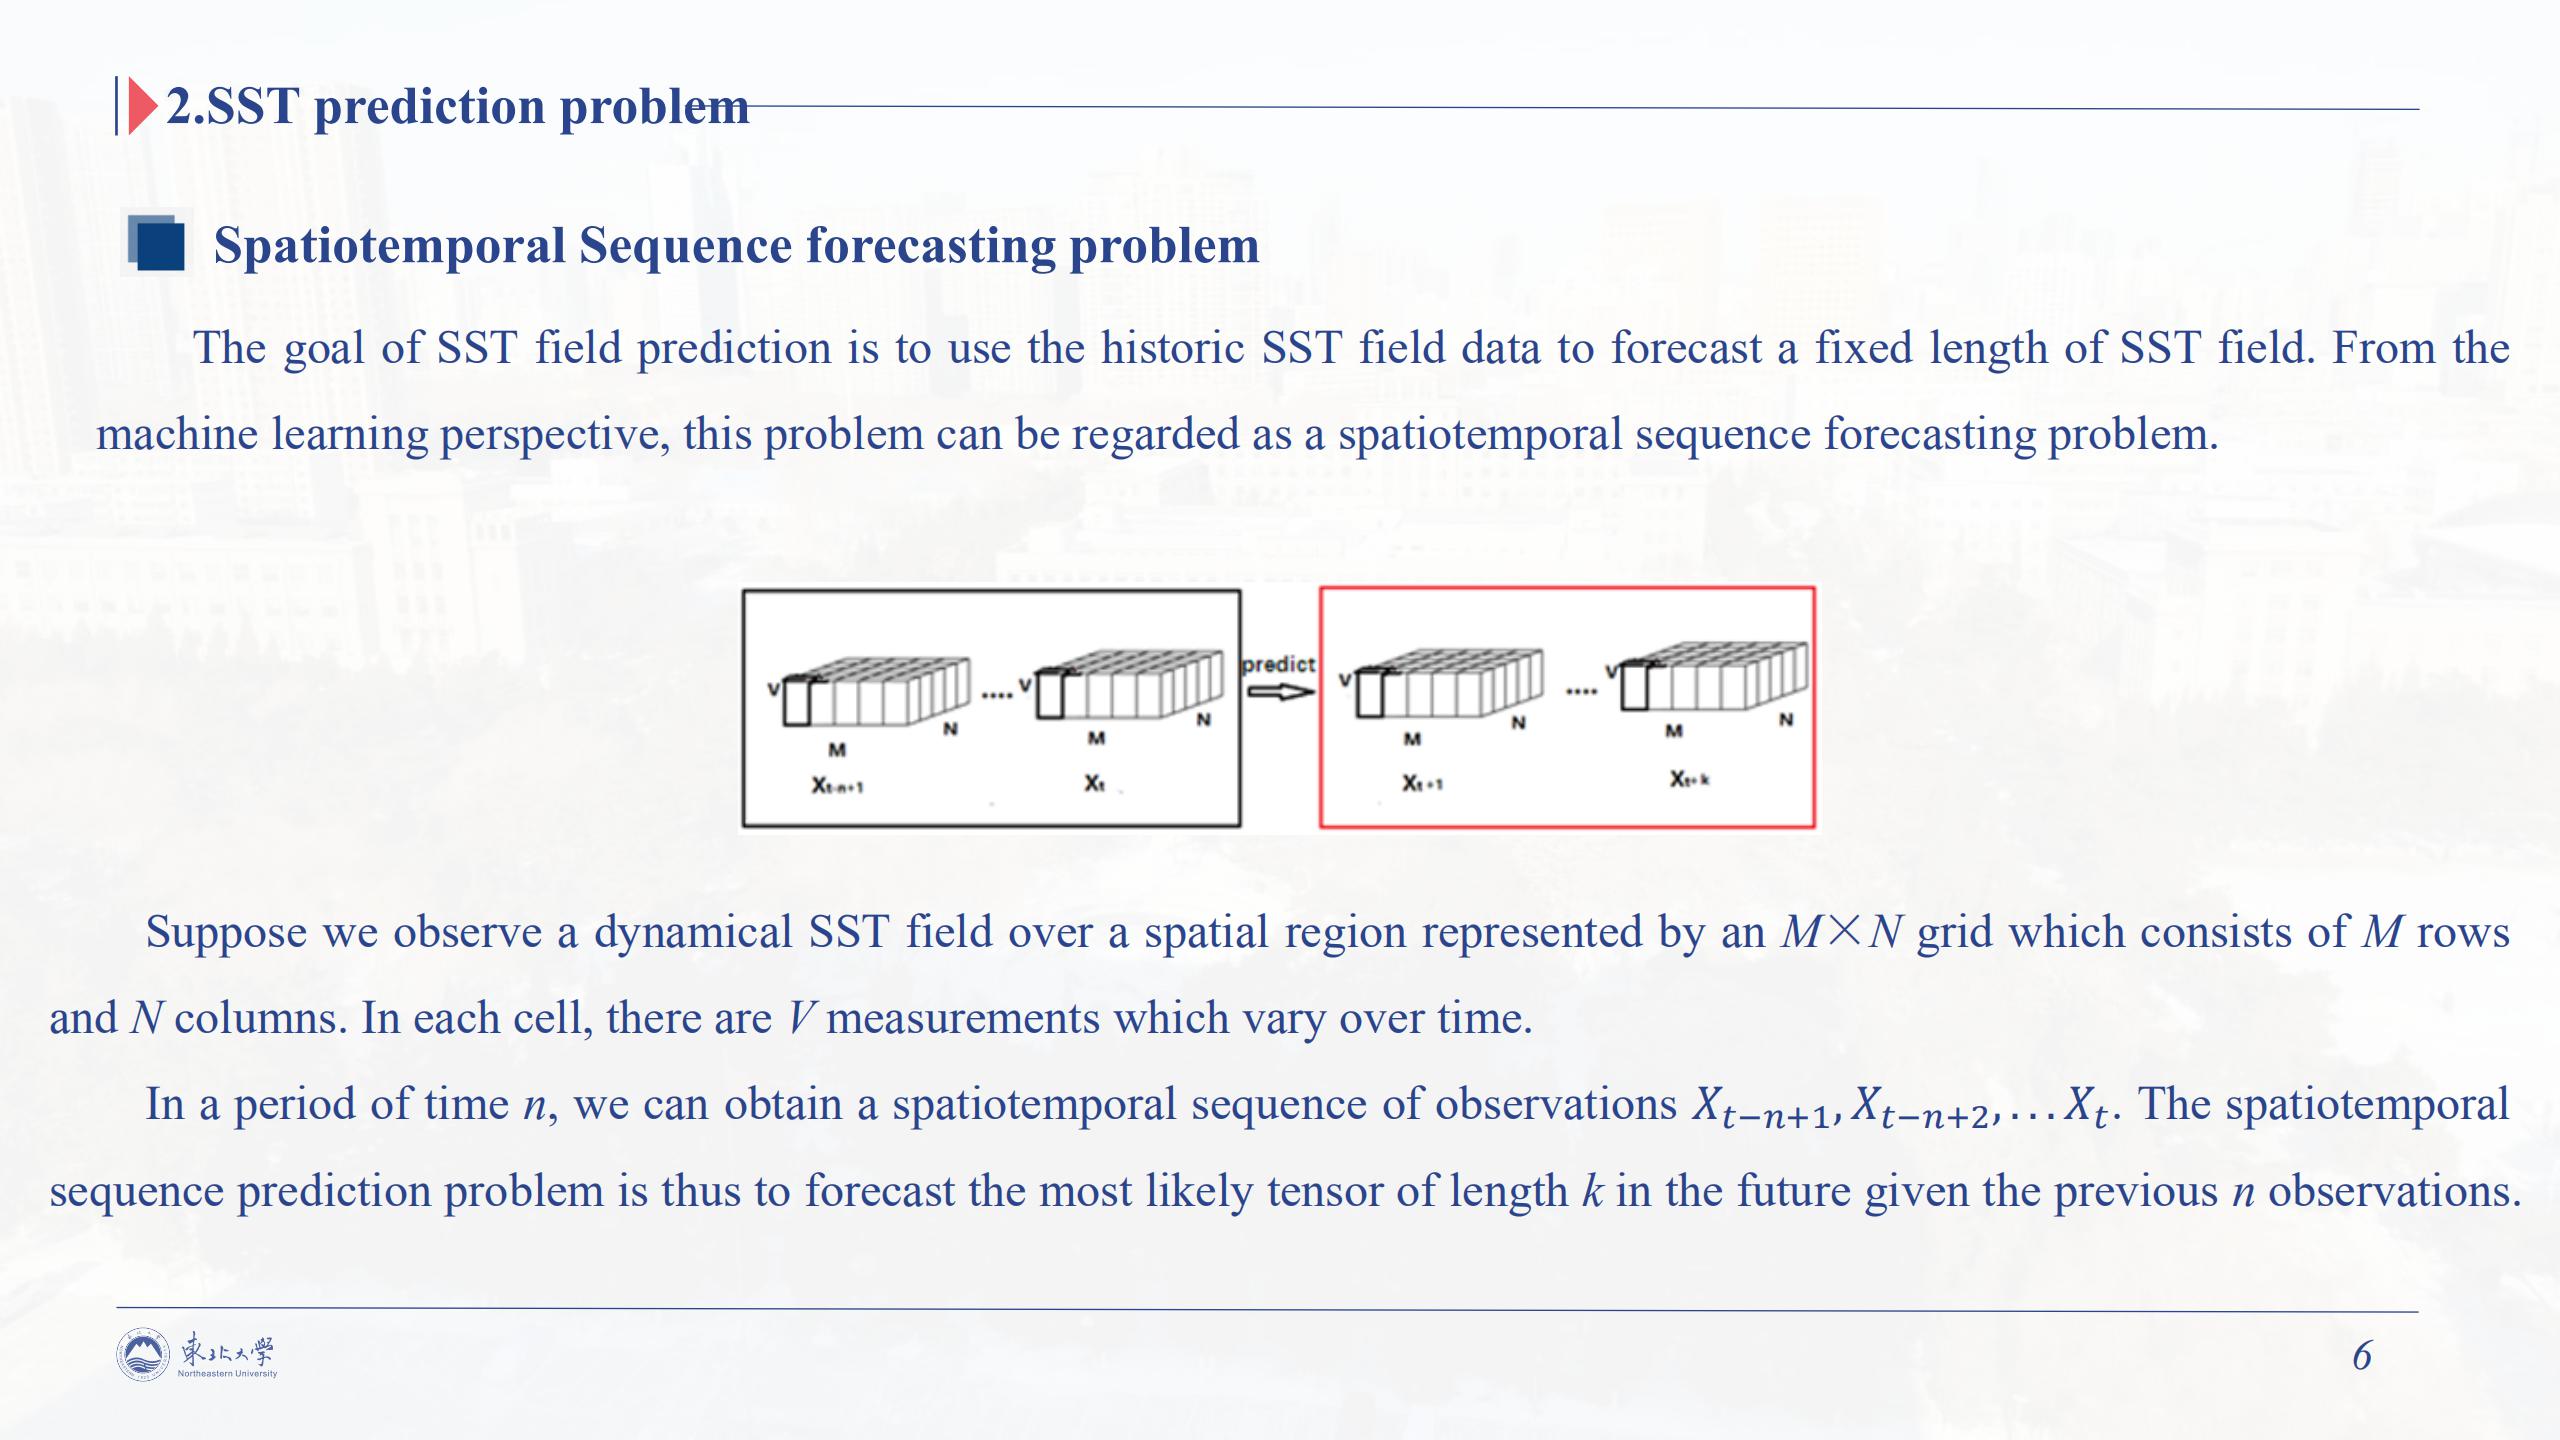 |
The goal of SST field prediction is to use the historic SST field data to forecast a fixed length of SST field. This problem can be regarded as a spatiotemporal sequence forecasting problem. Look at is picture, Suppose we observe a dynamical SST field over a spatial region represented by an M×N grid which consists of M rows and N columns. In a period of time n, we can obtain a spatiotemporal sequence of observations 𝑿_(𝒕−𝒏+𝟏), 𝑿_(𝒕−𝒏+𝟐), ...𝑿_𝒕. The spatiotemporal sequence prediction problem is thus to forecast the most likely tensor of length k in the future given the previous n observations.
|
| ICACT20210141 Slide.07
[Big Slide]
|
Chrome Click!! |
 |
And now, I’ll describe our proposed approach about this problem.
|
| ICACT20210141 Slide.08
[Big Slide]
|
Chrome Click!! |
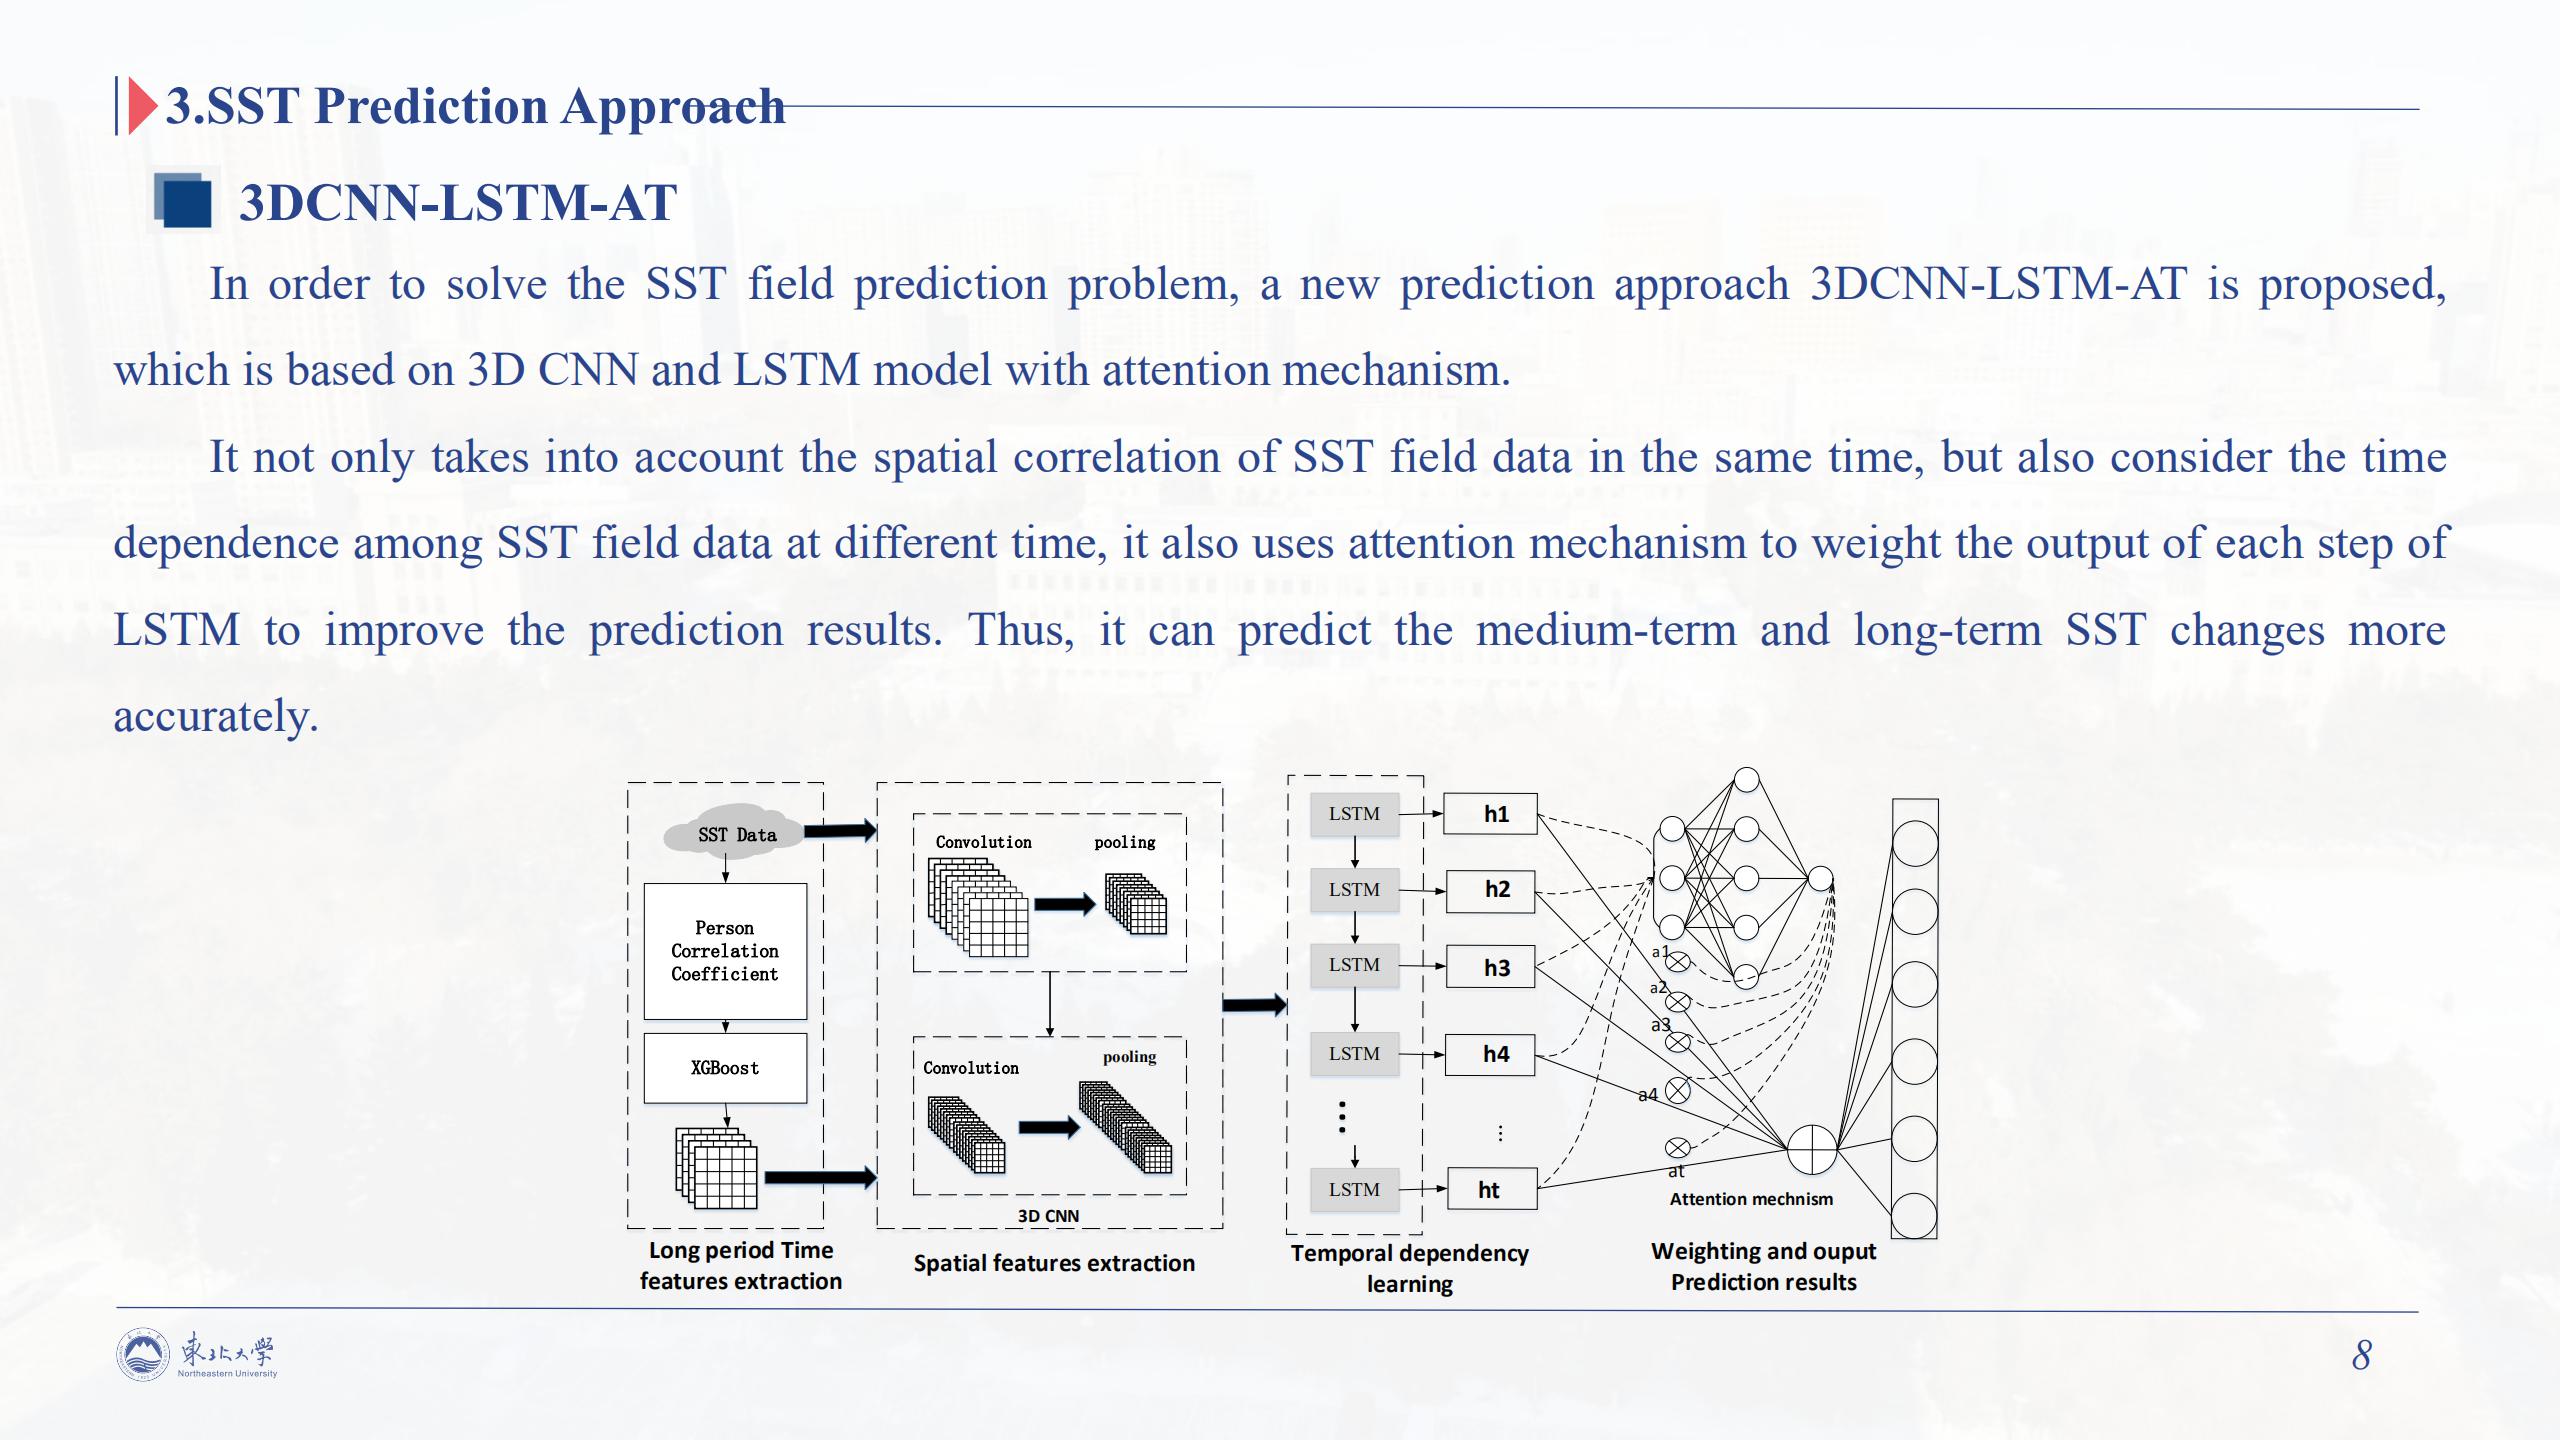 |
Our prediction approach is a combined prediction method of 3DCNN, LSTM and attention mechanism, which called 3DCNN-LSTM-AT. It not only takes into account the spatial correlation of SST field data in the same time, but also consider the time dependence among SST field data at different time, it also uses attention mechanism to weight the output of each step of LSTM to improve the prediction results. Thus, it can predict the medium-term and long-term SST changes more accurately. The framework of 3DCNN-LSTM-AT approach is shown as figure blow, which is mainly divided into four stages, that are long period time features extraction, spatial features extraction, temporal dependency learning, weighting and output results
|
| ICACT20210141 Slide.09
[Big Slide]
|
Chrome Click!! |
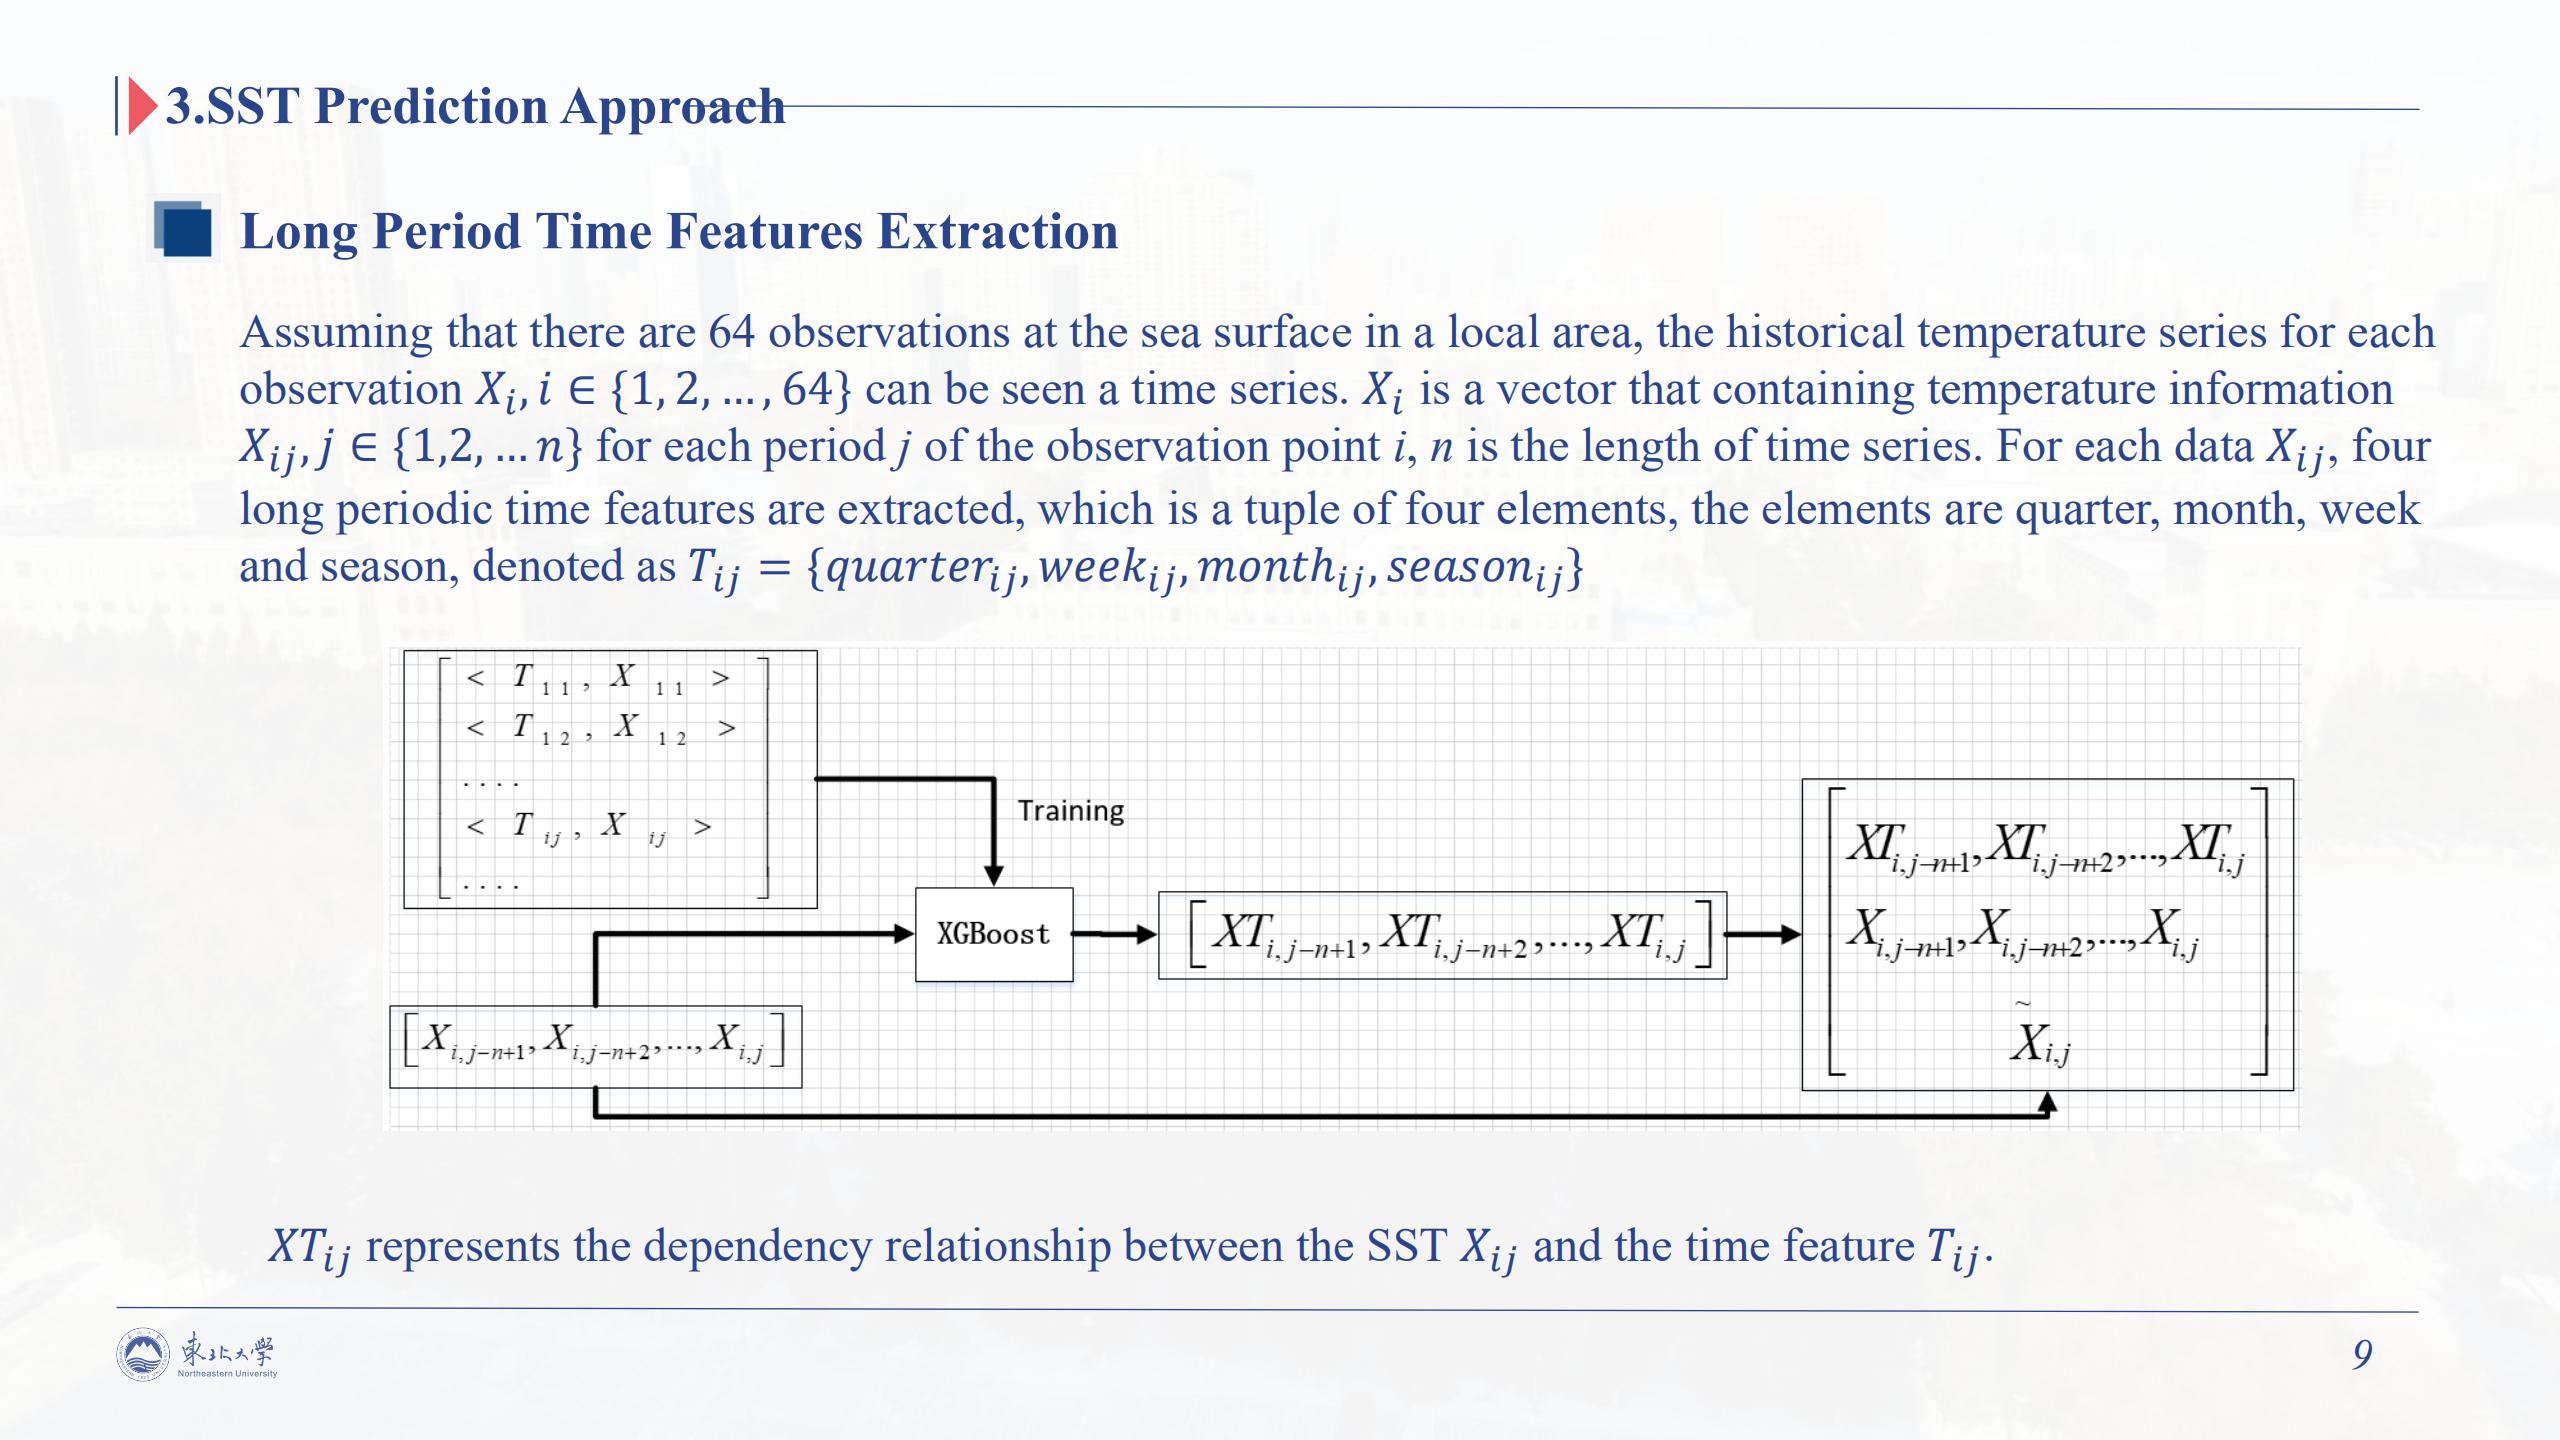 |
The first stage is Long period time features extraction. Considering the seasonal periodicity of SST data, the Pearson correlation coefficient and XGboost mode are used to extract the long period time features of SST data, which together with the raw SST data are used as inputs of the 3D CNN model in next phase. Look at this picture. In the training phase of the model, we use the temporal features of the sea surface temperature as features and the sea surface temperature at each point as features to train the XGBOOst model. Thus, for each observation point, we can use the trained xgboost model to predict the relationship between the temporal features and the sea surface temperature, which reflects the seasonality of the sea surface temperature data, denoted by XT subsript ij.
|
| ICACT20210141 Slide.10
[Big Slide]
|
Chrome Click!! |
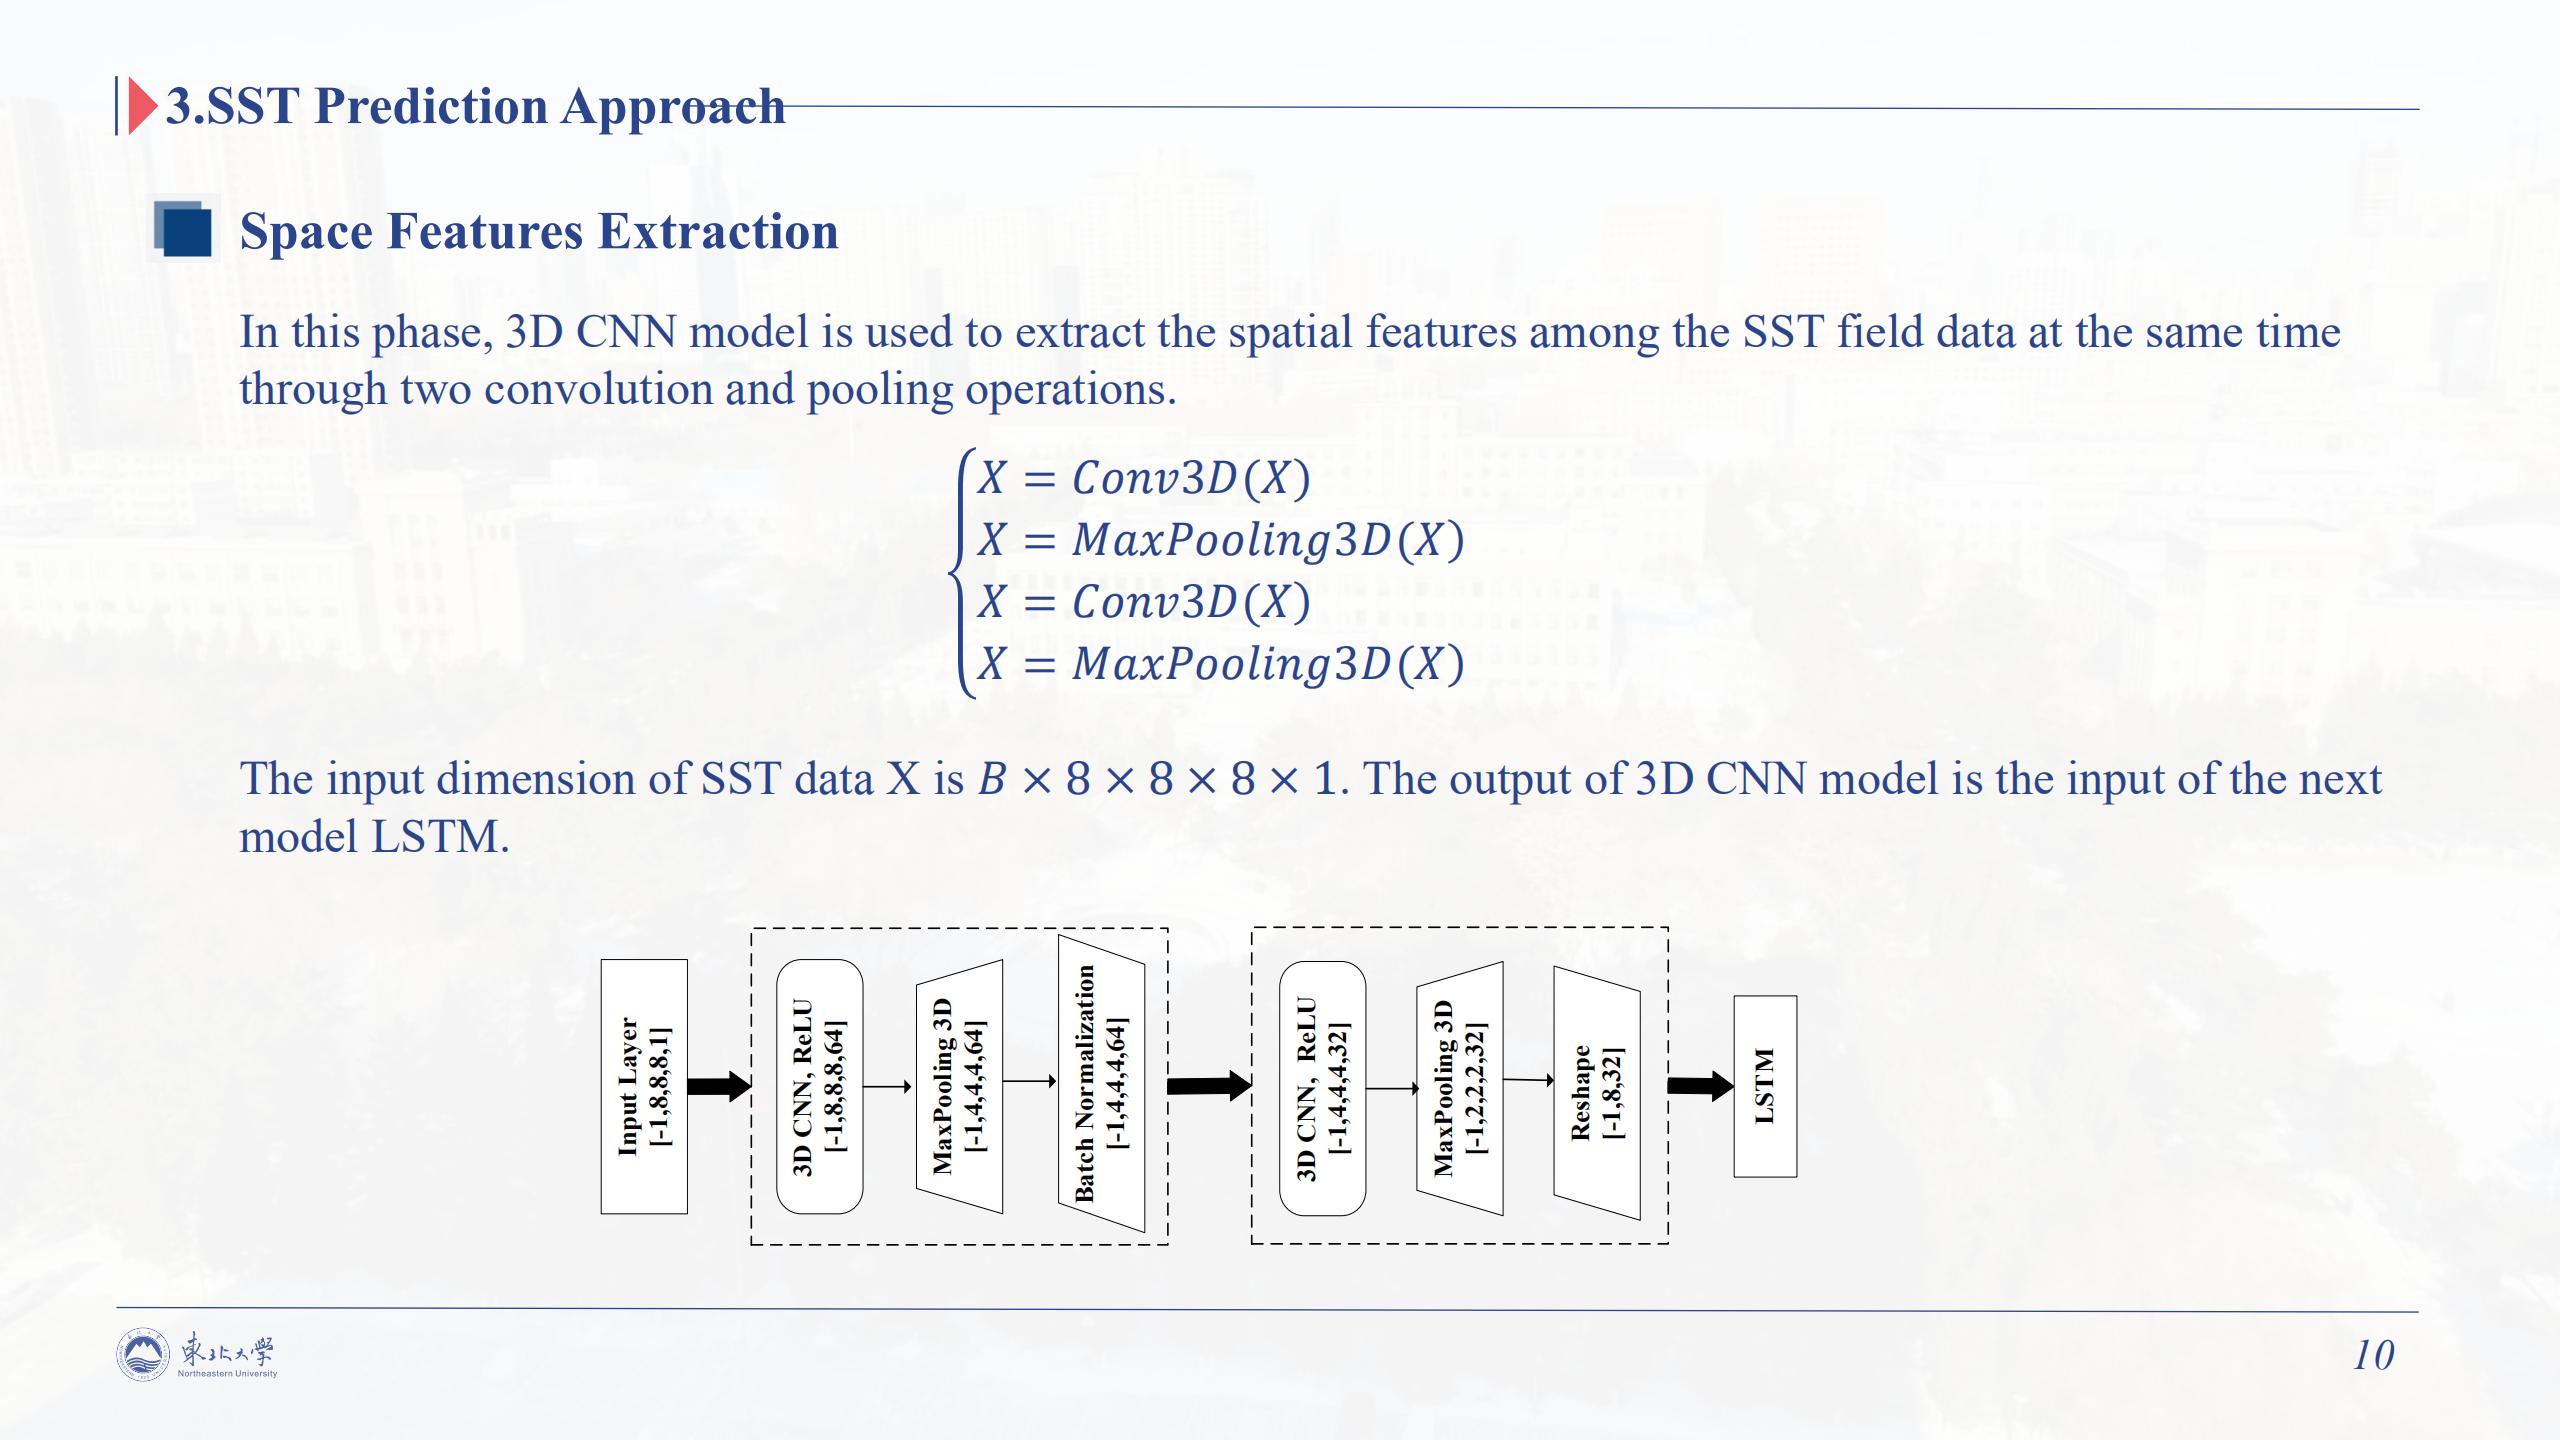 |
In this phase, 3D CNN model is used to extract the spatial features among the SST field data at the same time through two convolution and pooling operations. Look at this formula. The input of the 3D CNN is a 5-deminsional tensor expressed as 𝑩×𝑭×𝑳×𝑾×𝑪, where B is the number of training samples in a batch, F is the length of SST field series data. L and W are the length and width of the SST field. C is the channel information of the model, the value of C here is 1. In the following experiments, both length and width of SST field are set to 8, that means values of L and W are set to 8, and the numbers of features on past time is obtained by sliding the window. For example, if the SST is predicted by past 4 days SST data, then the sequence length is 4, in addition, 4 long-period time features extracted by XGBoost, the length of the time series is 8, i.e. the value of F. Finally, the data from each window are combined to obtain a 5-dimensional tensor as an input to the next model 3D CNN. The whole process is shown as figure blow. The output of 3D CNN model is the input of the next model LSTM.
|
| ICACT20210141 Slide.11
[Big Slide]
|
Chrome Click!! |
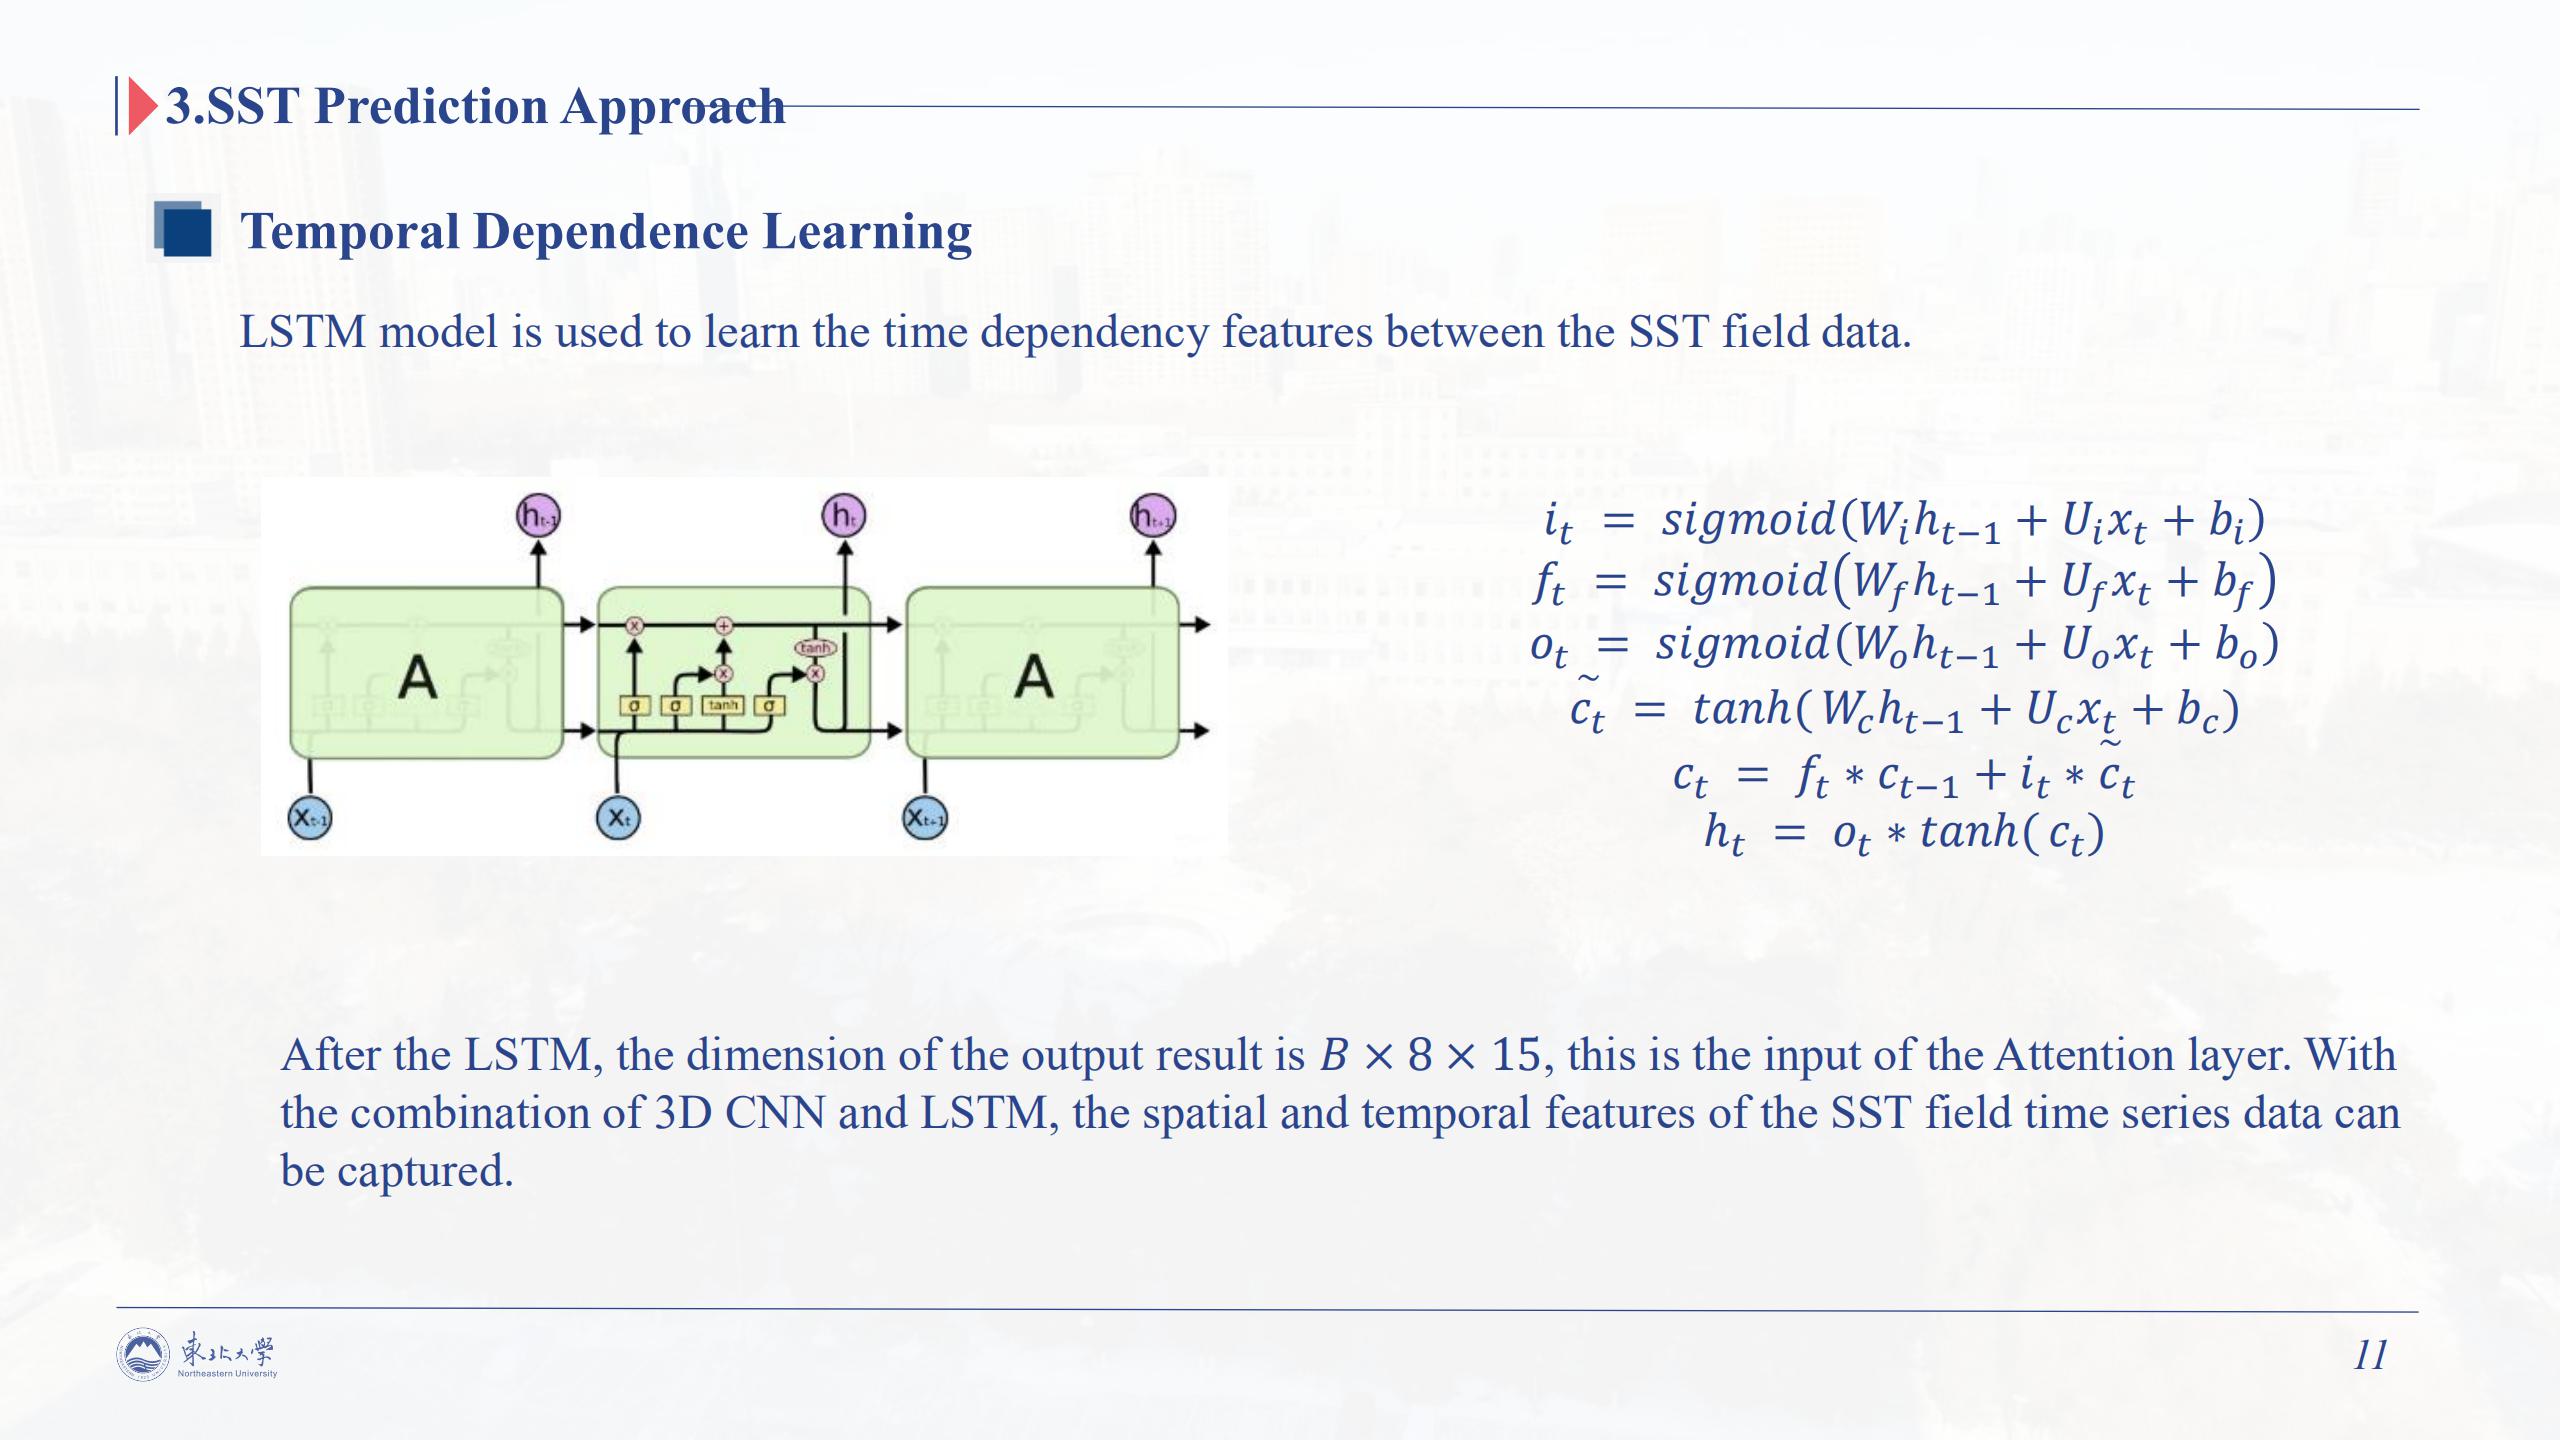 |
LSTM model is used to learn the time-dependency features between the SST field data. The structure of LSTM is shown in the figure above.
After the LSTM, the dimension of the output result is 𝑩×𝟖×𝟏𝟓, this is the input of the Attention layer. With the combination of 3D CNN and LSTM, the spatial and temporal features of the SST field time series data can be captured.
|
| ICACT20210141 Slide.12
[Big Slide]
|
Chrome Click!! |
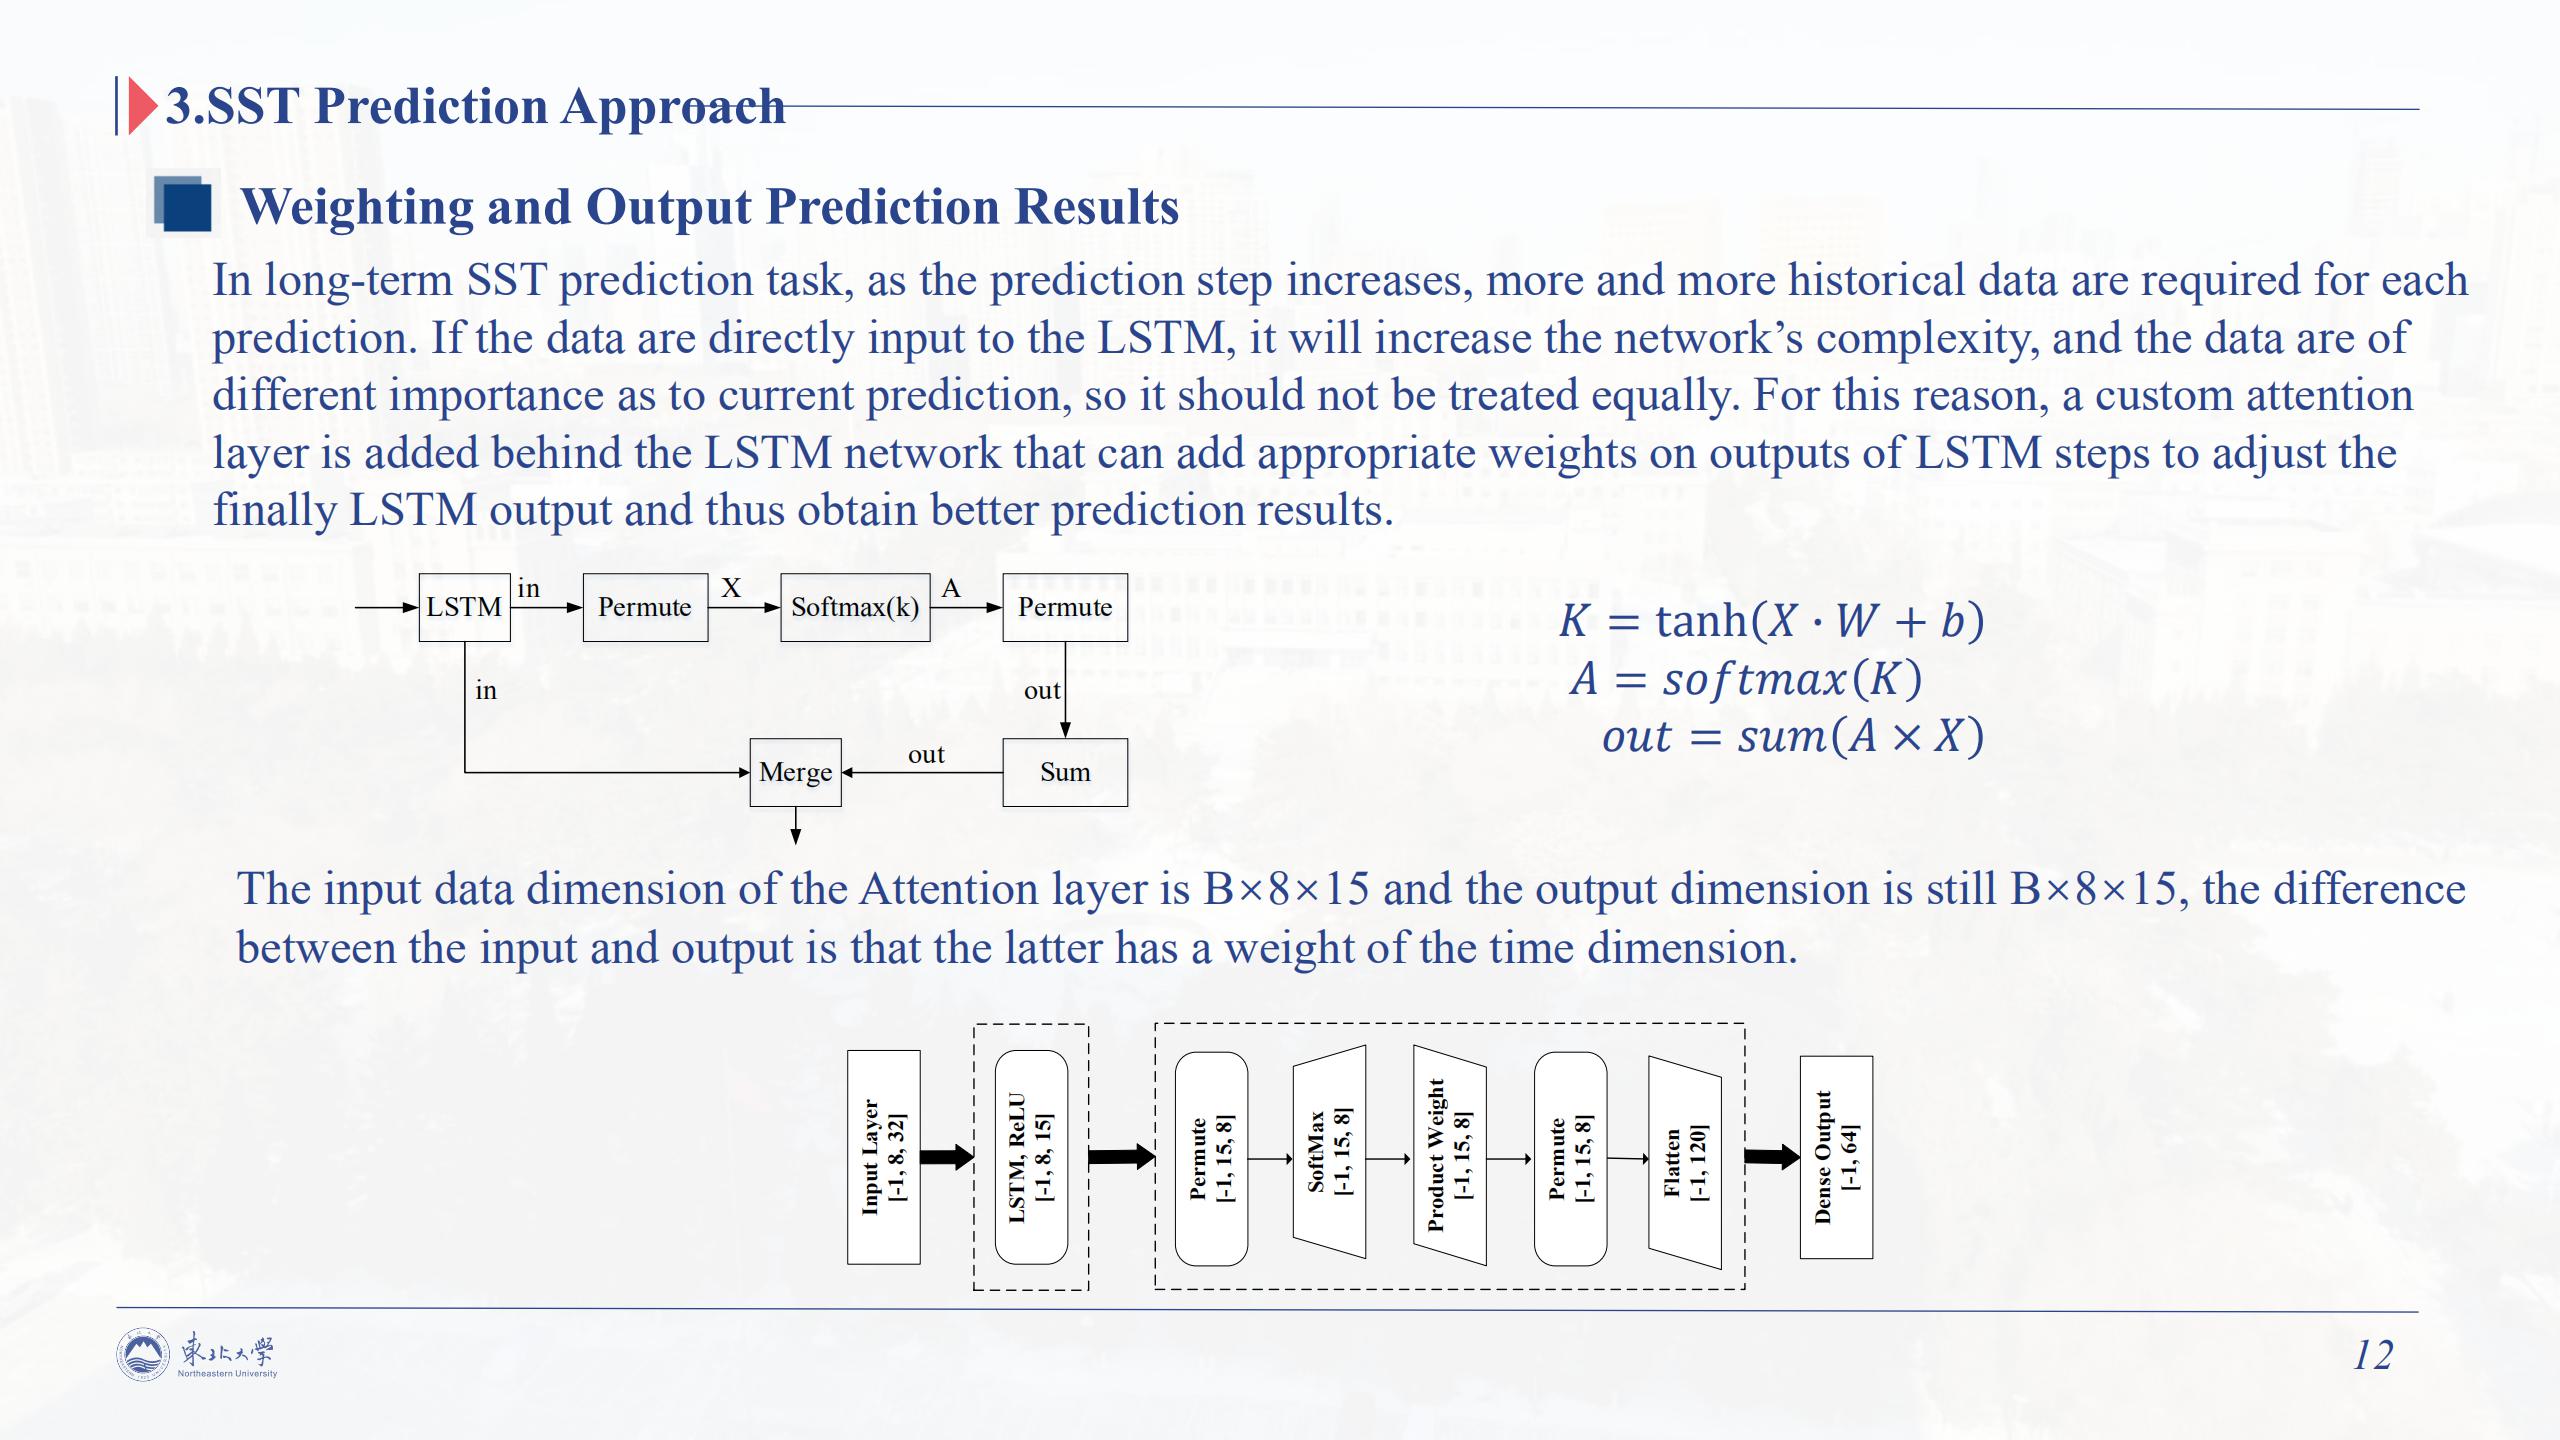 |
In long-term SST prediction task, as the prediction step increases, more and more historical data are required for each prediction. If the data are directly input to the LSTM, it will increase the network’s complexity, and the data are of different importance as to current prediction, so it should not be treated equally . For this reason, a custom attention layer is added behind the LSTM network that can add appropriate In long-term SST prediction task, as the prediction step increases, more and more historical data are required for each prediction. If the data are directly input to the LSTM, it will increase the network’s complexity, and the data are of different importance as to current prediction, so it should not be treated equally . For this reason, a custom attention layer is added behind the LSTM network that can add appropriate weights on outputs of LSTM steps to adjust the finally LSTM output and thus obtain better prediction results. A custom attention layers is shown above. The input data dimension of the Attention layer is B×8×15 and the output dimension is still B×8×15, the difference between the input and output is that the latter has a weight of the time dimension. A fully connected layer is then used to obtain the final prediction results. the layering of the LSTM and Attention layers is shown below.
|
| ICACT20210141 Slide.13
[Big Slide]
|
Chrome Click!! |
 |
And Next is our Experiments part.
|
| ICACT20210141 Slide.14
[Big Slide]
|
Chrome Click!! |
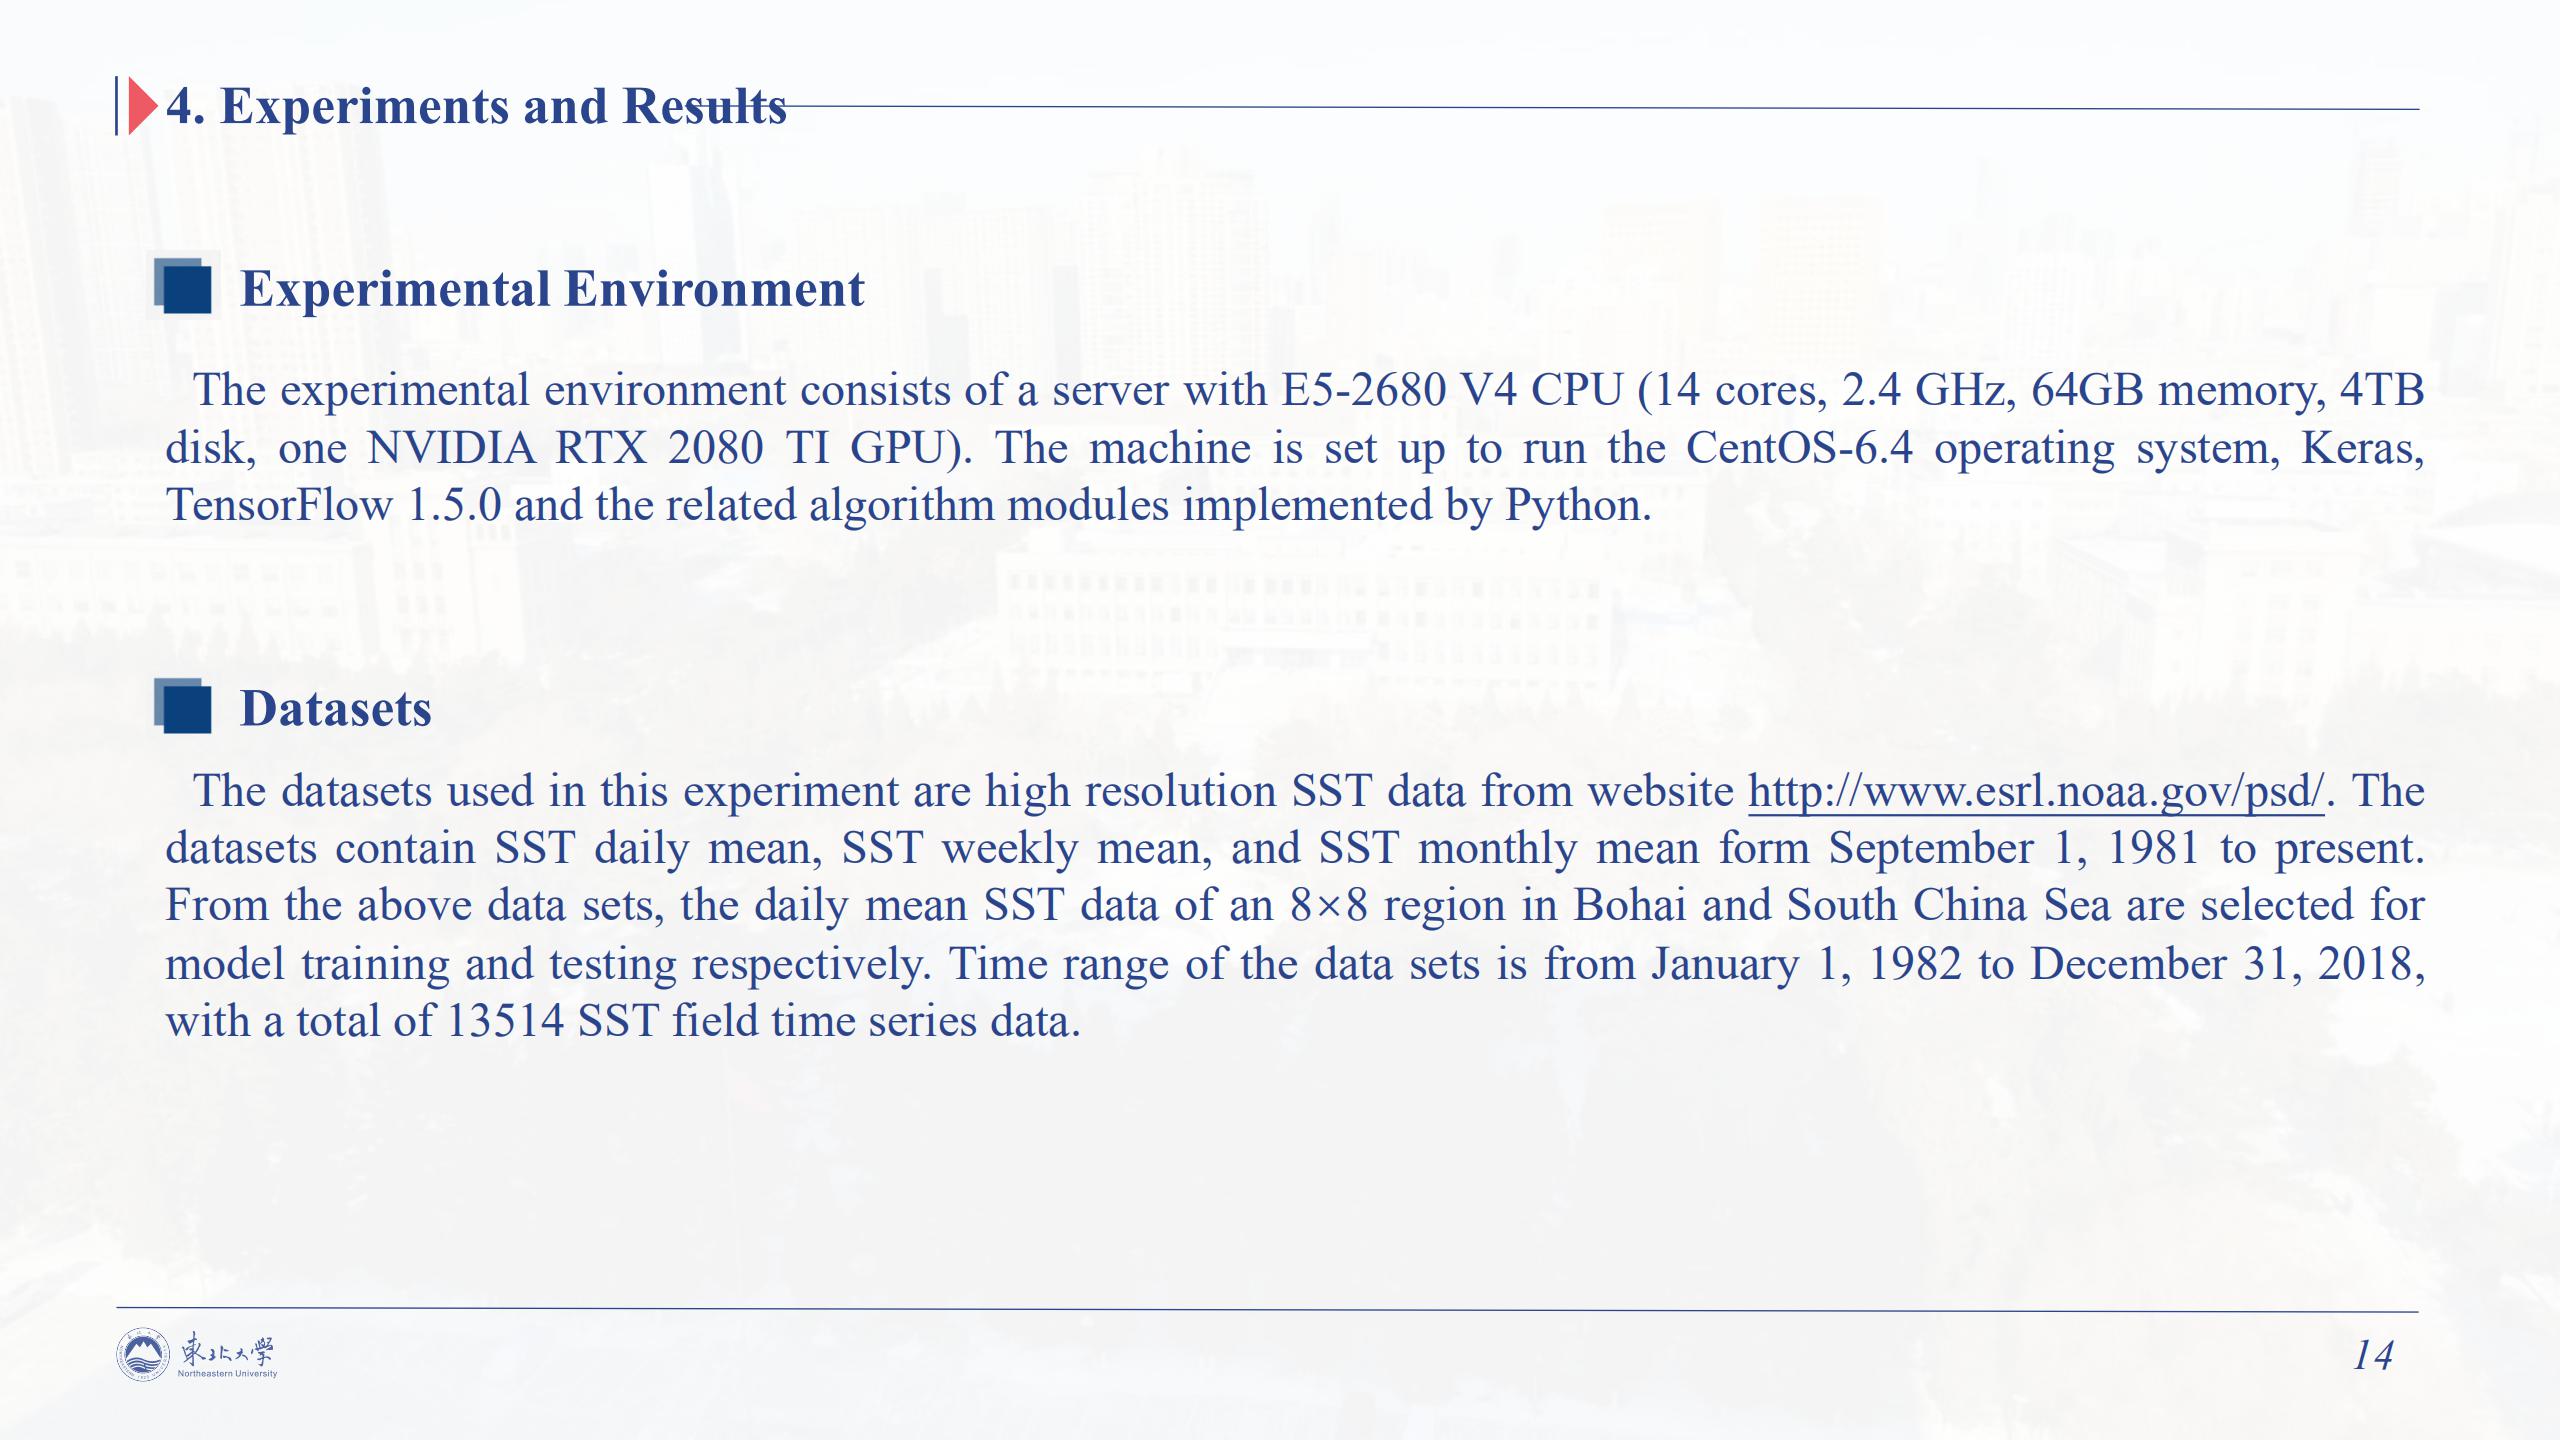 |
The experimental environment is as described above. The datasets used in this experiment are high resolution SST data from website http://www.esrl.noaa.gov/psd/. The datasets contain SST daily mean, SST weekly mean, and SST monthly mean form September 1, 1981 to present. From the above data sets, the daily mean SST data of an 8×8 region in Bohai and South China Sea are selected for model training and testing respectively.
Depending on the number of days of prediction, we divided the experiment into three parts: short-term, medium-term and long-term predictions.
Four indicators, Mean Square Error (MSE), Root Mean Square Error (RMSE), Mean Absolute Error (MAE) and Coefficient of Determination (R2) are used to evaluate these models.
|
| ICACT20210141 Slide.15
[Big Slide]
|
Chrome Click!! |
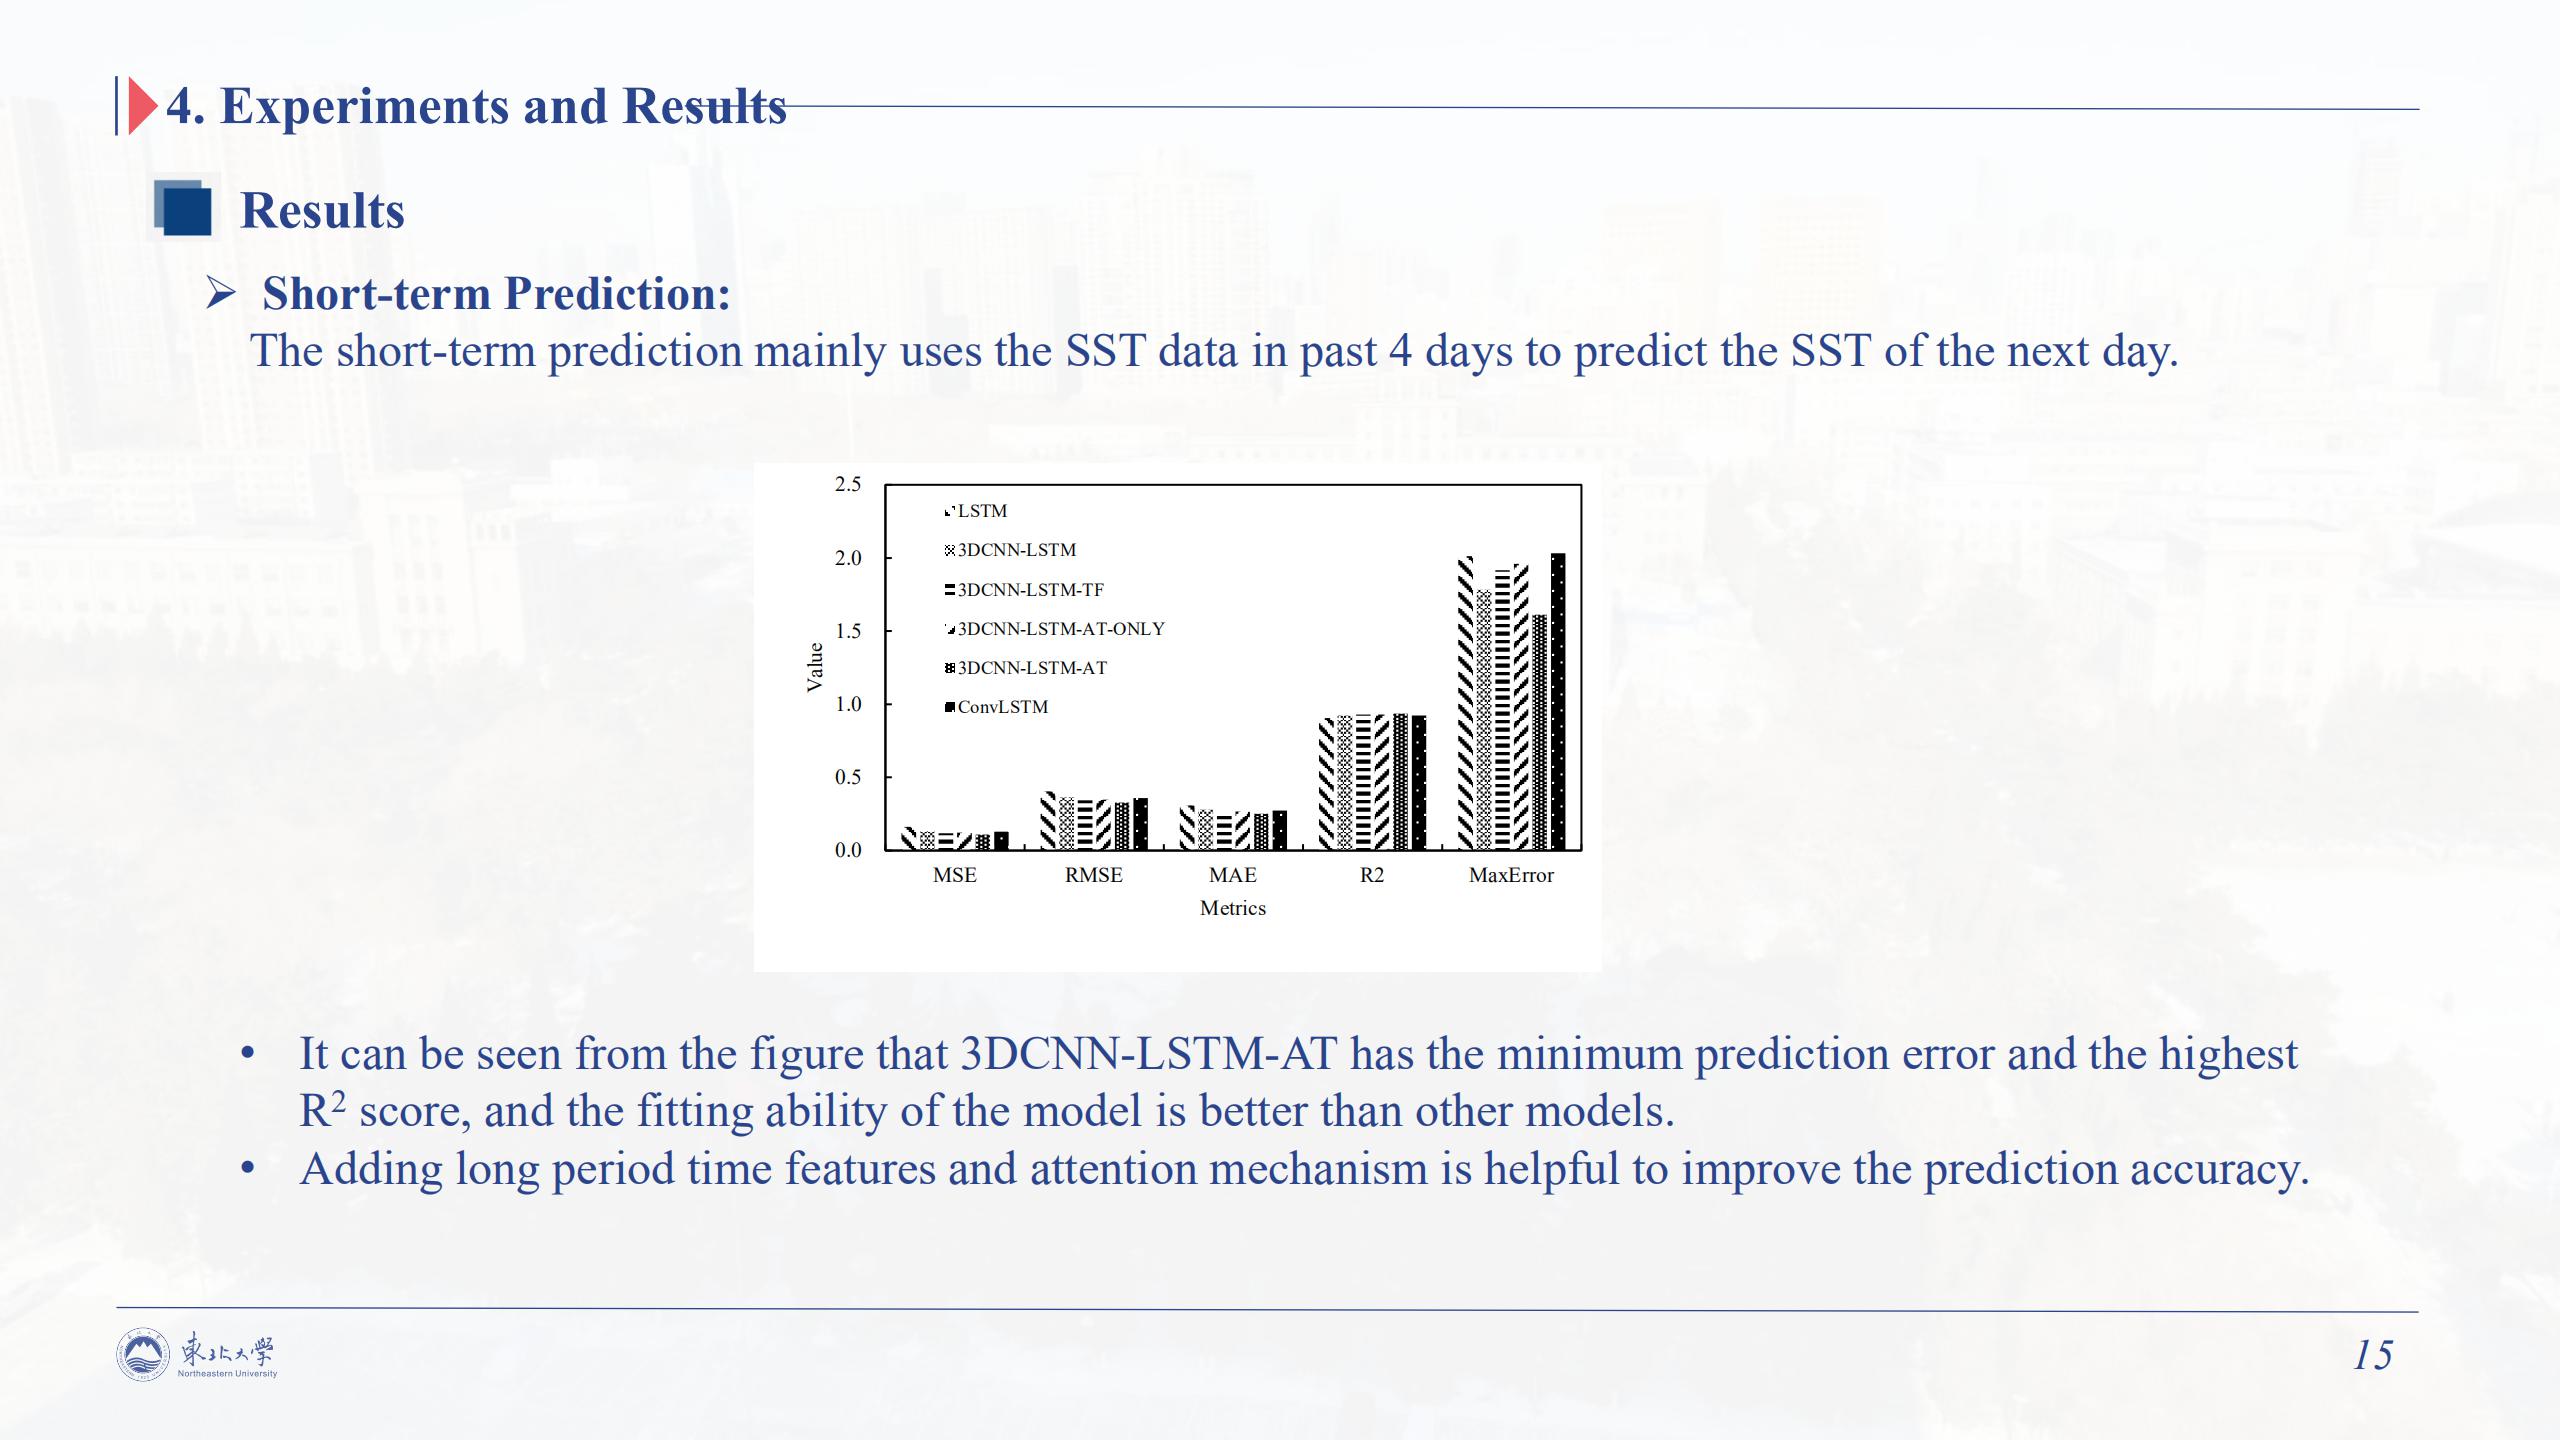 |
The short-term prediction mainly uses the SST data in past 4 days to predict the SST of the next day. The result as the picture above. It can be seen from the figure that 3DCNN-LSTM-AT has the minimum prediction error and the highest R2 score, and the fitting ability of the model is better than other models. Also, adding long period time features and attention mechanism is helpful to improve the prediction accuracy.
|
| ICACT20210141 Slide.16
[Big Slide]
|
Chrome Click!! |
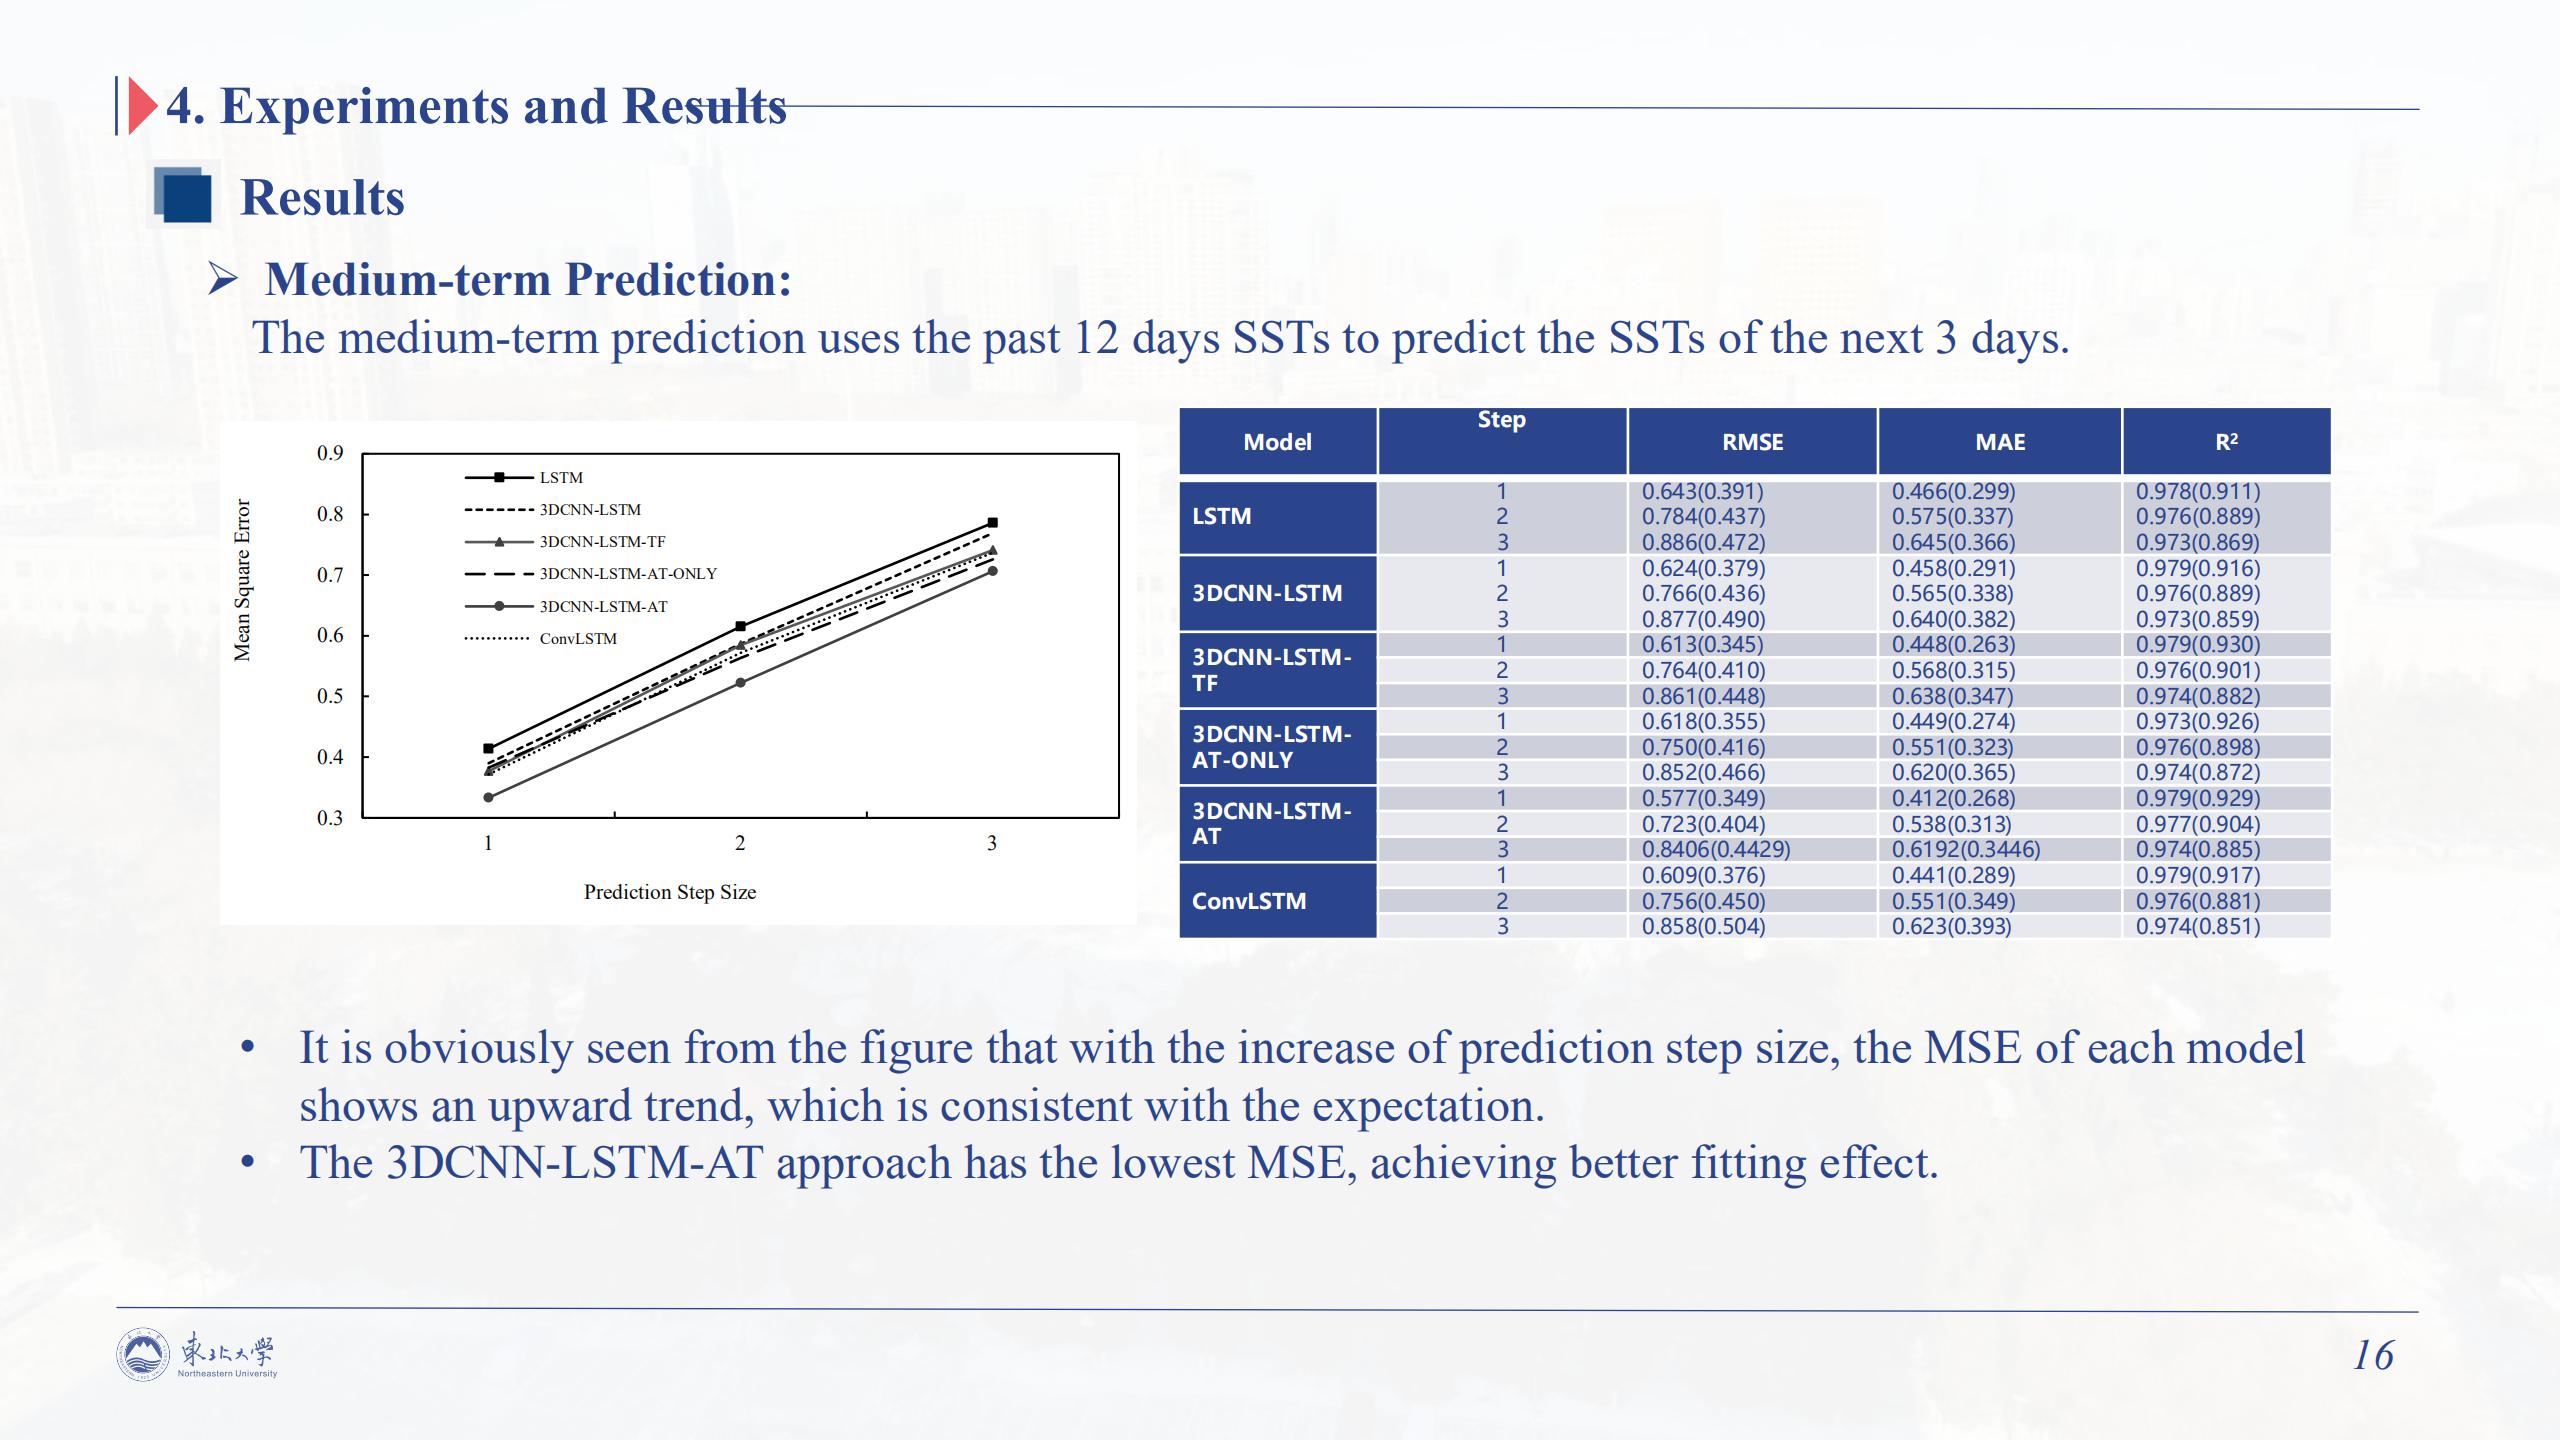 |
The medium-term prediction uses the past 12 days SSTs to predict the SSTs of the next 3 days. It is obviously seen from the figure that with the increase of prediction step size, the MSE of each model shows an upward trend, which is consistent with the expectation. The 3DCNN-LSTM-AT approach has the lowest MSE, achieving better fitting effect.
|
| ICACT20210141 Slide.17
[Big Slide]
|
Chrome Click!! |
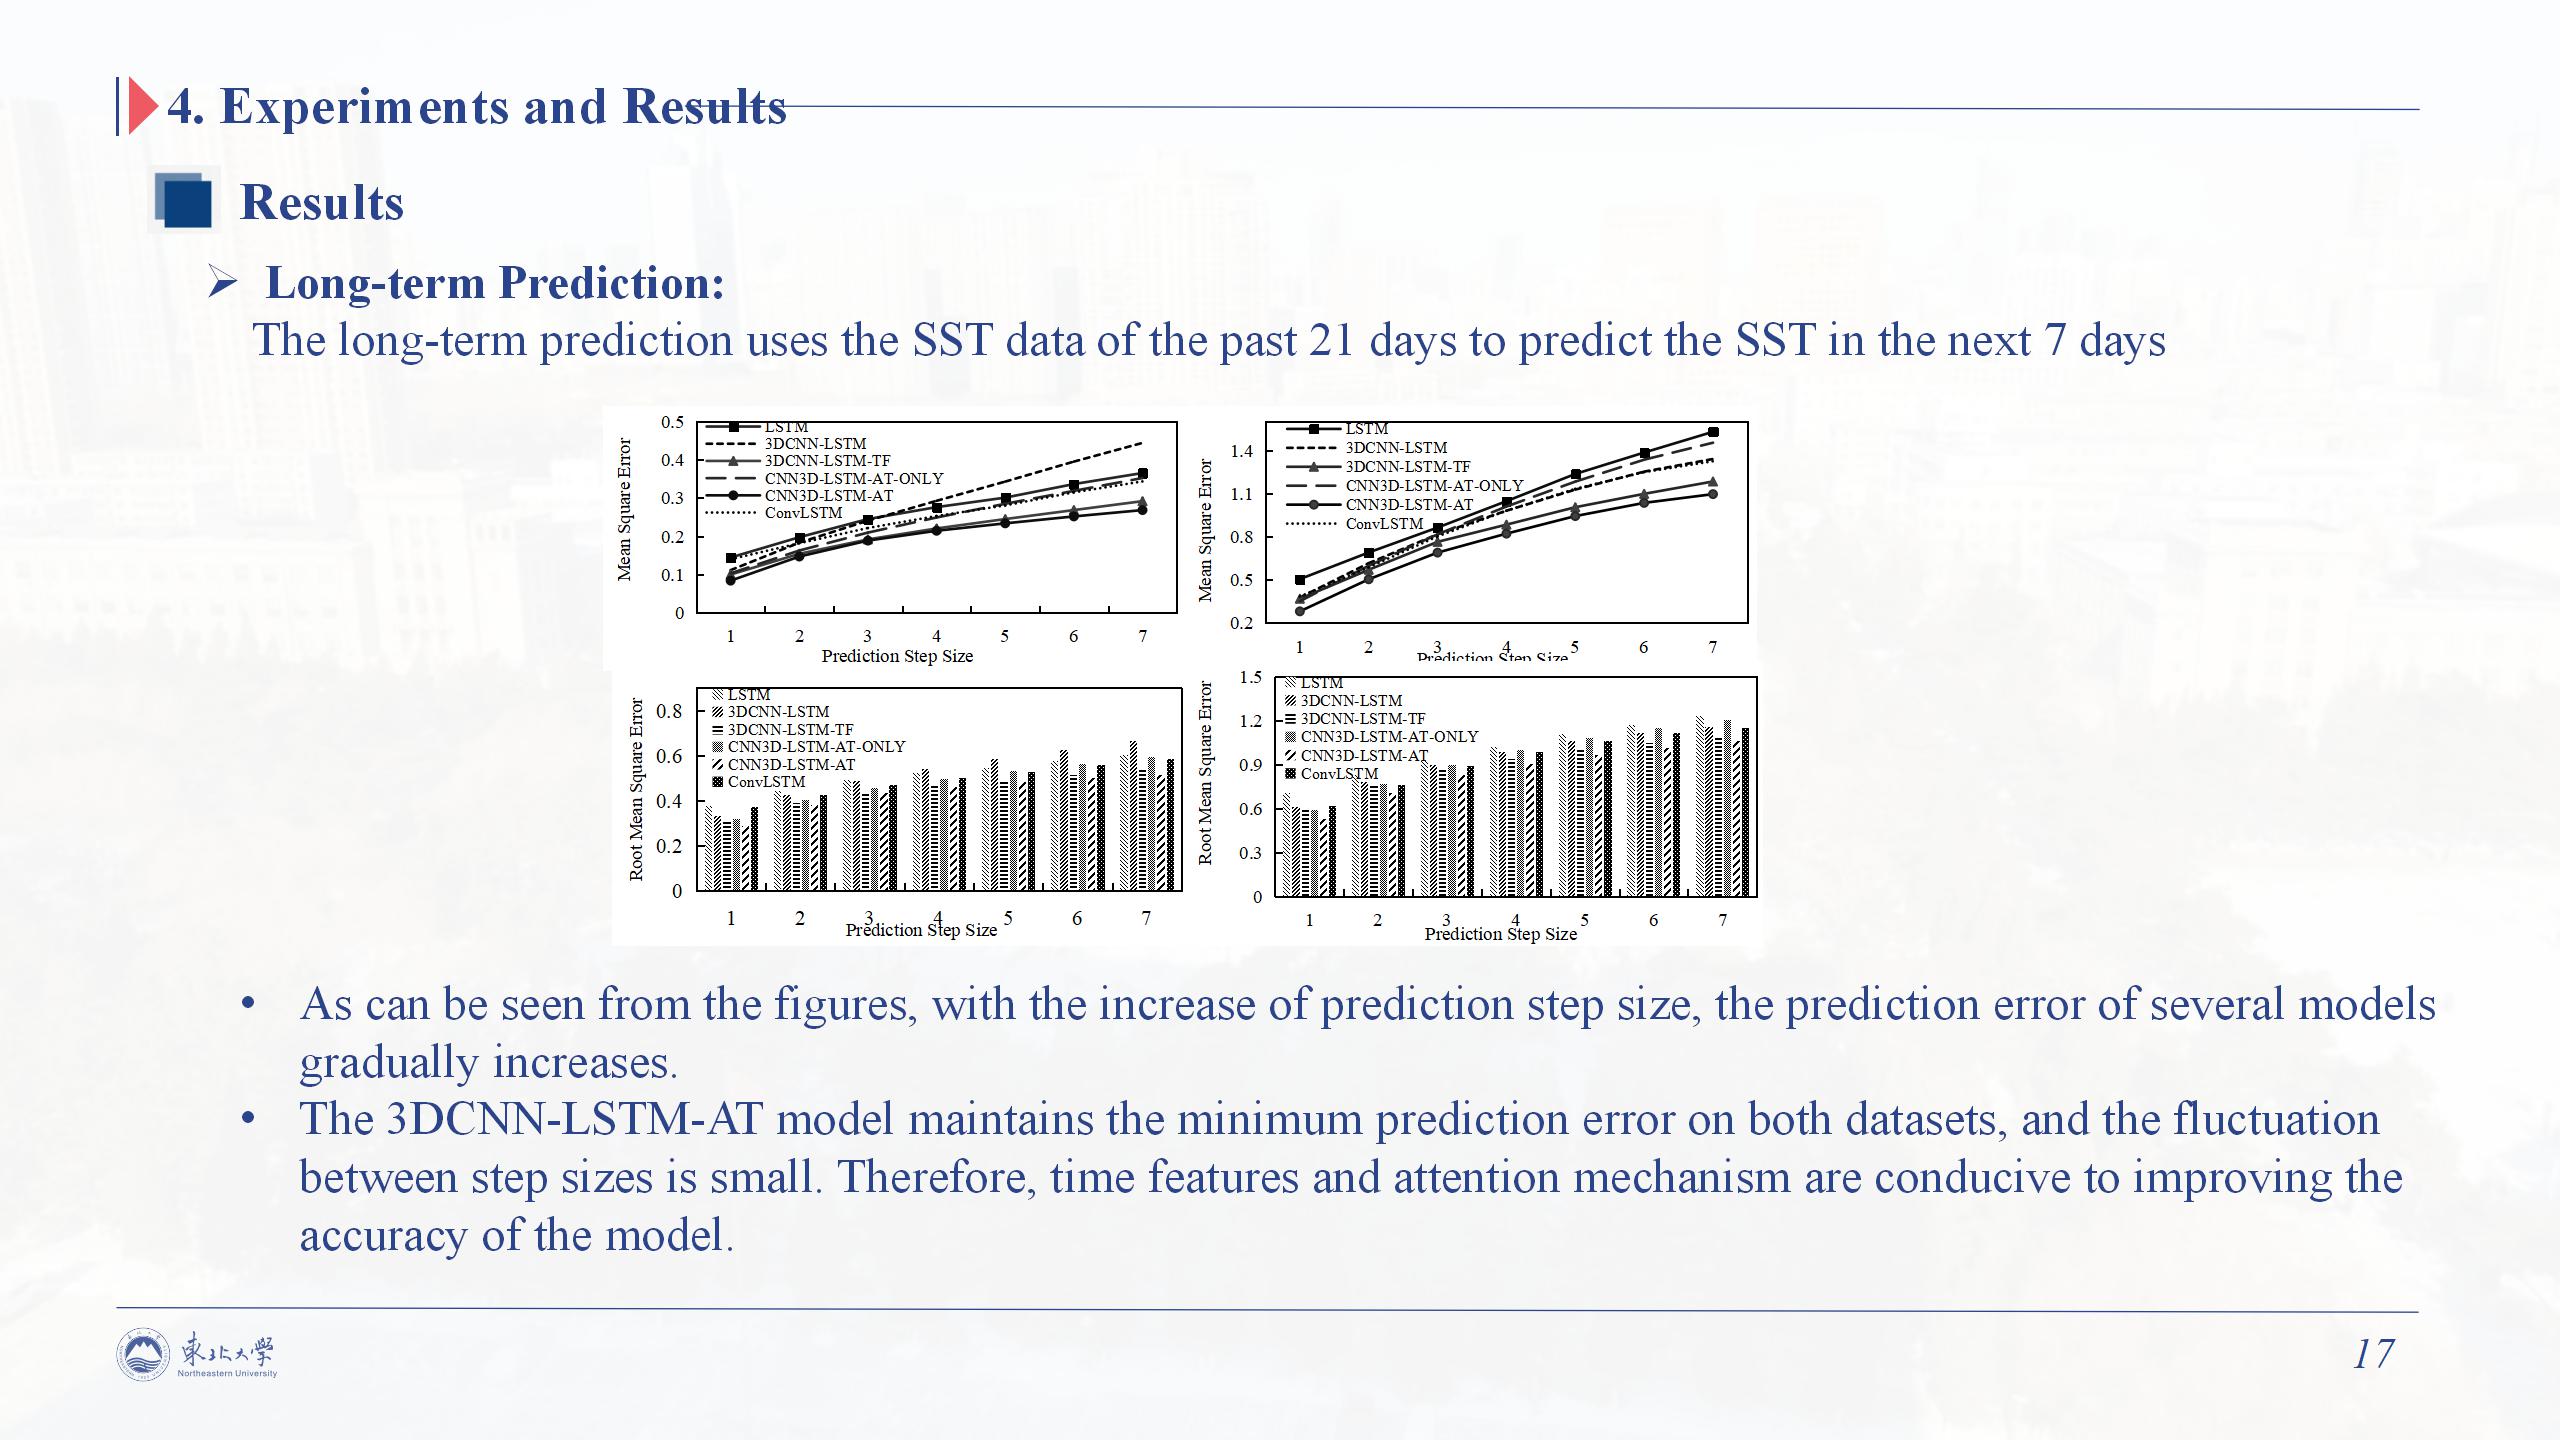 |
The long-term prediction uses the SST data of the past 21 days to predict the SST in the next 7 days. As can be seen from the figures, with the increase of prediction step size, the prediction error of several models gradually increases. The 3DCNN-LSTM-AT model maintains the minimum prediction error on both datasets, and the fluctuation between step sizes is small. Therefore, time features and attention mechanism are conducive to improving the accuracy of the model.
|
| ICACT20210141 Slide.18
[Big Slide]
|
Chrome Click!! |
 |
The last part is Conclusions.
|
| ICACT20210141 Slide.19
[Big Slide]
|
Chrome Click!! |
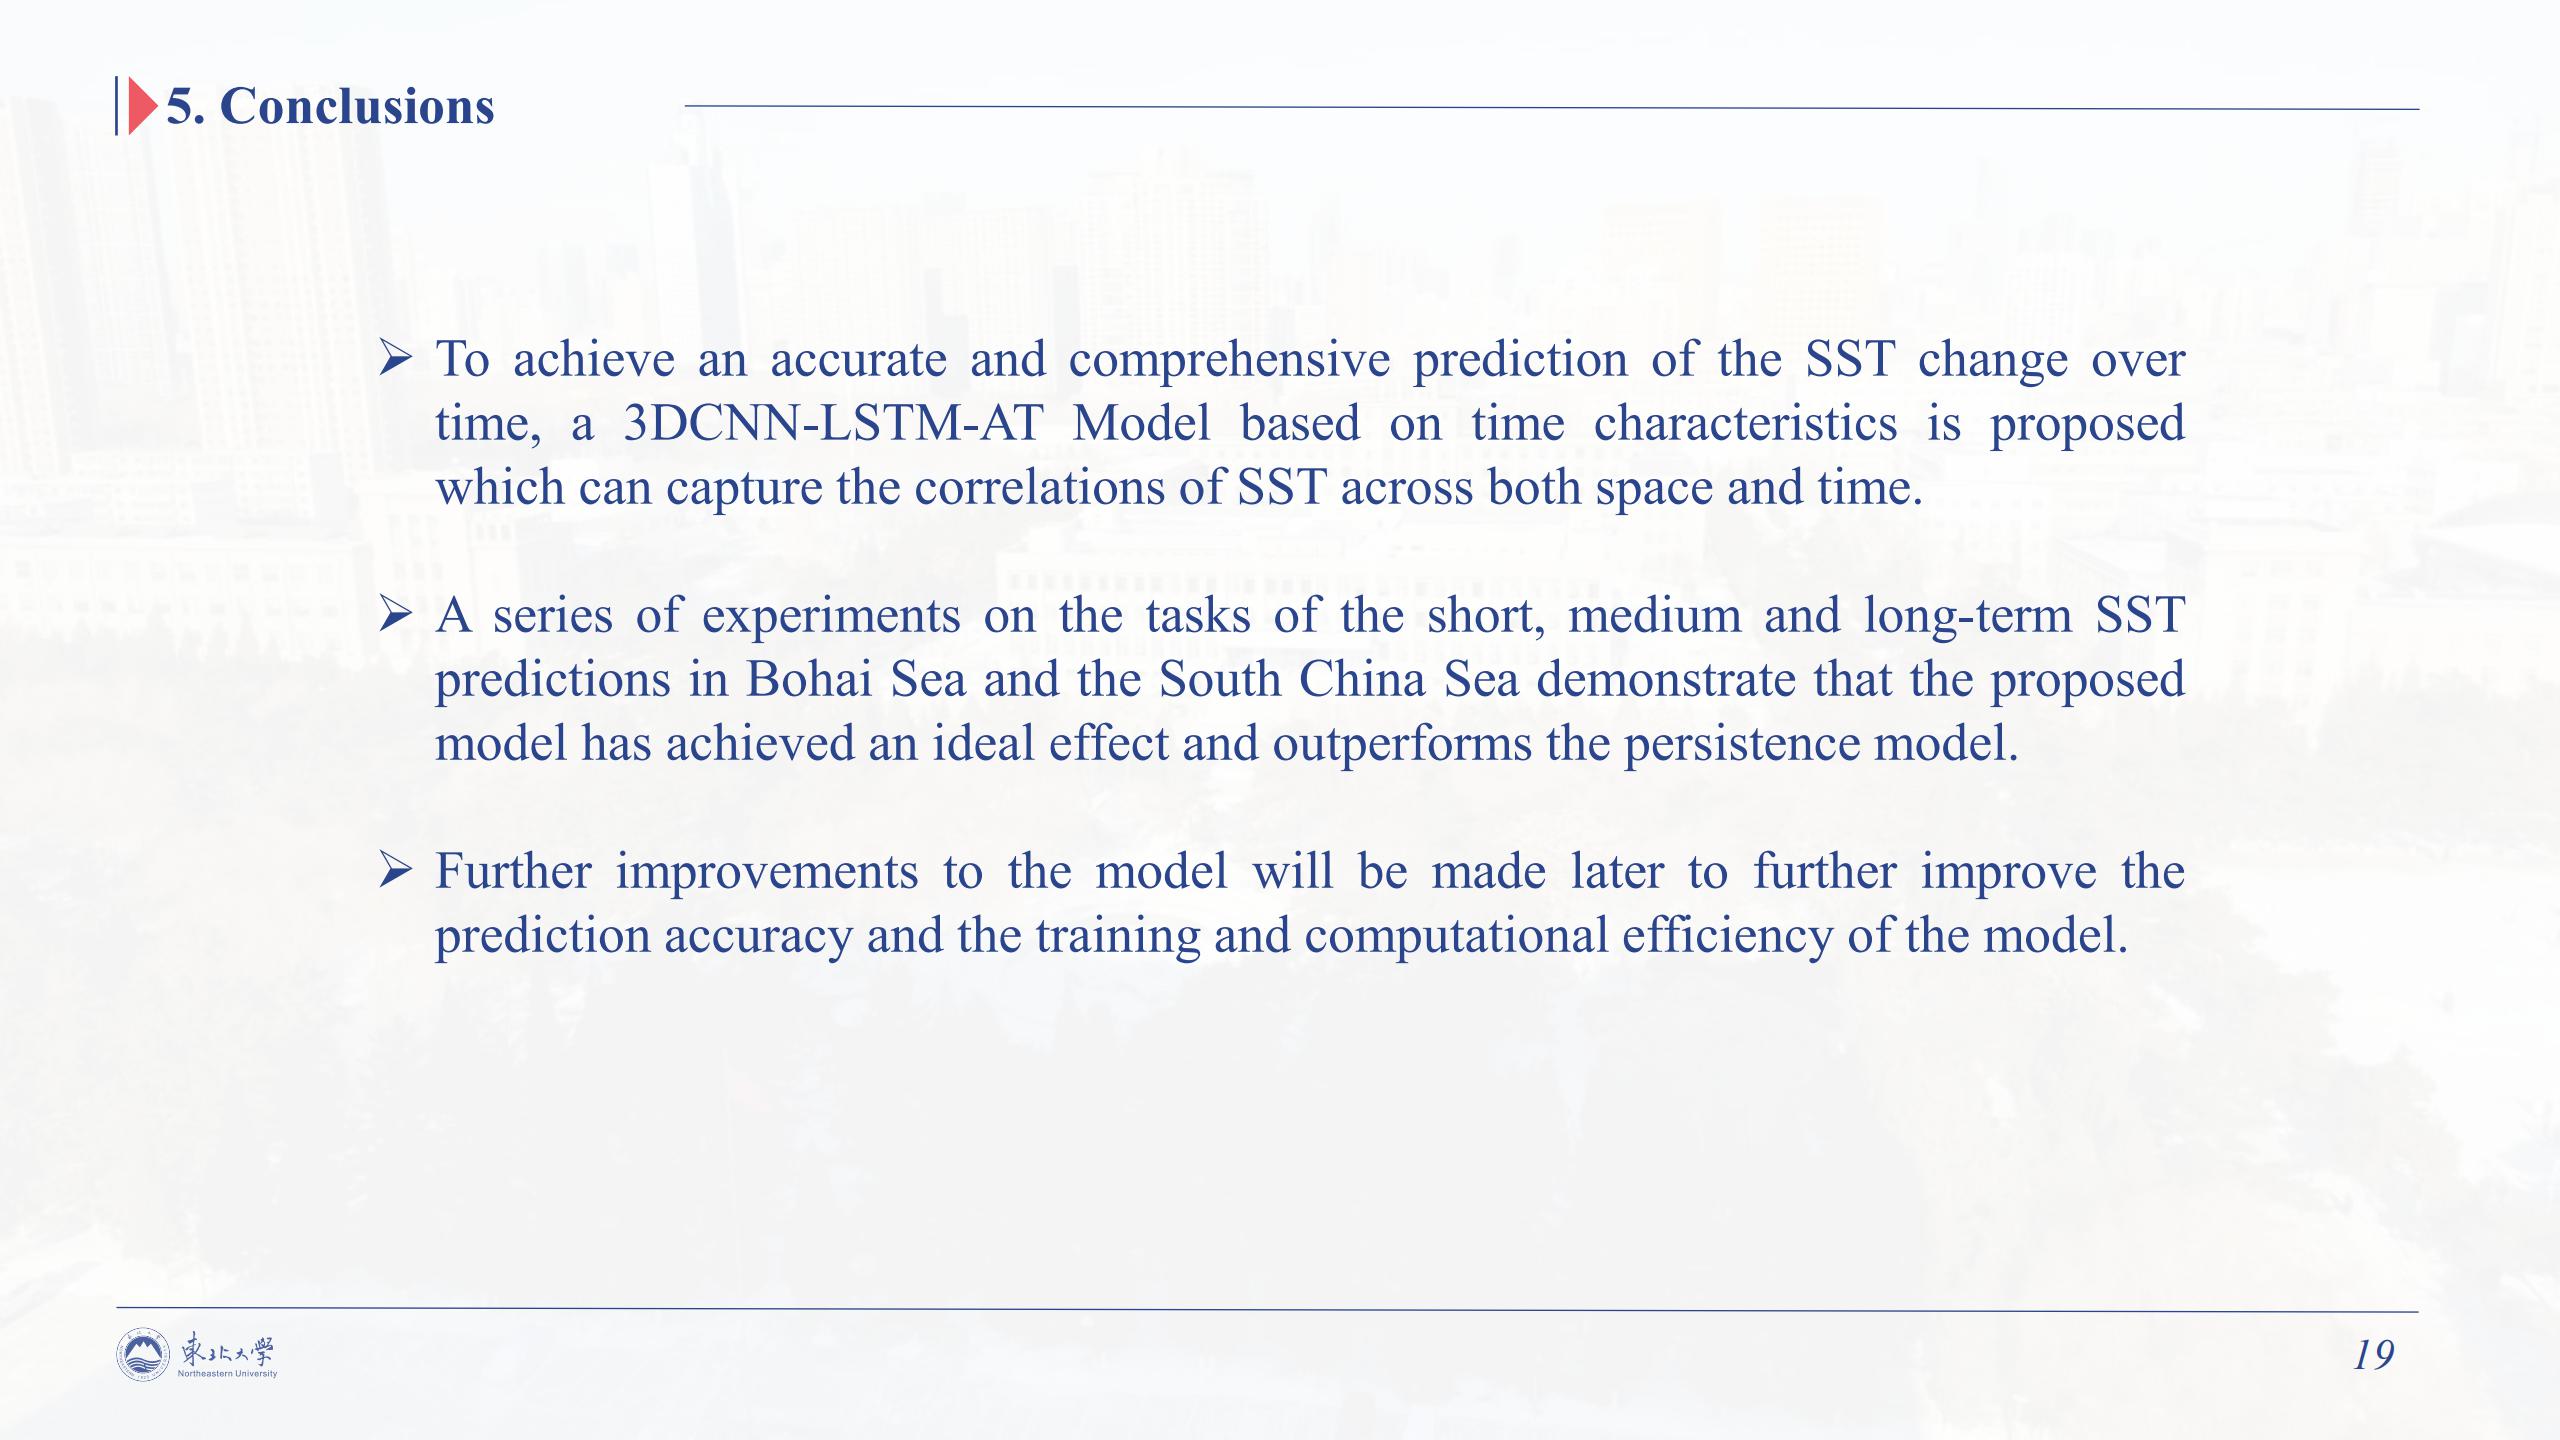 |
To achieve an accurate and comprehensive prediction of the SST change over time, a 3DCNN-LSTM-AT Model based on time characteristics is proposed which can capture the correlations of SST across both space and time. A series of experiments on the tasks of the short, medium and long-term SST predictions in Bohai Sea and the South China Sea demonstrate that the proposed model has achieved an ideal effect and outperforms the persistence model. Further improvements to the model will be made later to further improve the prediction accuracy and the training and computational efficiency of the model.
|
| ICACT20210141 Slide.20
[Big Slide]
|
Chrome Click!! |
 |
Thanks for watching.
|















