 ICACT20210172 Slide.01
[Big Slide]
[YouTube] |
Chrome  Click!! |
 |
Hi, I’m Tetsuya Iye from Kozo Keikaku Engineering Incorporated in Tokyo, Japan.
I’m glad to have a chance to present our research.
Today, I will talk about a summary of our simulation and experimental study on 28 GHz analog beamforming.
This research is supported by the Ministry of Internal Affairs and Communications in Japan.
|
| ICACT20210172 Slide.02
[Big Slide]
|
Chrome Click!! |
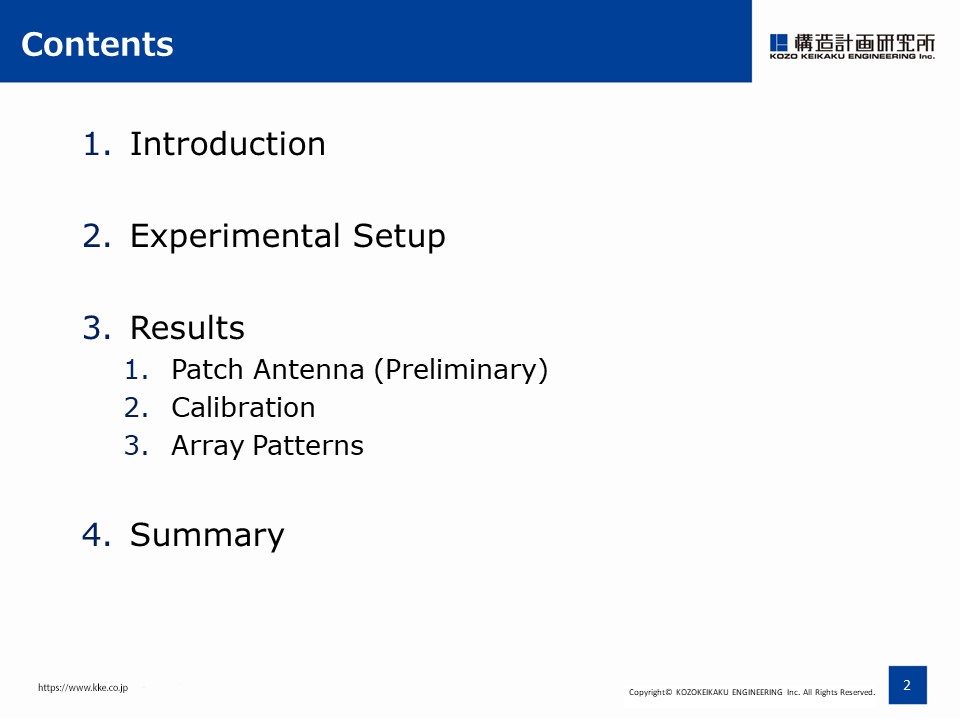 |
Here is the outline of my presentation.
First, I give a brief introduction, and next, show the experimental setup for our analog beamforming.
Then, report the experimental results of patch antenna, calibration for analog beamformer and the array antenna patterns.
Finally, I summarize our conclusion. |
| ICACT20210172 Slide.03
[Big Slide]
|
Chrome Click!! |
 |
So, let me begin by talking about our research background.
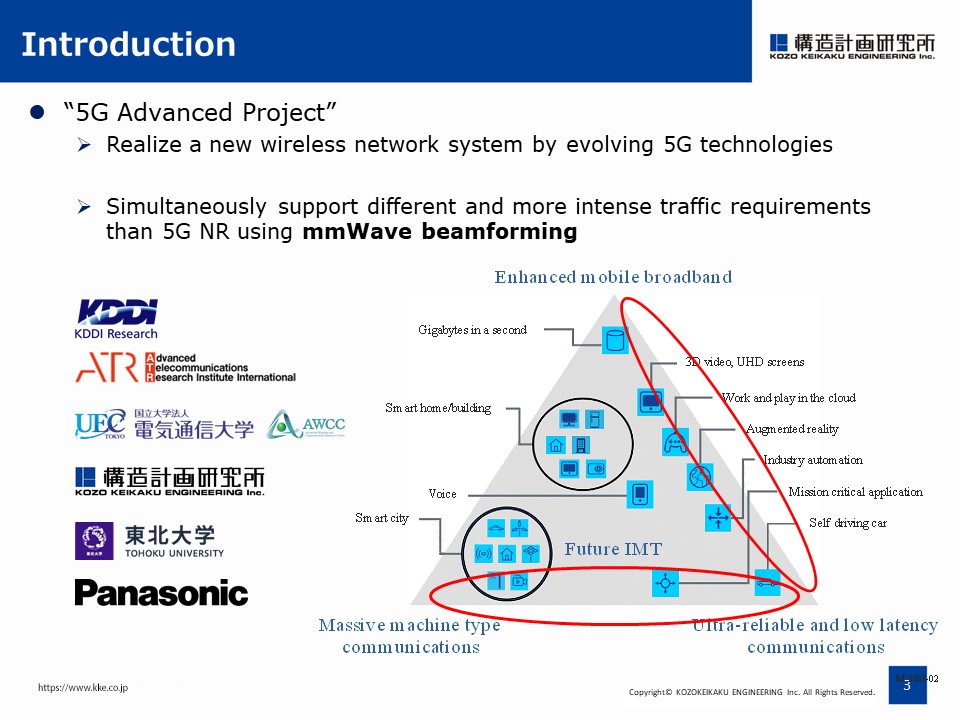
Our group drives a nationally funded research project called ‘5G Advanced Project’.
Its goal is to realize a new wireless network system by evolving 5G technologies.
The system will simultaneously support different and more intense traffic requirements than 5G NR such as massive machine type communications and low latency or enhanced mobile broadband and ultra-reliability using broadband millimeter-wave beamforming.
|
| ICACT20210172 Slide.04
[Big Slide]
|
Chrome Click!! |
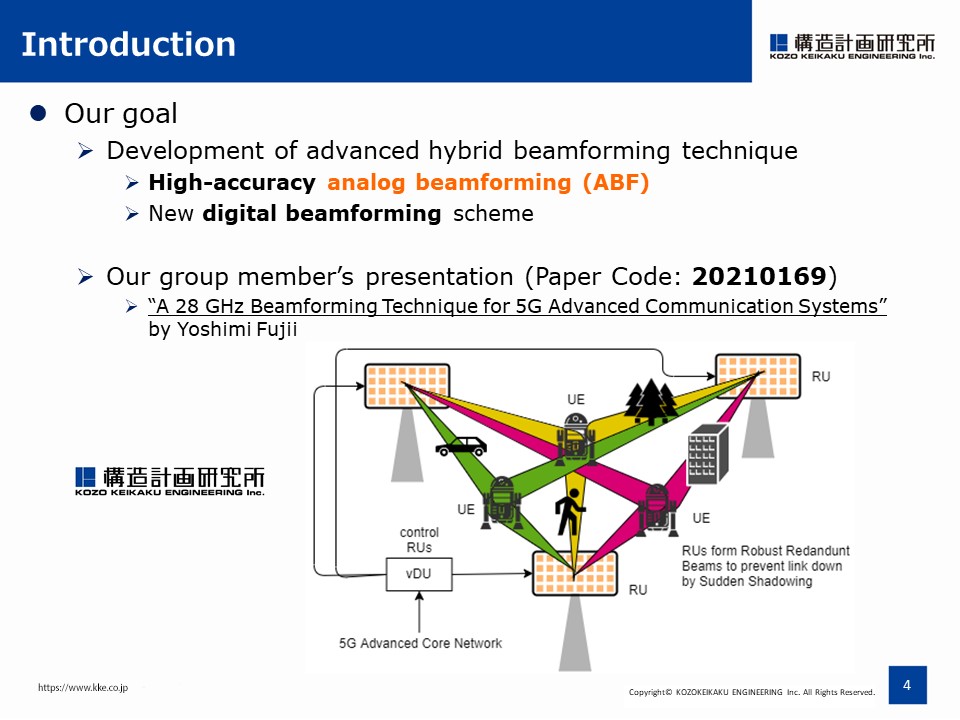 |
We are now working on the development of advanced hybrid beamforming technique by combining high-accuracy analog beamforming and a new digital beamforming scheme.
In this work, we focus on the simulation and experimental results of analog beamforming.
To see the overview of our research plan, please listen to our group member’s presentation of paper code 20210169.
|
| ICACT20210172 Slide.05
[Big Slide]
|
Chrome Click!! |
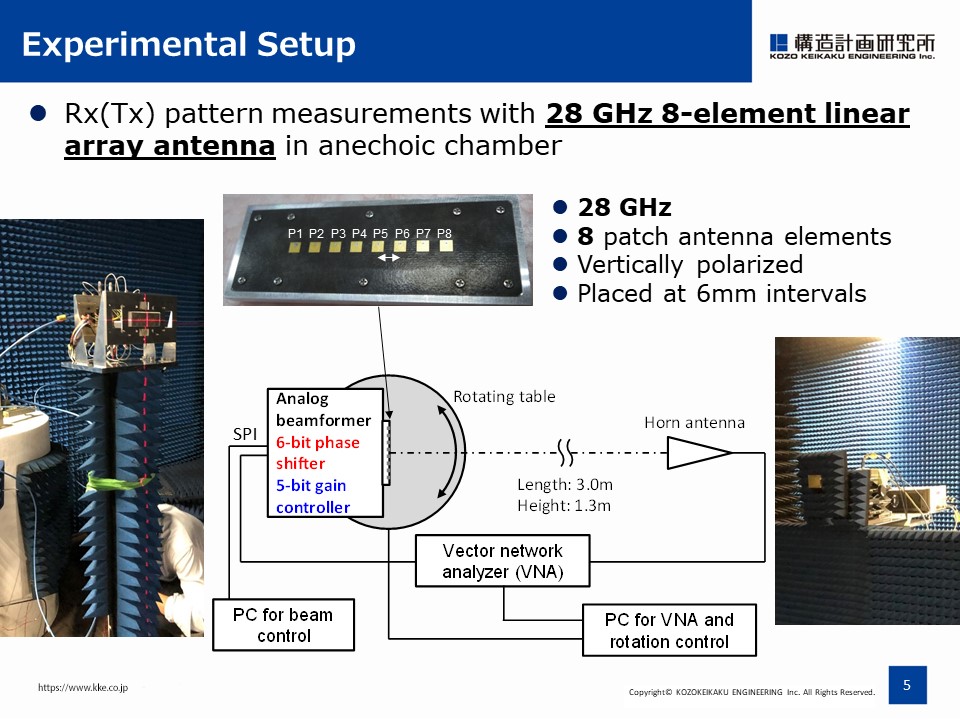 |
This is the schematic top view of the radiation pattern measurement setup for 28 GHz antenna in an anechoic chamber.
The 8-element linear array antenna and the analog beamformer with 6-bit phase shifter and 5-bit gain controller are mounted on the rotating table.
The array antenna is positioned by laser.
Tx and Rx pattern measurements are switched by connecting the up-down converter to the Rx side unit.
I maily report Rx measurement results in this talk because Tx results are almost the same.
All the equipments are covered by the absorber to avoid any extrisic effects on the experimental results.
|
| ICACT20210172 Slide.06
[Big Slide]
|
Chrome Click!! |
 |
Let’s move on to the experimental results.
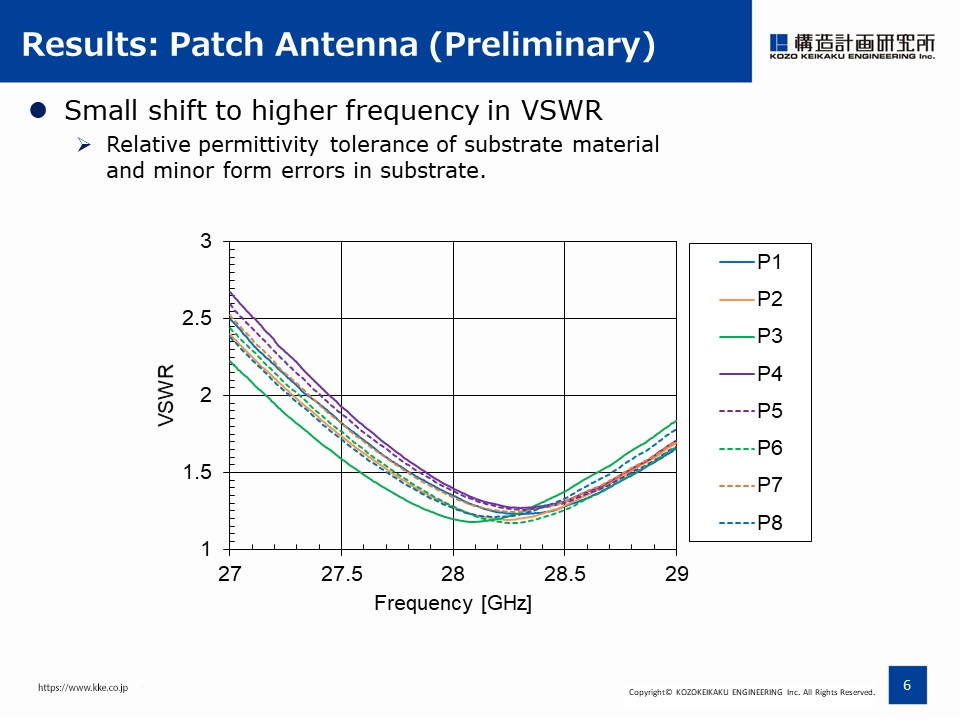
This VSWR result is obtained by measuring individual patch antennas on the array as a preliminary experiment.
You can see a small shift of VSWR curves to higher frequency.
This may come from relative permittivity tolerance of substrate material and minor form errors in substrate.
|
| ICACT20210172 Slide.07
[Big Slide]
|
Chrome Click!! |
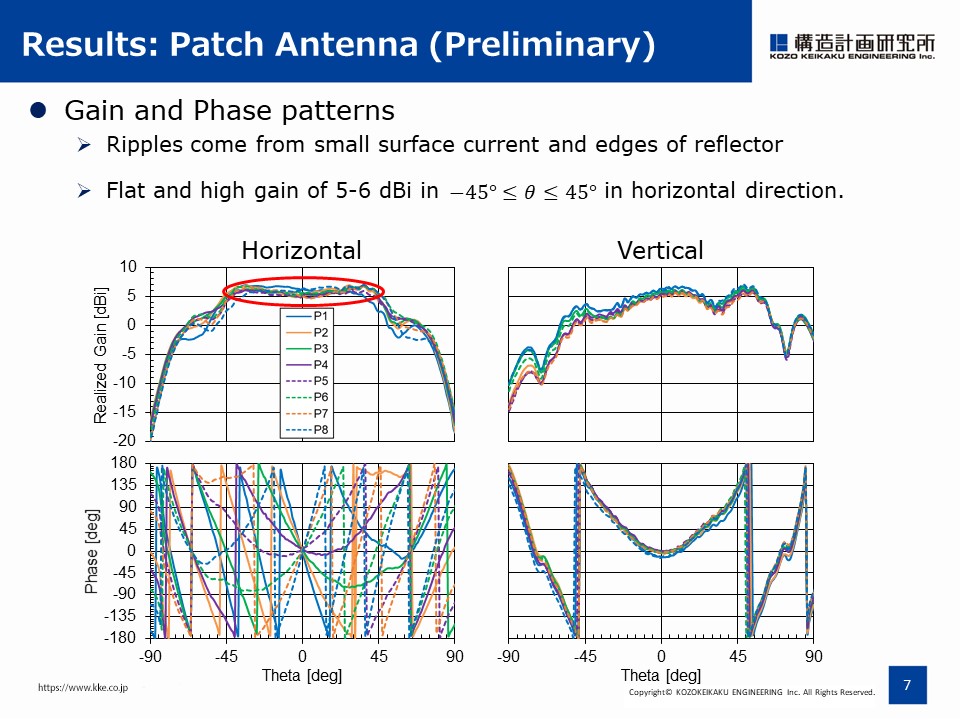 |
Gain and phase patterns are also measured.
Gain pattern in horizontal direction for each patch antenna elements from P1 to P8 show flat and high gain of about 5-6 dBi in the range of from -45 to +45 degree.
We can see small ripples in the range of 30 to 60 degree, which come from small surface current and the edges of the reflector.
|
| ICACT20210172 Slide.08
[Big Slide]
|
Chrome Click!! |
 |
In our beamformer, there are initial phase and gain offset differences between the element ports due to some mechanical errors.
So, we need to calibrate and minimize them to achieve higher beam control accuracy.
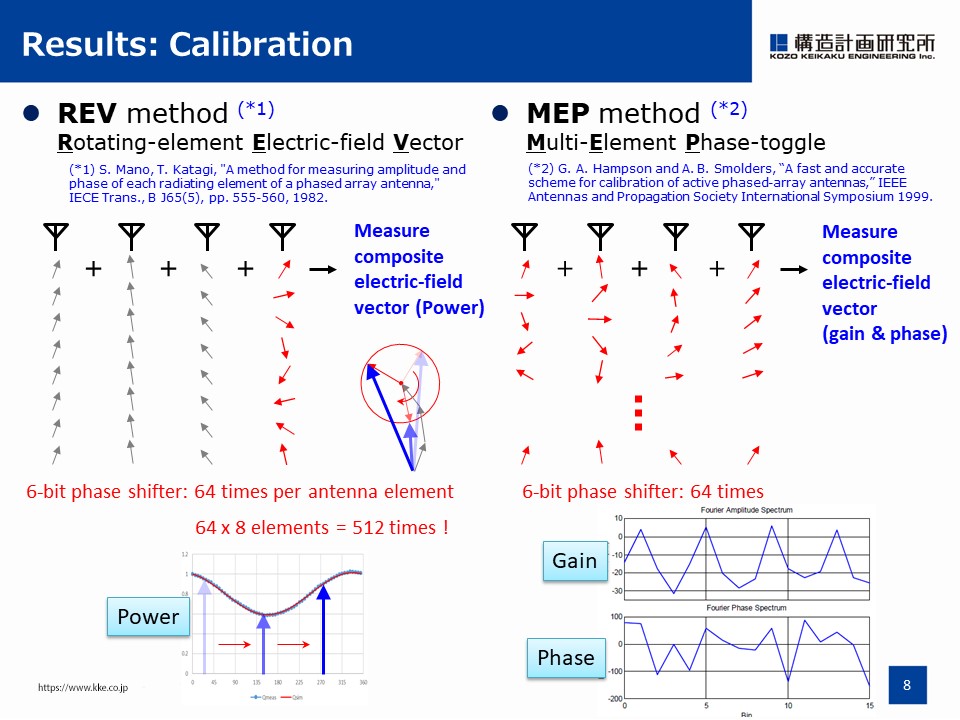
We adopted so-called REV method and MEP method as they are the well-established and well-known calibration technique for the phased array antenna for satellite communication.
REV needs only power measurement, so the experimental setup can be simplified but it requires much time to collect the data for calibration.
In our case, we measured the amplitude of composite electric-field vector 512 times.
On the other hand, MEP needs phase and gain measurements, so the setup may be complicated but it takes less time.
In this method, the composite vector variation is observed while the phases of multiple elements are simultaneously shifted with different intervals.
And then, the electric fields of the corresponding elements can be obtained by using an FFT for the measured field variation.
Although MEP is faster and more efficient than REV, it requires more accurate phase measurements.
|
| ICACT20210172 Slide.09
[Big Slide]
|
Chrome Click!! |
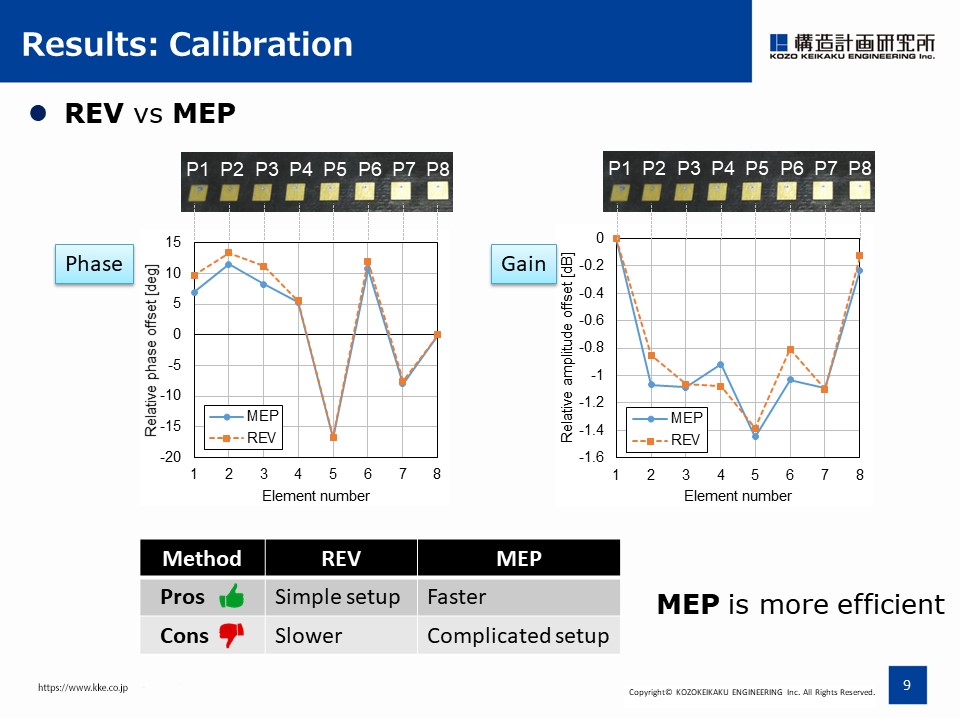 |
Here, you can see the results of relative phase and gain offsets for each antenna port in the figure.
Both methods show almost the same tendency, so hereafter, we use MEP method for calibration because it is more time-effective.
|
| ICACT20210172 Slide.10
[Big Slide]
|
Chrome Click!! |
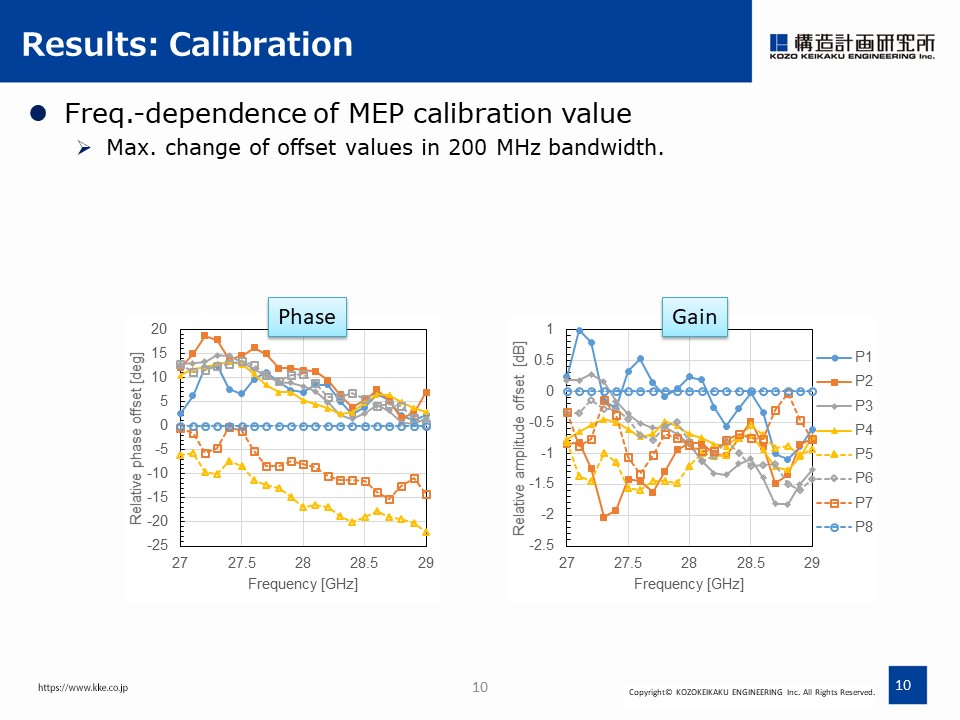 |
In addition, frequency dependence of the phase and amplitude offset values for each port from 27 to 29 GHz is summarized.
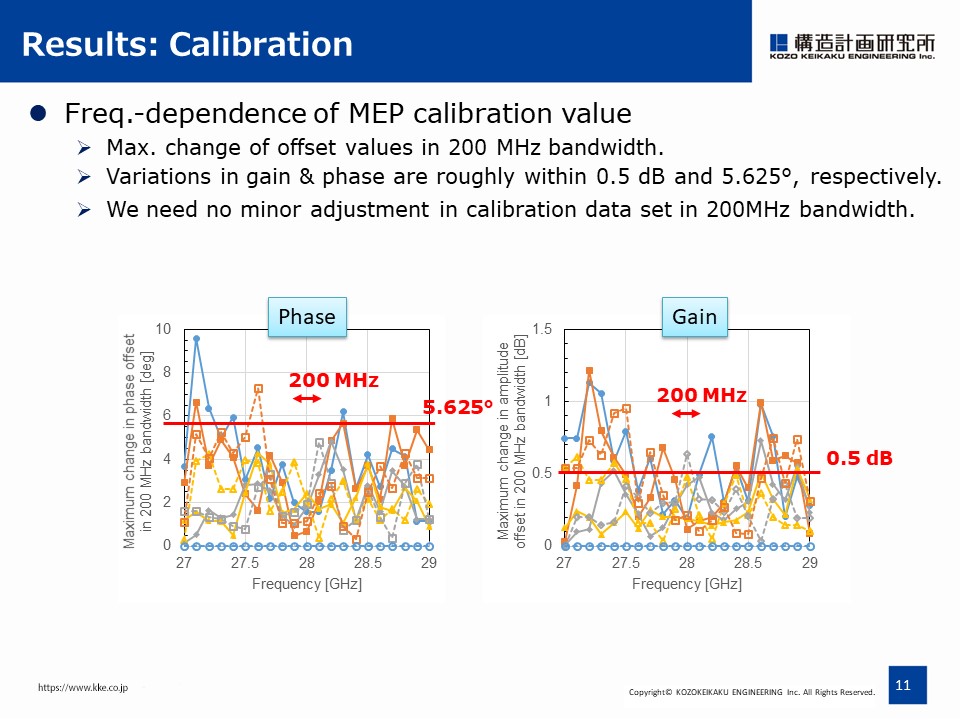
From these results, we further analysed the maximum change in the offset values in 200 MHz bandwidth for each port.
We can evaluate the maximum change by taking the difference between the moving maximum and the moving minimum with the window of 200 MHz with respect to the range from 27 to 29 GHz.
|
| ICACT20210172 Slide.11
[Big Slide]
|
Chrome Click!! |
 |
These are the results.
If we take a look at 28 GHz plus-minus 100 MHz, the offset values fluctuate roughly within the order of one tunable step, in other words, 5.625 degree for phase and 0.5 dB for amplitude.
From these results, the offset values are regarded to be robust against frequency at least around 28 GHz in our analog beamformer.
However, for wider bandwidth over 200 MHz, or for the center frequency other than 28 GHz, the calibration values may be no longer within one tunable step.
The calibration method over the entire bandwidth would be a further study.
|
| ICACT20210172 Slide.12
[Big Slide]
|
Chrome Click!! |
 |
OK, then, let’s take a look at the antenna patterns.
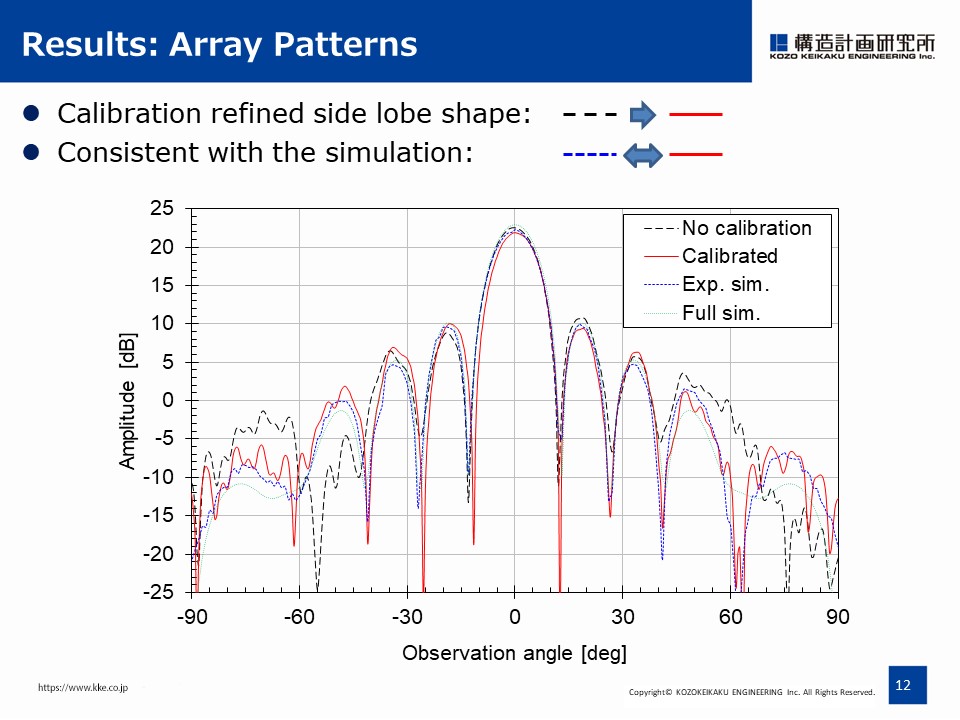
Four different array patterns are compared.
The black dashed line is the array pattern with no calibration.
The red solid line represents the pattern with MEP calibration.
The blue dotted line indicates simulation pattern calculated by combining all the experimental element patterns with no phase or gain errors.
The green small dotted line is the electromagnetic simulation result.
These results show that the calibration refined the sidelobe structure and it is consistent with the blue line of simulation result assuming the ideal case.
|
| ICACT20210172 Slide.13
[Big Slide]
|
Chrome Click!! |
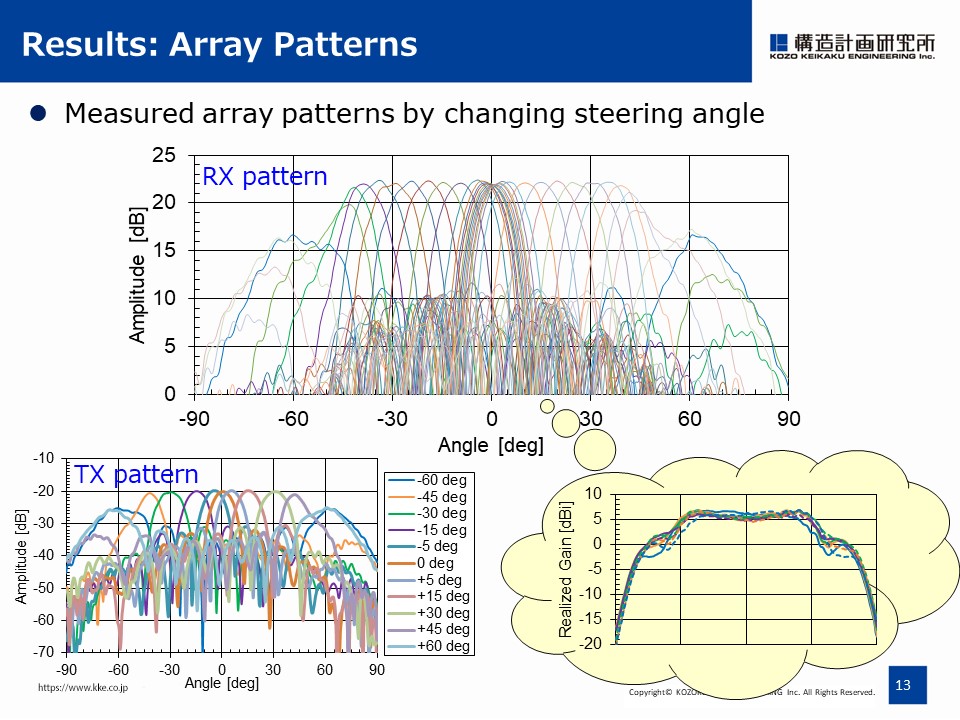 |
Lastly, we measured the array patterns by changing the steering angle from -60 to +60 degrees for TX and RX, respectively.
Both TX and RX patterns show almost the same pattern, indicating the symmetric property of RF circuit for TX and RX.
In addition, the envelope of a family of measured array patterns reflects radiation patterns of antenna elements, and thus, within the visible region from -45 to +45 degree, constant beam gain is realized.
|
| ICACT20210172 Slide.14
[Big Slide]
|
Chrome Click!! |
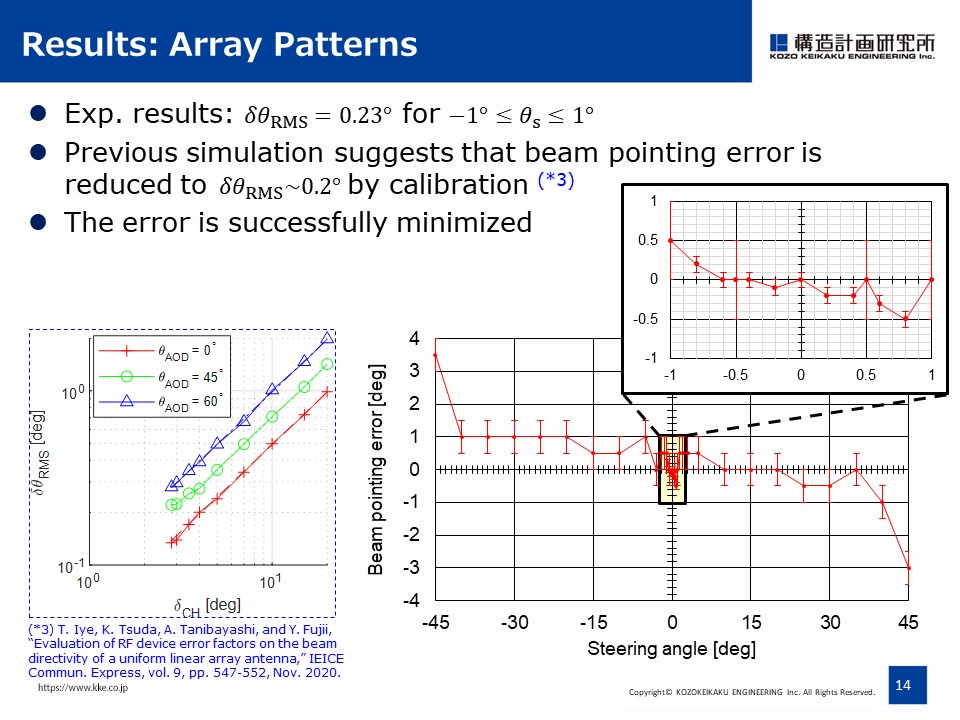 |
We evaluated the beam pointing error is 0.23 degree for around the broadside direction.
Our previous monte carlo simulation study suggests that the pointing error can be reduced to 0.2 degree by the calibration for our analog beamformer.
By comparing the experimental and simulation results, the beam pointing error seems to be successfully minimized.
|
| ICACT20210172 Slide.15
[Big Slide]
|
Chrome Click!! |
 |
Now on to the final part.
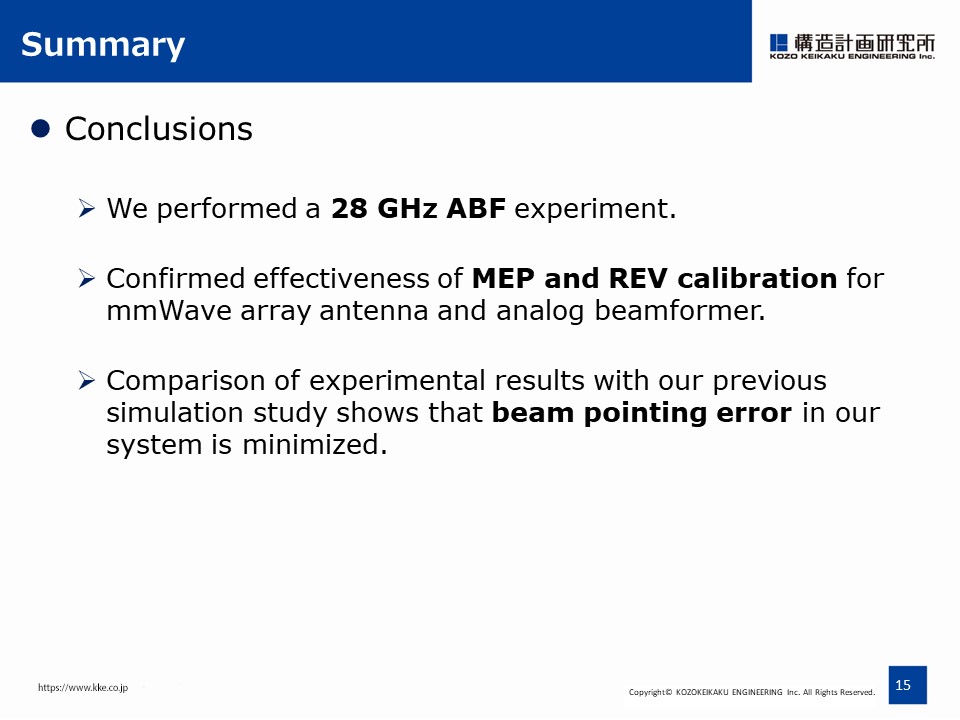
We performed a 28 GHz analog beamforming experiment and then confirmed effectiveness of both MEP and REV calibration methods for millimeter-wave array antenna and analog beamformer.
Then, we adopted MEP calibration for this work for time efficiency.
Comparison of experimental results with our previous simulation study shows that the beam pointing error in our system is minimized.
So we can say that high-accuracy analog beamforming is achieved.
|
| ICACT20210172 Slide.16
[Big Slide]
|
Chrome Click!! |
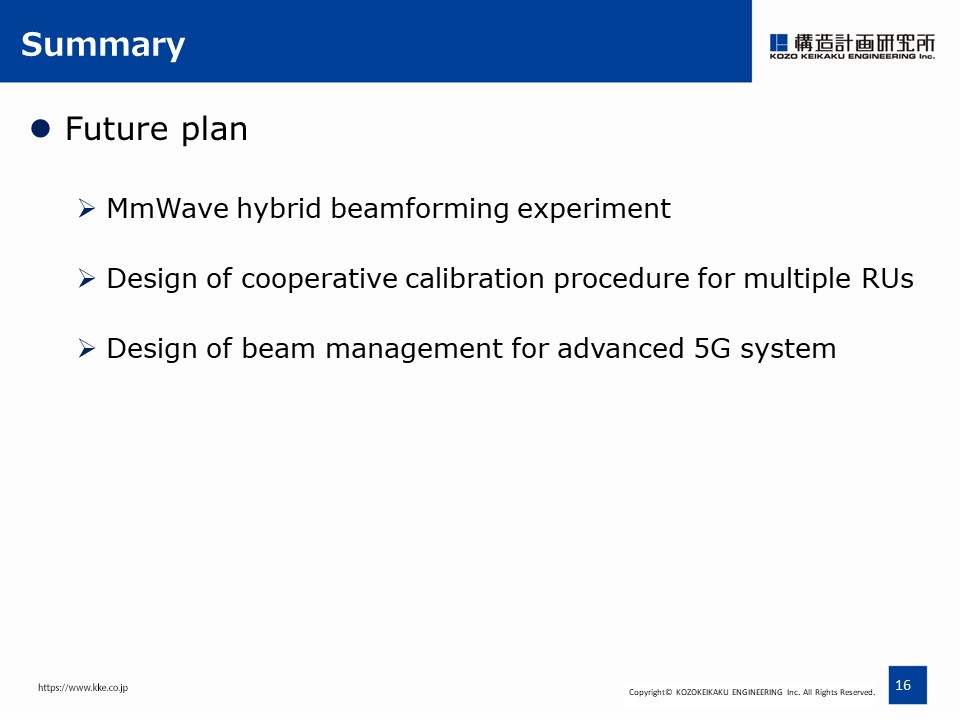 |
As a future plan, we will perform hybrid beamforming experiments using our newly established digital beamforming scheme.
We also design cooperative calibration procedure for multiple remote units and their beam management process for advanced 5G system.
Finally I would like to thank Akihiro Hara and Takehiko Imamura from Tamagawa Electronics Company Limited for experimental supports and useful discussions.
This is all, and thank you very much for your kind attention.
|















