 ICACT20210205 Slide.01
[Big Slide] |
Chrome  Click!! |
 |
Hello, everyone. My name is Chun-Hee Lee. I am going to talk about the relocation problem in bicycle-sharing systems. Especially, our team is collaborating with Sejong city in Korea and is trying to deploy our system to the Sejong bicycle-sharing system. |
| ICACT20210205 Slide.02
[Big Slide]
|
Chrome Click!! |
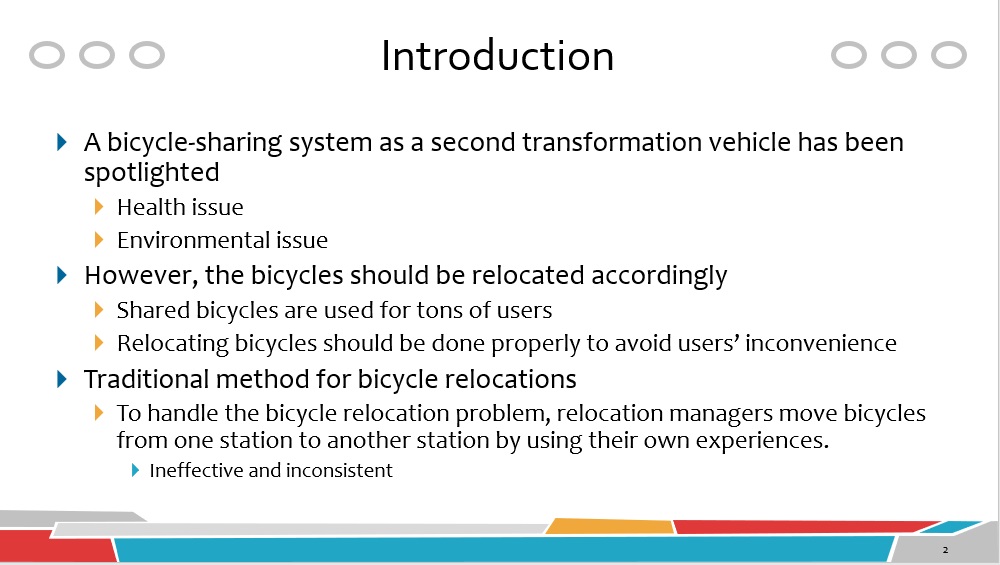 |
Recently, a bicycle-sharing system as a second transformation vehicle has been spotlighted because of health and environmental issue. However, because shared bicycles are used for tons of users, the bicycles should be relocated accordingly. Otherwise, it leads to users’ inconvenience. As a traditional method, many local governments employ relocation managers. Relocation managers move bicycles from one station to another station by using their own experiences. But, it is ineffective and inconsistent. |
| ICACT20210205 Slide.03
[Big Slide]
|
Chrome Click!! |
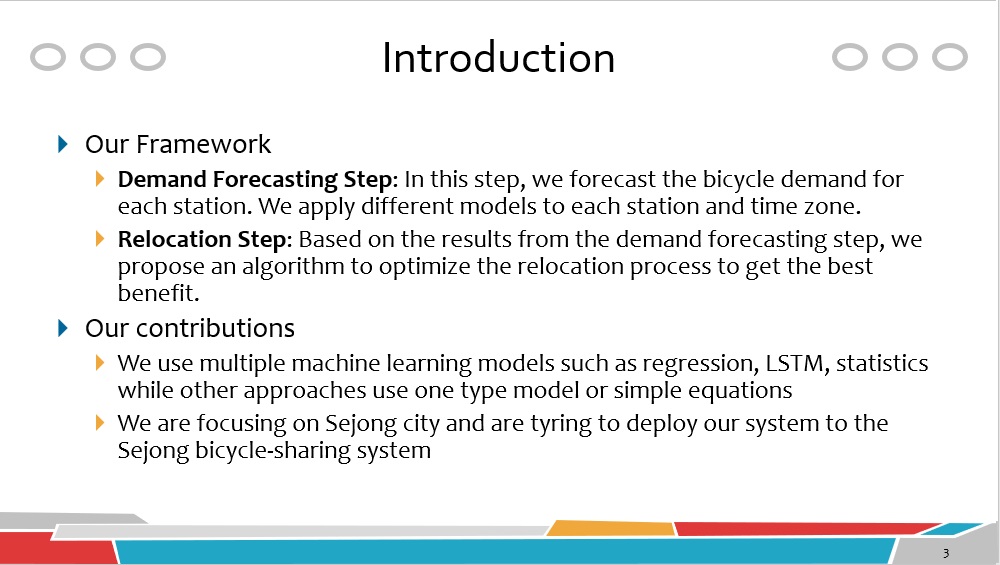 |
We propose our framework to handle the relocation problem in the bicycle-sharing system. Our framework consists of two steps, demand forecasting step and relocation step. In demand forecasting step, we forecast the bicycle demand for each station. In relocation step, we propose an algorithm to optimize the relocation process to get the best benefit.
Now, I am going to talk about the contribution of this paper. We use multiple machine learning models such as regression, LSTM, statistics while other approaches use one type model or simple equations. We are focusing on Sejong city and are tyring to deploy our system to the Sejong bicycle-sharing system.
|
| ICACT20210205 Slide.04
[Big Slide]
|
Chrome Click!! |
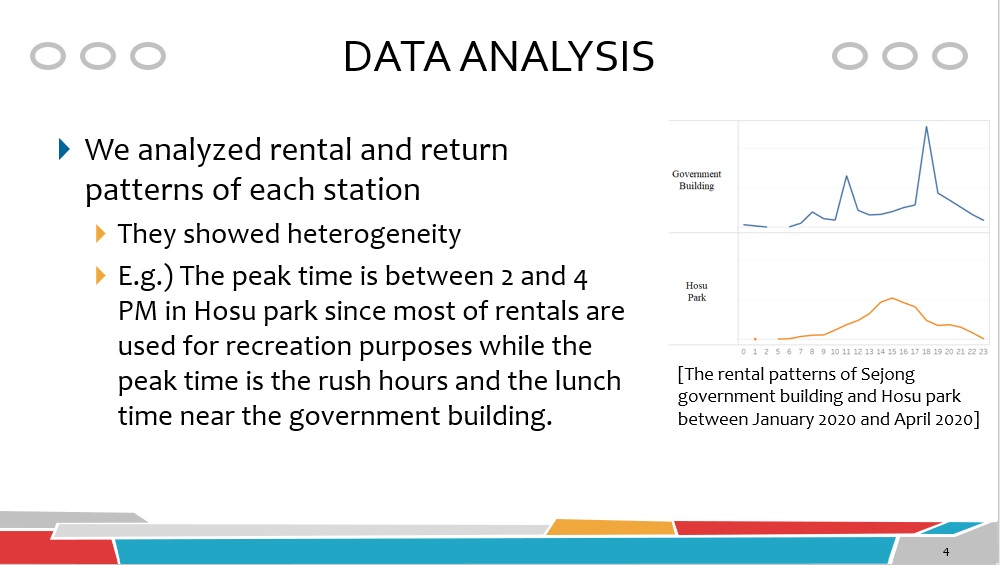 |
Before designing demand forecasting models, we analyzed rental and return patterns of each station. They showed heterogeneity.
For example, see the cases of Sejong government building and Hosu park as shown in the right part of this slide. The peak time is between 2 and 4 PM in Hosu park since most of rentals are used for recreation purposes while the peak time is the rush hours and the lunch time near the government building. |
| ICACT20210205 Slide.05
[Big Slide]
|
Chrome Click!! |
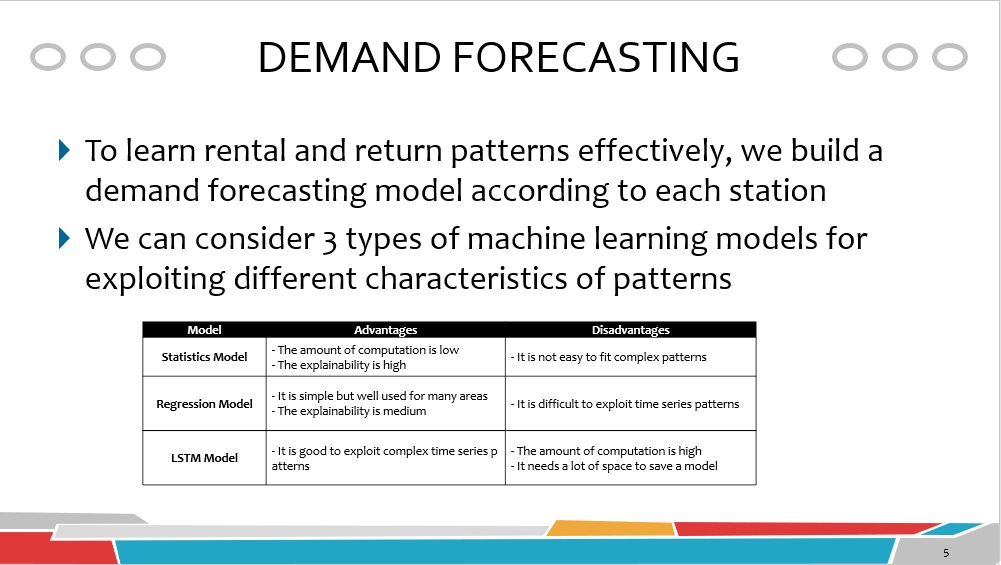 |
To learn rental and return patterns effectively, we build a demand forecasting model according to each station. We can consider 3 types of machine learning models for exploiting different characteristics of patterns. Pros and cons of each model are summarized in the table. |
| ICACT20210205 Slide.06
[Big Slide]
|
Chrome Click!! |
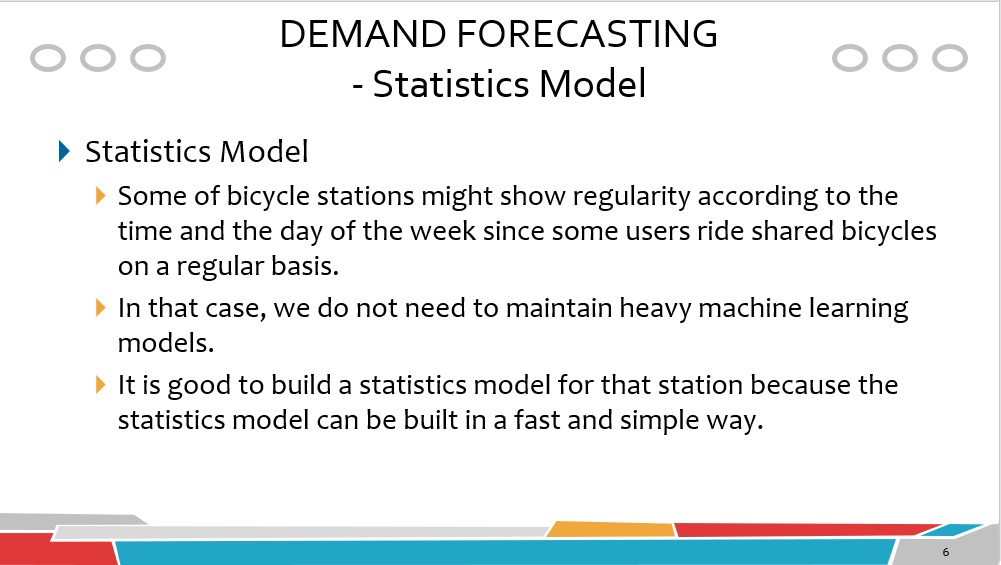 |
We consider a simple statistics model. Some of bicycle stations might show regularity according to the time and the day of the week since some users ride shared bicycles on a regular basis. In that case, we do not need to maintain heavy machine learning models. It is good to build a statistics model for that station because the statistics model can be built in a fast and simple way. |
| ICACT20210205 Slide.07
[Big Slide]
|
Chrome Click!! |
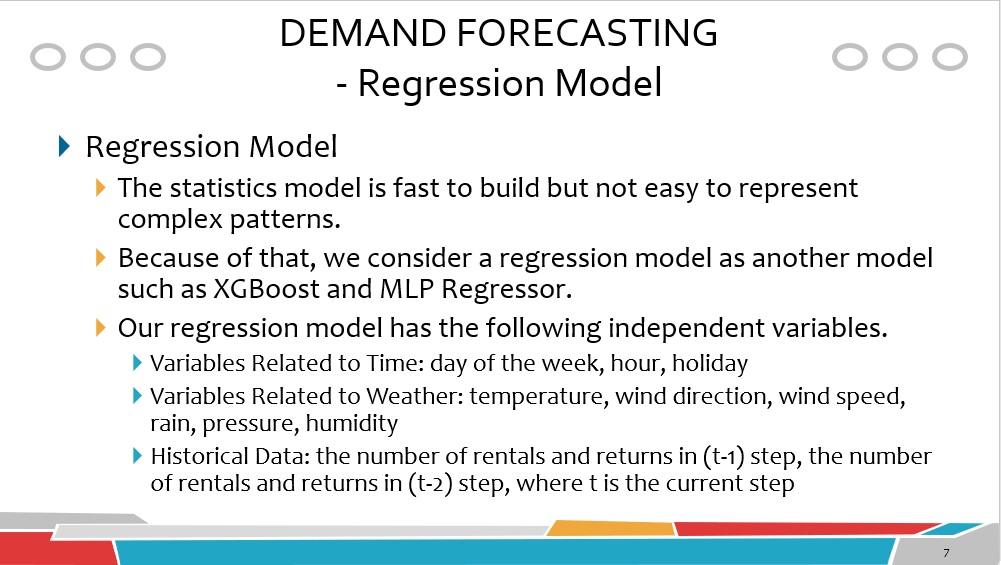 |
As summarized in the table of the previous slide, the statistics model is fast to build but not easy to represent complex patterns. Because of that, we consider a regression model as another model such as XGBoost and MLP Regressor. The regression model can fit more complex patterns than the statistics model. To fit the regression model better, we can add external data. For example, the weather significantly impacts on the rental/return patterns of shared bicycles. Thus, we add the weather data to fit the regression model better. Also, current bicycle demands can be affected by the previous status. Therefore, we add the historical data to the model. Therefore, our regression model has several independent variables. Variables related to time are day of the week, hour, holiday. Variables related to weather are temperature, wind direction, wind speed, rain, pressure, humidity. Historical data are the number of rentals and returns in (t-1) step, the number of rentals and returns in (t-2) step. |
| ICACT20210205 Slide.08
[Big Slide]
|
Chrome Click!! |
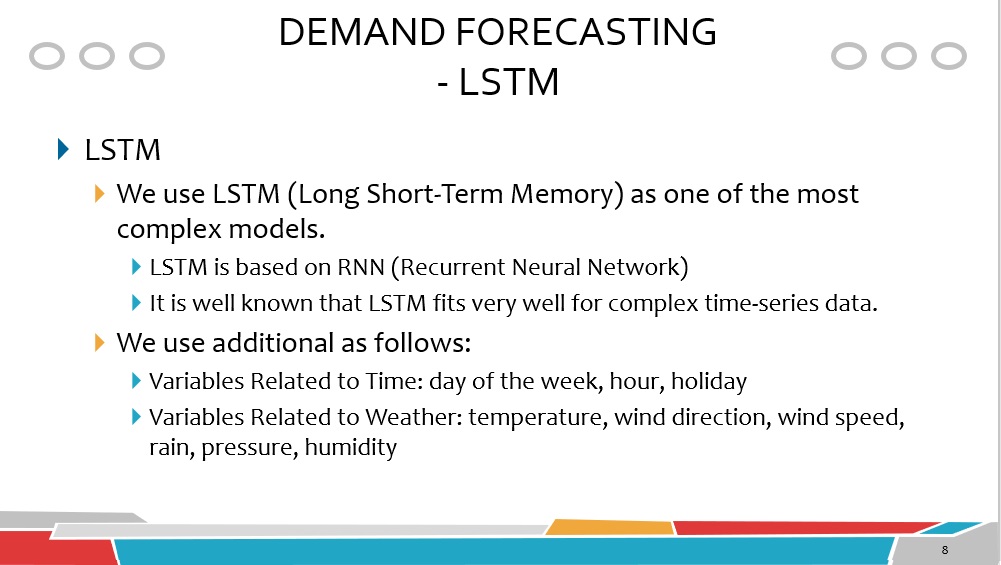 |
Finally, we use LSTM (Long Short-Term Memory). LSTM is based on RNN (Recurrent Neural Network). It is well known that LSTM fits very well for complex time-series data. To fit the LSTM model, we use additional data like the regression model. Variables related to time are day of the week, hour, holiday. Variables related to weather are temperature, wind direction, wind speed, rain, pressure, humidity. |
| ICACT20210205 Slide.09
[Big Slide]
|
Chrome Click!! |
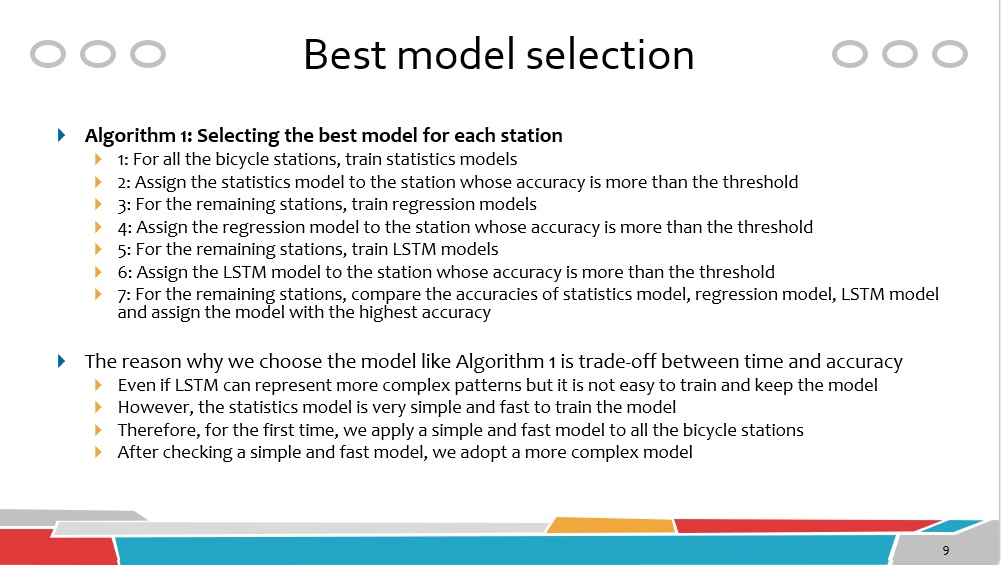 |
This slide describes the algorithm to choose the best model. The algorithm has 7 steps as shown in this slide. The reason why we choose the model like this Algorithm is trade-off between time and accuracy. Even if LSTM can represent more complex patterns but it is not easy to train and keep the model. However, the statistics model is very simple and fast to train the model. Therefore, for the first time, we apply a simple and fast model to all the bicycle stations. After checking a simple and fast model, we adopt a more complex model. |
| ICACT20210205 Slide.10
[Big Slide]
|
Chrome Click!! |
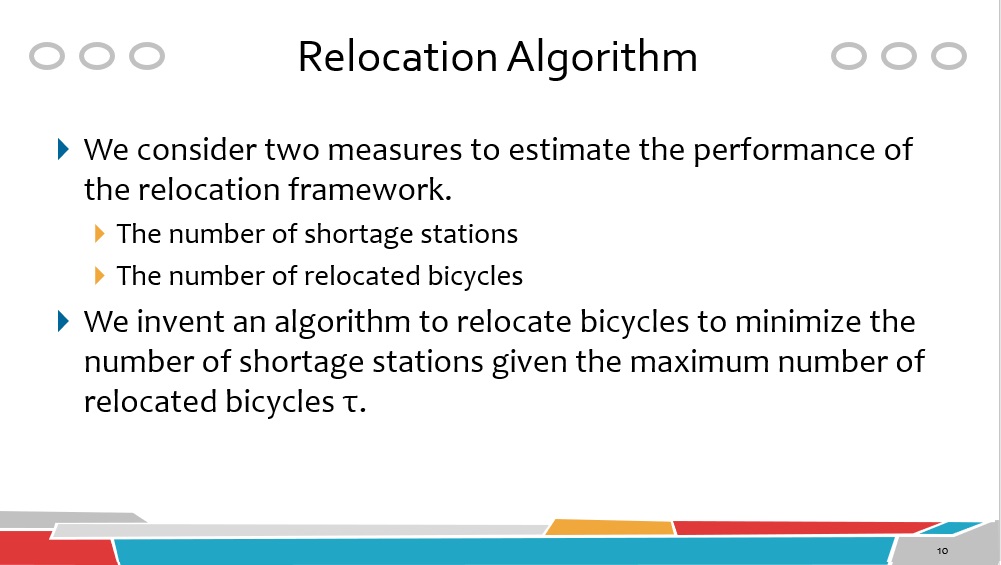 |
We consider two measures to estimate the performance of the relocation framework. The first measure is the number of shortage stations. The shortage station means the station whose parked bicycles are 0. We have to fill bicycles in that station. The second measure is the number of relocated bicycles. It is the number of bicycles to be relocated by the relocation manager. Because we assume that the driving cost is 0, if we move N bicycles from one station to another station, the number of relocated bicycles is N. In this paper, we invent an algorithm to relocate bicycles to minimize the number of shortage stations given the maximum number of relocated bicycles τ. |
| ICACT20210205 Slide.11
[Big Slide]
|
Chrome Click!! |
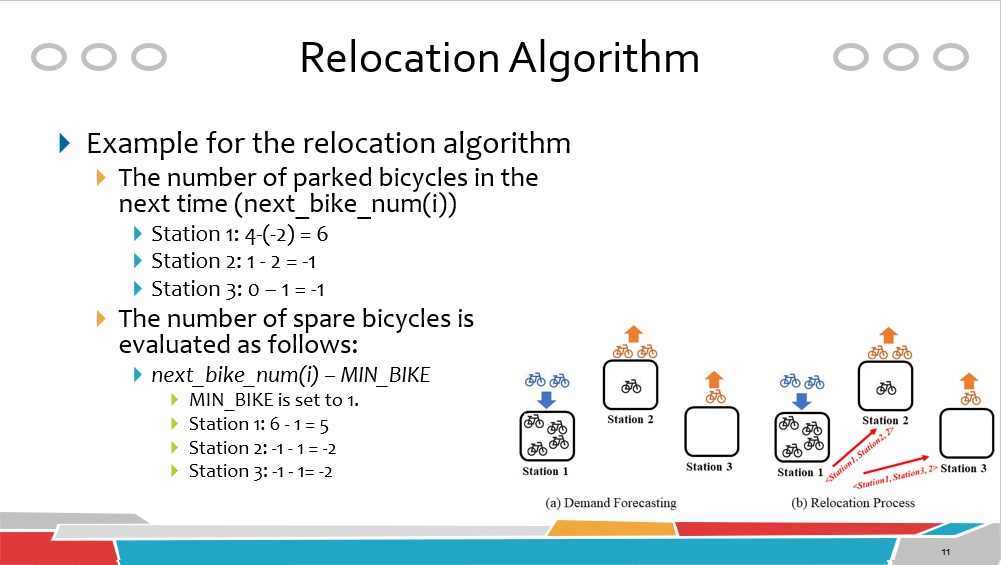 |
To evaluate the spare bicycles, we compute the number of parked bicycles in the next time. In the example of this slide, next_bike_num() of Station 1 is 4-(-2) = 6. That of Station 2 is 1 - 2 = -1. That of Station 3 is 0 – 1 = -1. Based on next_bike_num(), the number of spare bicycles is evaluated by next_bike_num(i) – MIN_BIKE. In this example, MIN_BIKE is set to 1. Let’s evaluate spare bicycles for each station.
In Station 1, 6 - 1 = 5
In Station 2, -1 - 1 = -2
In Station 3, -1 - 1= -2 |
| ICACT20210205 Slide.12
[Big Slide]
|
Chrome Click!! |
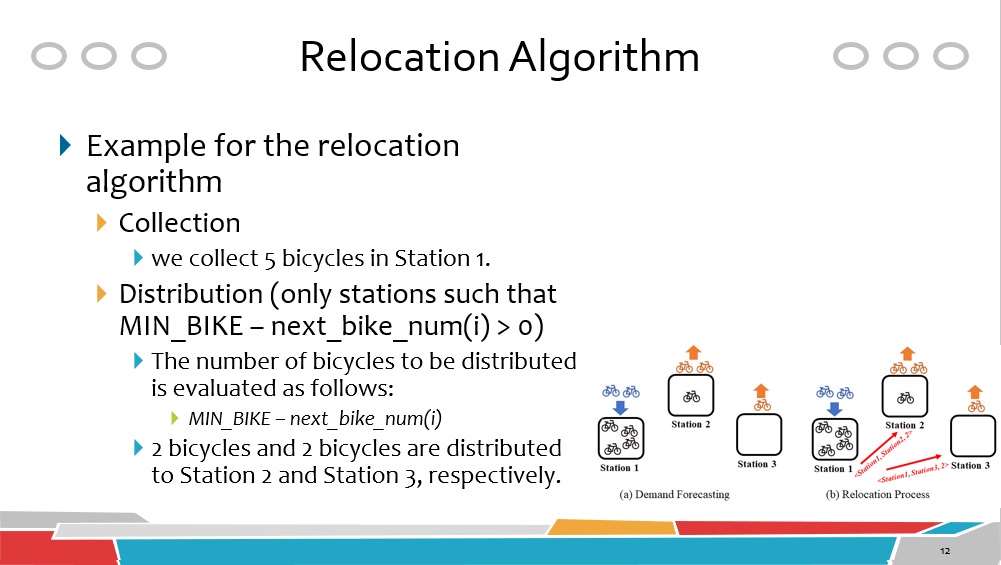 |
Only Station 1 has 5 bicycles as the number of spare bicycles. Therefore, we collect 5 bicycles in Station 1. Next, we distribute spare bicycles to stations that need more bicycles. The number of bicycles to be distributed is evaluated by MIN_BIKE – next_bike_num(i). We distribute collected bicycles to only stations such that MIN_BIKE – next_bike_num(i) > 0. The distribution process is similar to the collection process. In the example, 2 bicycles and 2 bicycles are distributed to Station 2 and Station 3, respectively. |
| ICACT20210205 Slide.13
[Big Slide]
|
Chrome Click!! |
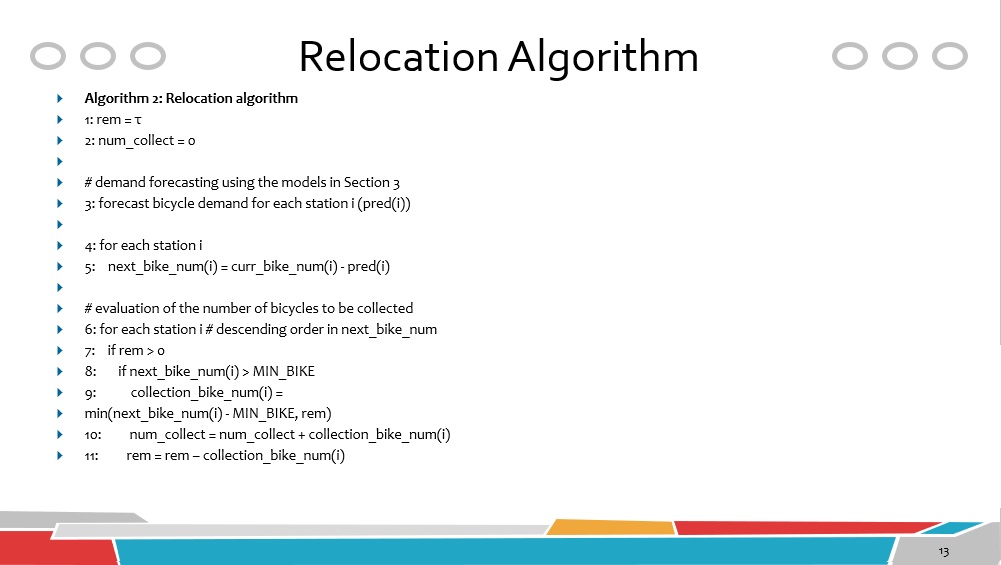 |
This slide shows the detail relocation algorithm. We skip the detailed explanation because we already explained the algorithm with the example in the previous slide. |
| ICACT20210205 Slide.14
[Big Slide]
|
Chrome Click!! |
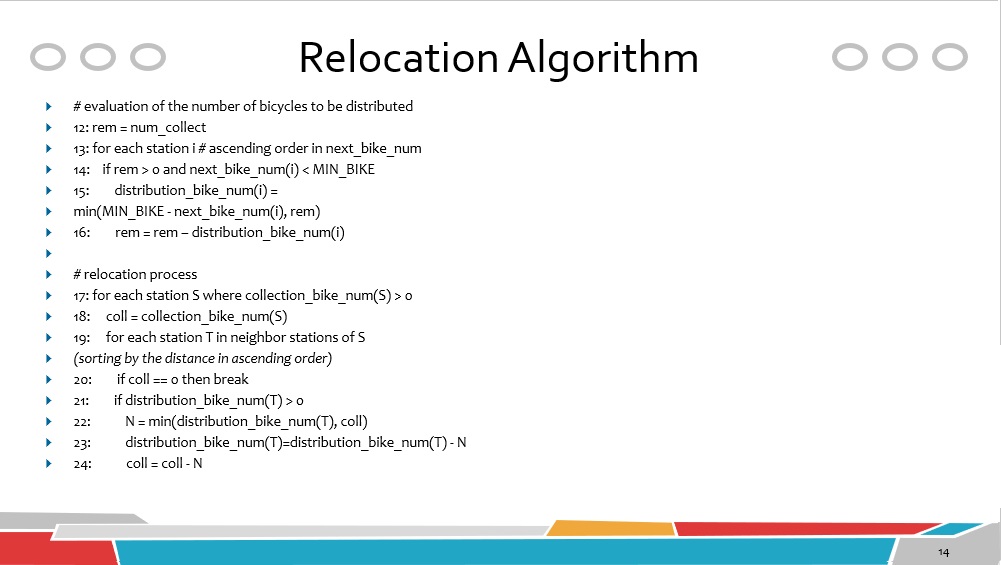 |
We skip the detailed explanation.
|
| ICACT20210205 Slide.15
[Big Slide]
|
Chrome Click!! |
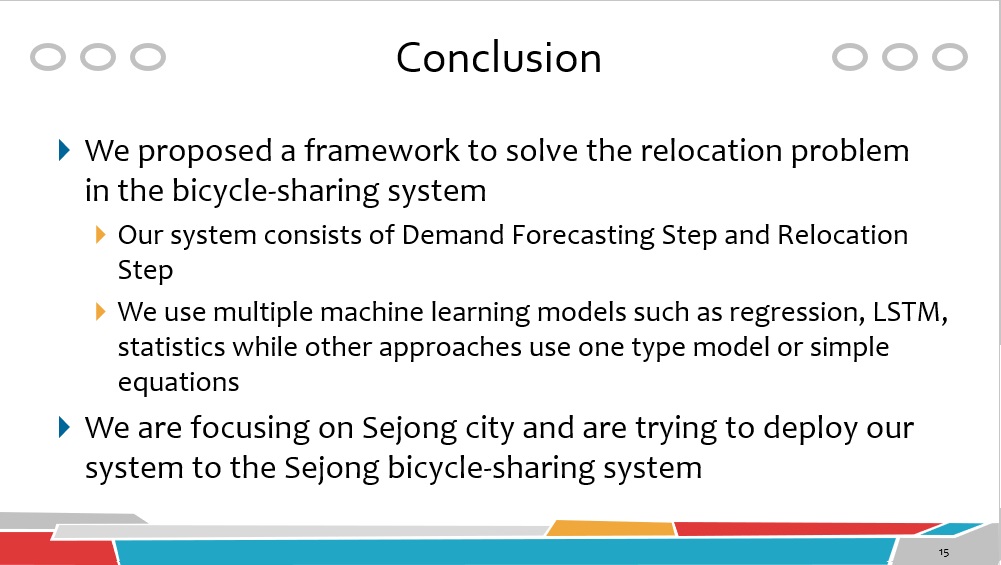 |
We proposed a framework to solve the relocation problem in the bicycle-sharing system. Our system consists of Demand Forecasting Step and Relocation Step. We use multiple machine learning models such as regression, LSTM, statistics while other approaches use one type model or simple equations. We are focusing on Sejong city and are trying to deploy our system to the Sejong bicycle-sharing system. |















