 ICACT20210239 Slide.01
[Big Slide] |
Chrome  Click!! |
 |
Good morning/afternoon, my name is Shun Kawasaki from Okayama University, Japan. Today, I would like to give a research presentation with the title as Busy/idle duration prediction for video and audio WLAN traffics using autoregressive predictor with data categorization. |
| ICACT20210239 Slide.02
[Big Slide]
|
Chrome Click!! |
 |
First of all, let me talk about the background and contributions of this research.
As you know, from last year, 5G system is building over World.
This new and powerful wireless technique will dramatically benefit many areas.
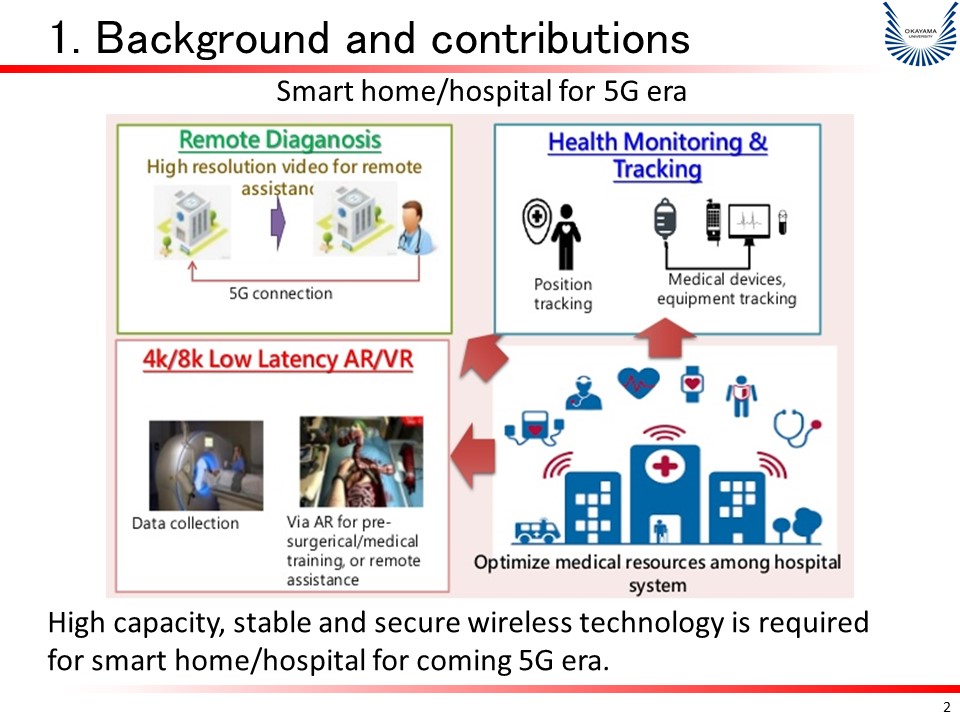
For example, for the smart house or smart hospital, with 5G technique, we can obtain promising services such as remote diagnosis, health monitoring and tracking, AR/VR data transfer and resource optimization.
These new services of smart home/hospital will require high capacity, stable and secure wireless technology for the coming 5G era.
|
| ICACT20210239 Slide.03
[Big Slide]
|
Chrome Click!! |
 |
The wireless technique needs to learn the surrounding and adjust its technique schemes for adaptation to the different communication environments and different user cases.
Here let me give a simple example for the different environments when considering the wireless traffic service in hospital.
For the hospital case, usually we need to consider some different properties of wireless environments.
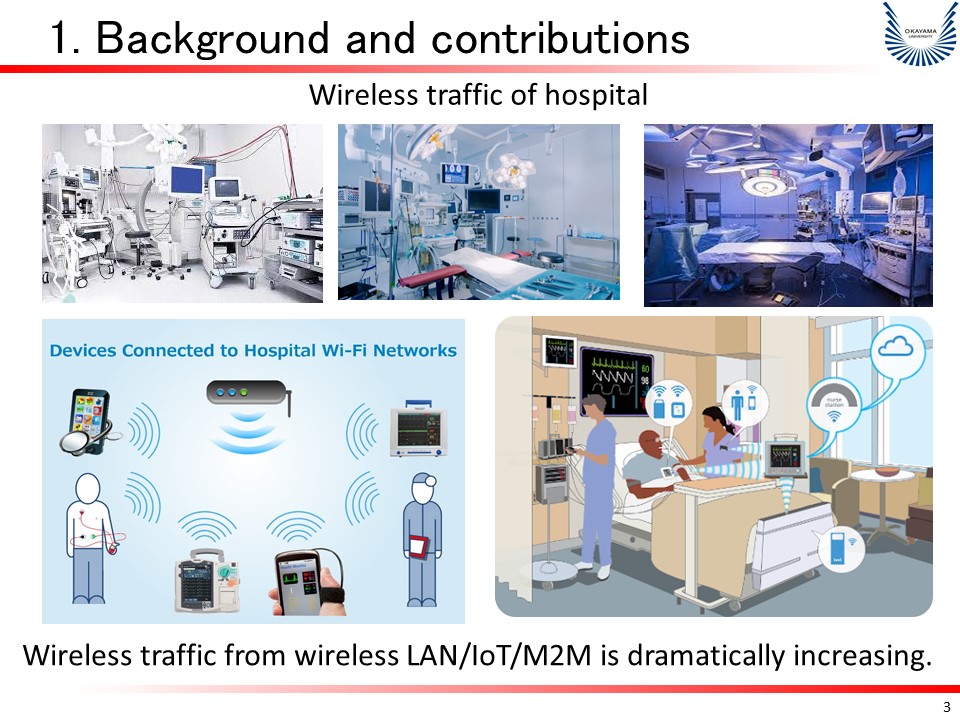
First, in this user case, the wireless traffic from wireless LAN/IoT/M2M is dramatically increasing. In addition, due to the special requirements of hospital, the video and audio services are probably largely required for wireless communications among medical staff, patients and medical devices.
On the other hand, the wireless environments could be different as two different cases: noninterference scenario and interference scenario. The noninterference scenario means little interference from other systems, and interference scenario means there are several systems existed and interfered with each other.
|
| ICACT20210239 Slide.04
[Big Slide]
|
Chrome Click!! |
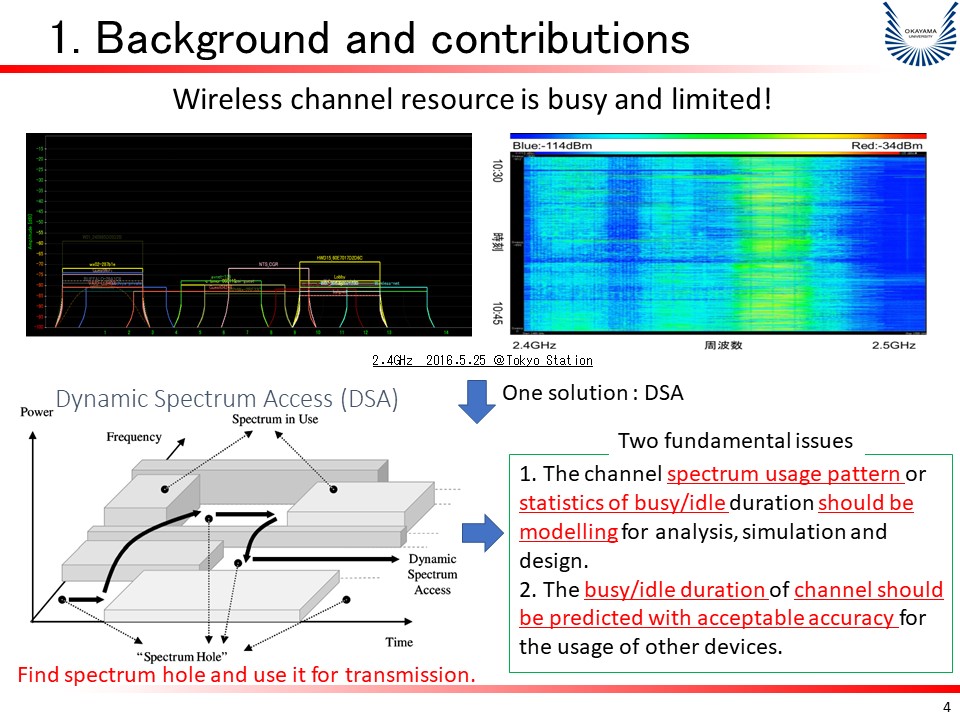 |
However, for WLAN system in indoor usage or outdoor usage, Wireless channel resource is busy and limited.
This figure shows the spectrum of frequency band usage over WLAN system at 2.4GHz. The data was measured at Tokyo Station which reflected to the busy and limited resource of frequency band.
To alleviate such limitations, one of efficient techniques is using dynamic spectrum access (DSA). The main idea of DSA is to find spectrum hole and use it for transmission as shown in this figure.
However, to realize promising DSA technique, two issues need to be solved.
First, the channel spectrum usage pattern or statistics of busy/idle duration should be modelling for analysis, simulation and design.
In addition, the busy/idle duration of channel should be predicted with acceptable accuracy for the usage of other devices.
|
| ICACT20210239 Slide.05
[Big Slide]
|
Chrome Click!! |
 |
Therefore, our contributions of this research are two items.
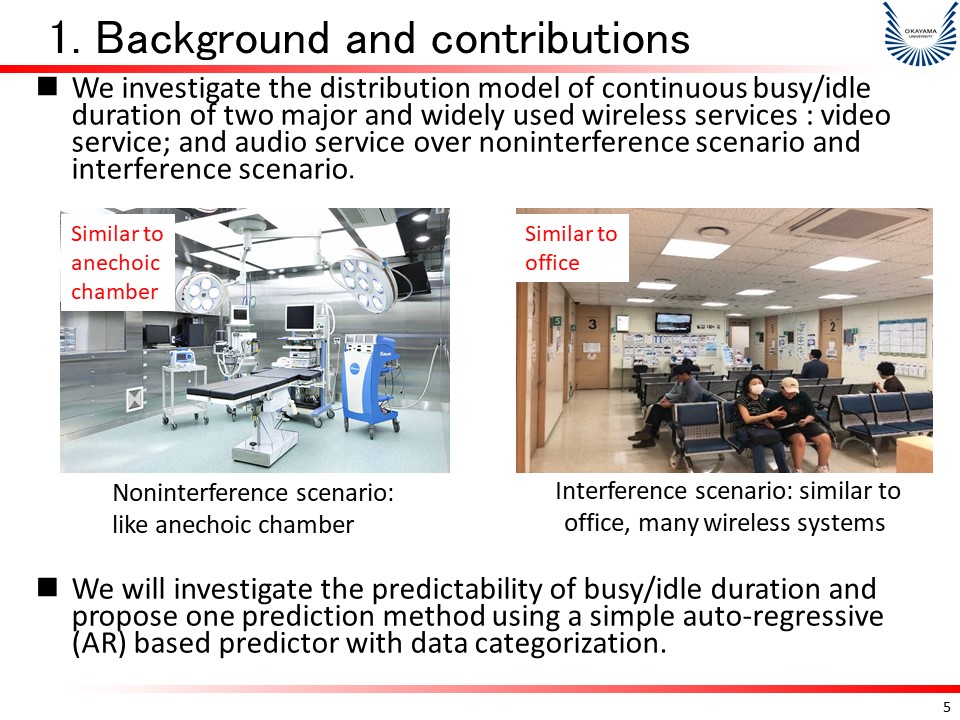
We first investigate the distribution model of continuous busy/idle duration of two major and widely used wireless services: video service; and audio service over noninterference scenario and interference scenario.
Here the noninterference scenario can be treated as an anechoic chamber where no any other communication systems access the WLAN channels.
The interference scenario considers the normal office environments with multiple communication systems existed.
Then, we research the predictability of busy/idle duration and propose the prediction method using a simple auto-regressive (AR) based predictor with data categorization.
|
| ICACT20210239 Slide.06
[Big Slide]
|
Chrome Click!! |
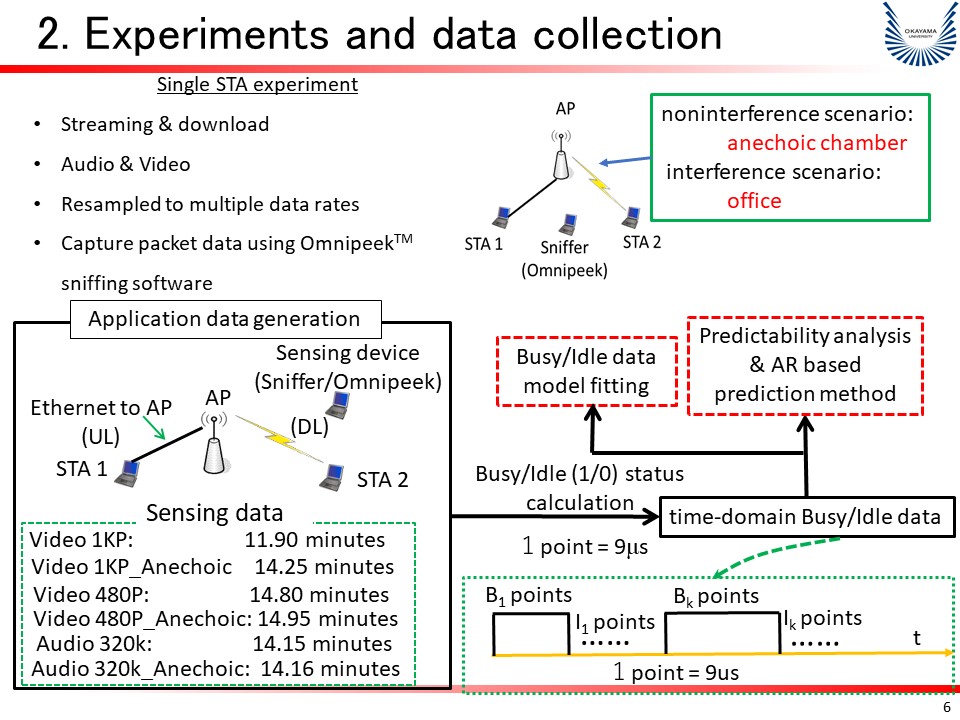 |
6. We first operated some WLAN wireless experiments to collect busy/idle duration data as shown in this figure.
The video and audio data which listed as here is transmitted using STA1 as access point (AP) to the receiver STA2.
The transmitted packet data is captured using Omnipeek sniffing software.
After that, the busy and idle durations are calculated with a granularity of 9 μs per point. Therefore, the spectrum status can be represented as the data of busy and idle duration.
Finally, we can utilize the time-series busy/idle data for model fitting, predictability analysis & AR based prediction method.
|
| ICACT20210239 Slide.07
[Big Slide]
|
Chrome Click!! |
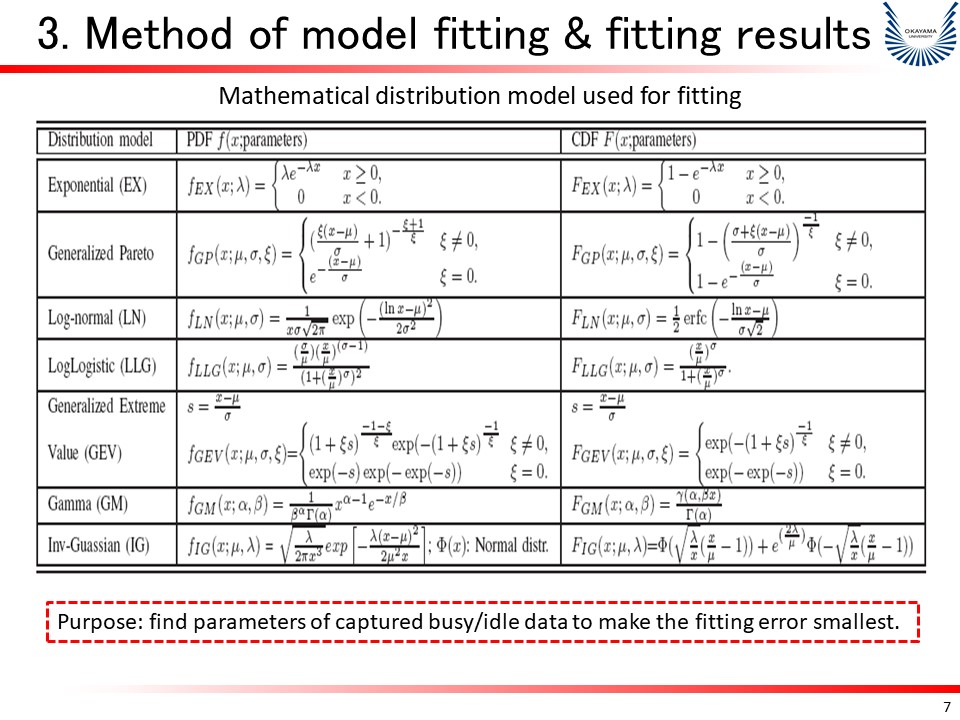 |
First, let me show the results of model fitting for busy and idle duration data.
To provide the simple mathematical model, we select the following distribution functions such as exponential (EX), generalized Pareto (GP), Log-normal (LN), log-logistic (LLG), generalized extreme value (GEV), gamma (GM) and Inverse Gaussian (Inv-Gaussian) distributions.
The purpose of model fitting is to find parameters of captured busy/idle data to make the fitting error as small as possible.
|
| ICACT20210239 Slide.08
[Big Slide]
|
Chrome Click!! |
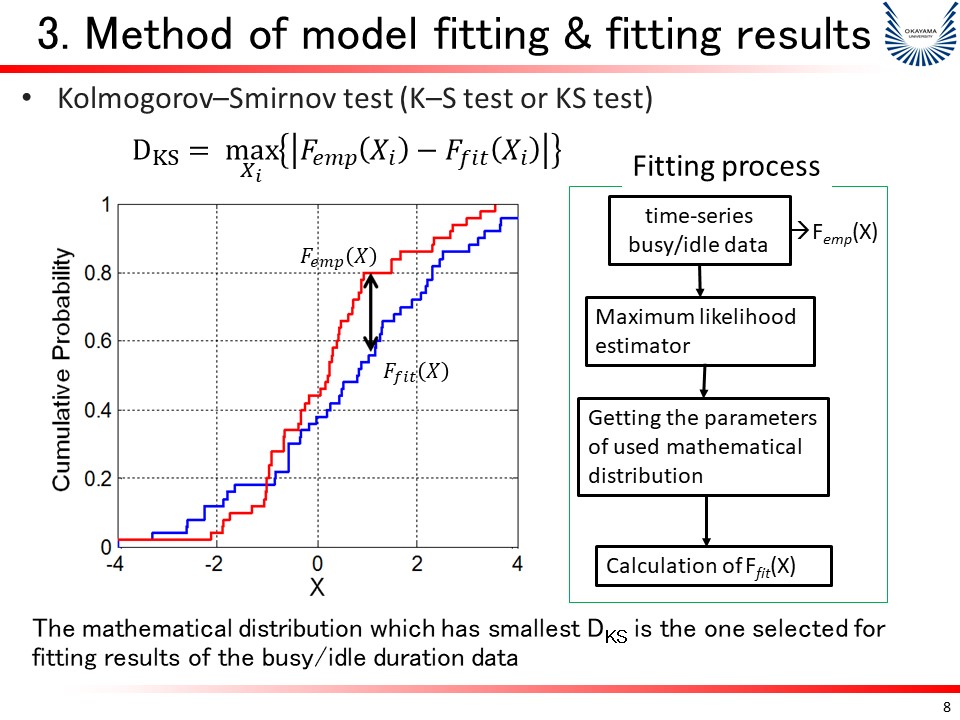 |
To show the level of fitting results, we calculate the K–S test value DKS between the empirical data and the selected mathematical distribution function with the equation showed here.
The fitting process is based on the MLE rule to calculate the parameters of each mathematical distribution function which given with this flowchart.
Finally, the mathematical distribution which has smallest DKS is the one selected for fitting results of the busy/idle duration data
|
| ICACT20210239 Slide.09
[Big Slide]
|
Chrome Click!! |
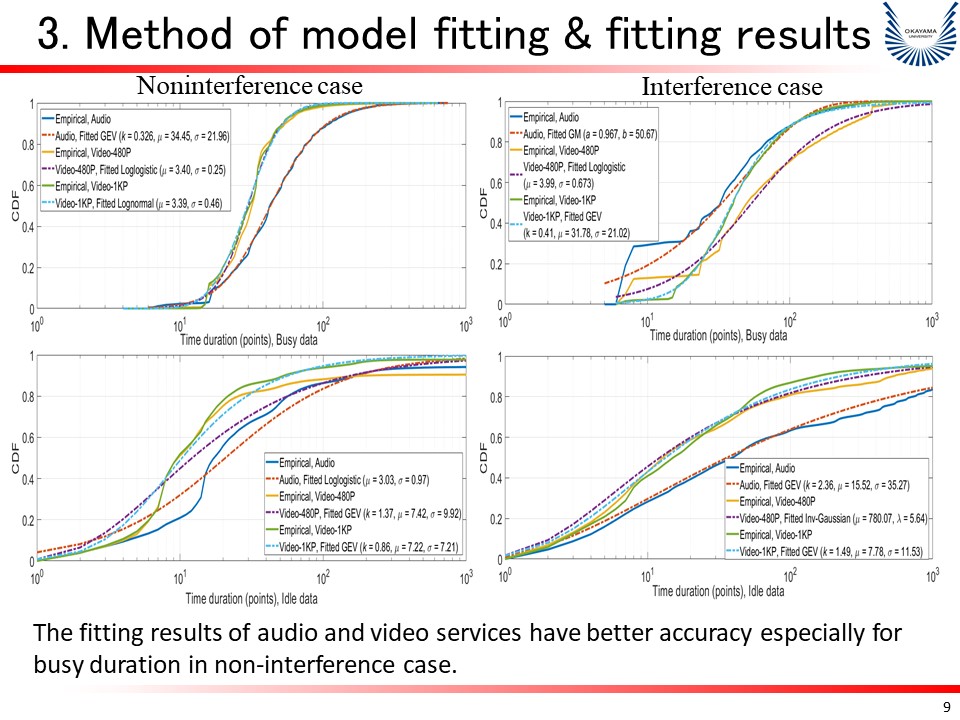 |
The fitting results for busy duration and idle duration for Video and Audio over noninterference and interference scenarios are shown in these four figures.
From these figures, we can find that busy data of video have shorter duration than that of audio service.
The reason is that video usually has almost fixed length of packets than that of audio service, especially for noninterference scenario.
On the other hand, for model fitting, the results of audio and video services have better accuracy especially for busy duration in non-interference case.
|
| ICACT20210239 Slide.10
[Big Slide]
|
Chrome Click!! |
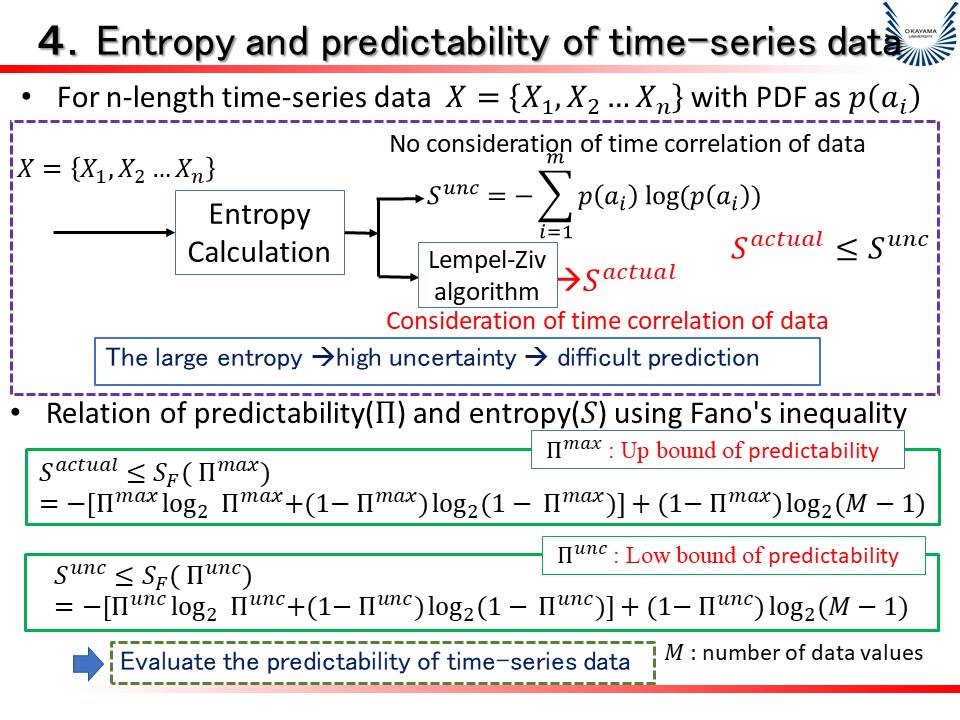 |
For time-series data, we can calculate its n-length entropy to evaluate the predictability of two kinds of bounds.
The first kind of entropy S^unc is calculated with only the PDF of time-series data, that is, the entropy is not consideration of time correlation among the data.
On the other hand, if the all correlations among time-series data are explored, it will make high certainty for data. However, such target is too complexity to be realized. Here we use Lempel-Ziv algorithm to dig the relationship among the time-series data in some level and calculate its entropy as S^actual, and S^actual is smaller than S^unc.
With two entropies, using Fano's inequality, the up bound 〖 Π〗^max and low bound 〖 Π〗^unc of predictable of time-series data can be calculated for evaluation of probability that time-series can be perfectly predicted.
|
| ICACT20210239 Slide.11
[Big Slide]
|
Chrome Click!! |
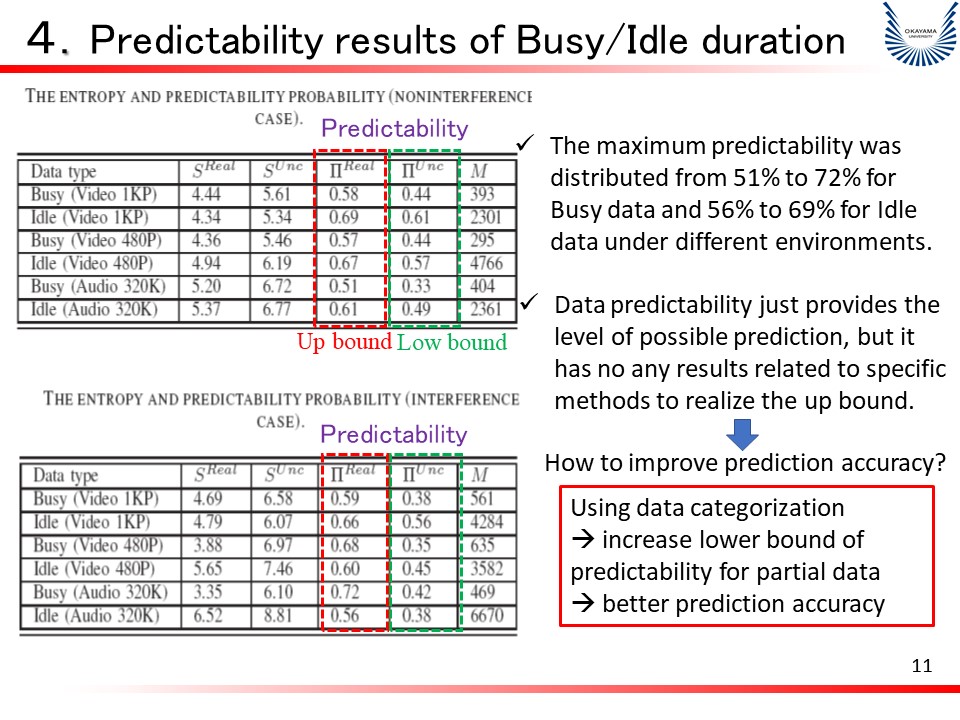 |
Here we use two tables to show the predictability of busy and idle duration data of video and audio services over noninterference and interference scenarios.
We can find that the maximum predictability was distributed from 51% to 72% for busy data and 56% to 69% for idle data under different environments.
It should be noted that data predictability just provides the level of possible prediction, but it has no any results related to specific methods to realize the up bound.
Therefore, how to improve prediction accuracy?
Here we propose one simple data categorization to increase the lower bound of predictability of partial data, and then can get better prediction accuracy
|
| ICACT20210239 Slide.12
[Big Slide]
|
Chrome Click!! |
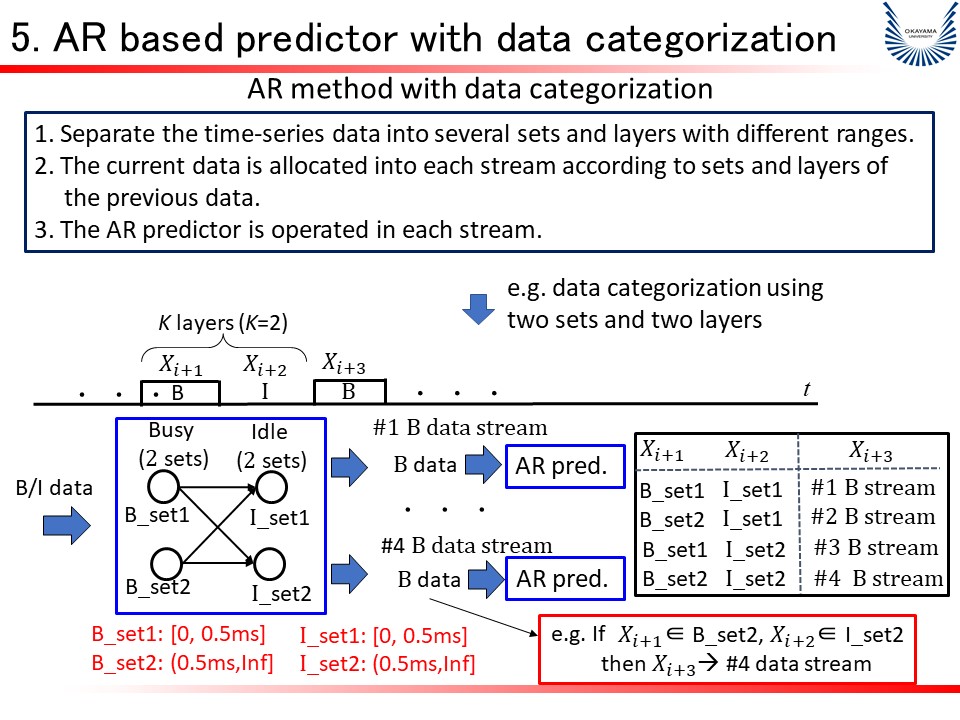 |
The data categorization can be processed as these steps.
First, we separate the time-series data into several sets and layers with different ranges.
Then, the current data is allocated into each stream according to sets and layers of the previous data.
Finally, the prediction such as AR predictor is operated in each stream.
Here we explain the data categorization using two sets and two layers.
Each busy and idle duration is separated with two sets with ranges as shown in this figure. The current busy or idle will be put into different stream according to the previous X_{i+1} and X_{i+2}. For example, if X_(i+1) belongs to Set_2 and X_(i+2) also belongs to Set_2, then, X_(i+3) is put into the 4-th stream. After that, the future busy or idle duration is predicted in 4-th stream.
|
| ICACT20210239 Slide.13
[Big Slide]
|
Chrome Click!! |
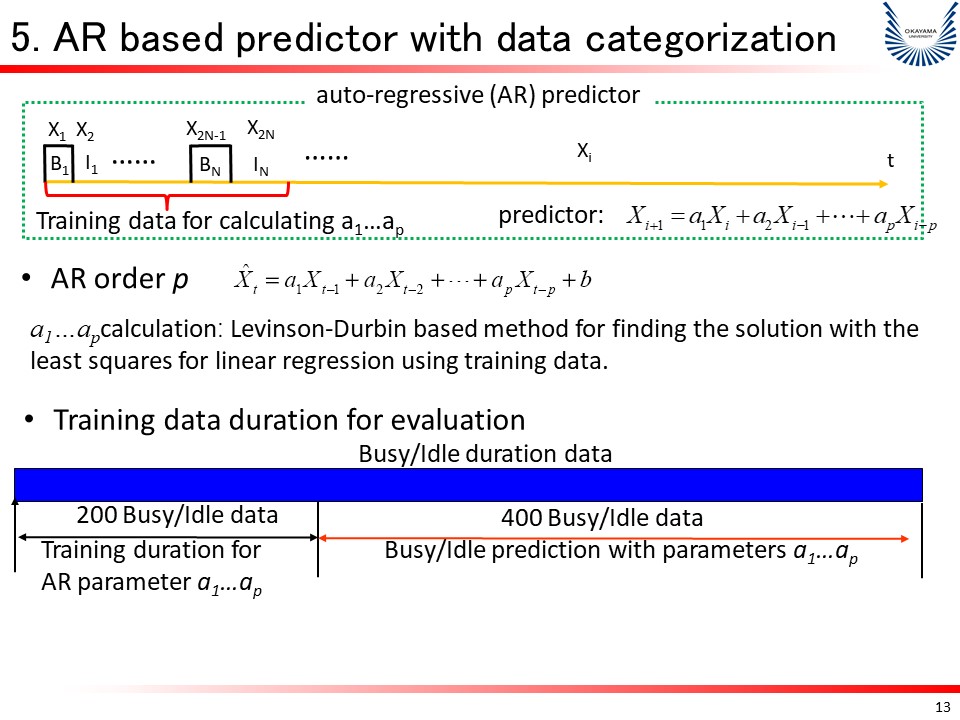 |
Before providing the prediction results with data categorization, we simple explain the AR based prediction.
AR predictor with order p can be represented with this equation. Here the weights a1…ap are calculated using previous training data to finding the solution with the least squares for linear regression using training data.
In this paper, we set order p as 2 and utilize 200 busy or idle data for training to get a1…ap. Such weights are fixed for next 400 data prediction.
|
| ICACT20210239 Slide.14
[Big Slide]
|
Chrome Click!! |
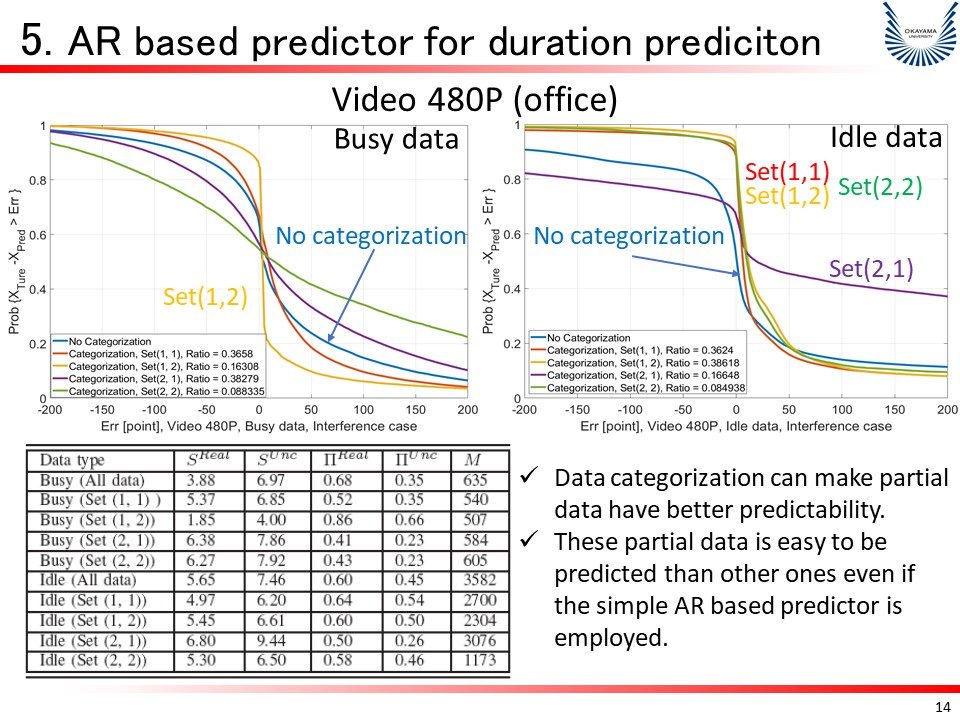 |
The predictability of busy/idle duration from video service with 480P solution over interference scenario is given in this table. We can find that data categorization can increase 〖 Π〗^unc of the set (1, 2) for busy data, and of the sets (1,1), (1, 2) , (2, 2) for idle data.
The AR based prediction performances also confirm that 16.3% busy data can be predicted with higher accuracy than that of all data without data categorization. For idle data, 83.3% idle data can be predicted with higher accuracy.
|
| ICACT20210239 Slide.15
[Big Slide]
|
Chrome Click!! |
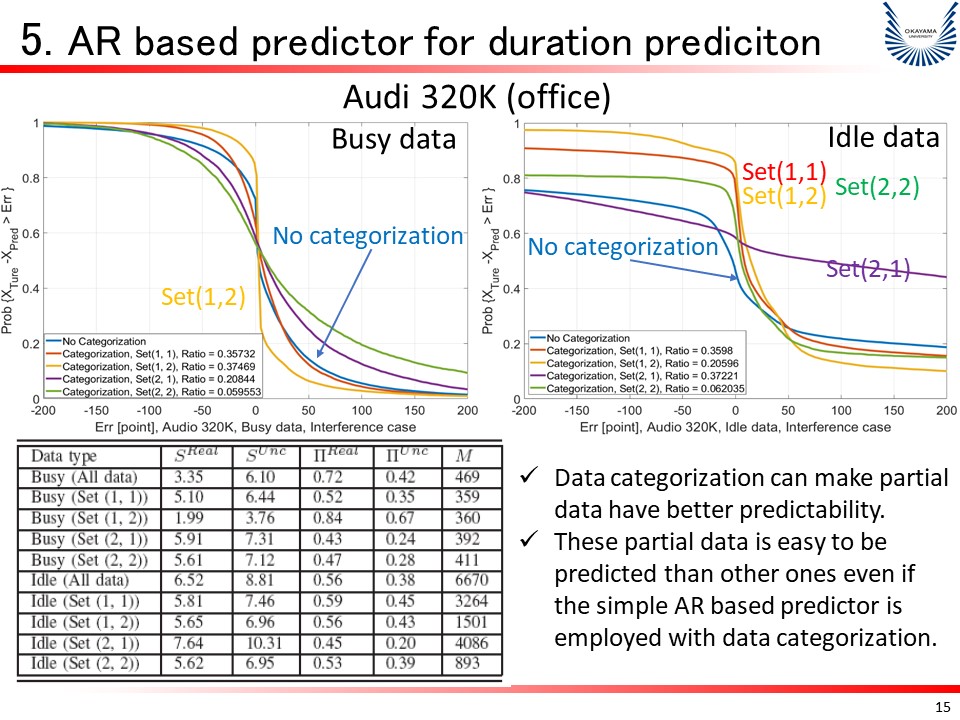 |
The similar evaluation for audio service over interference scenario has been operated. The predictability and prediction performances also appear the similar results.
Therefore, all figures show that partial data is easy to be predicted than other ones even if the simple AR based predictor is employed with our proposed data categorization.
|
| ICACT20210239 Slide.16
[Big Slide]
|
Chrome Click!! |
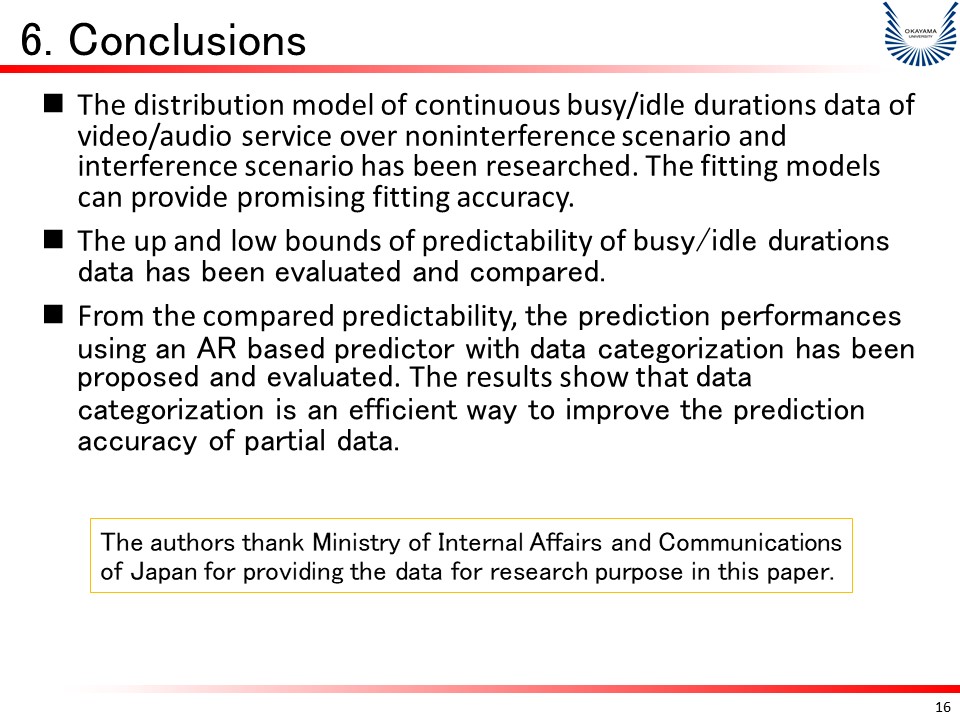 |
The distribution model of continuous busy/idle duration data of video/audio service over noninterference scenario and interference scenario has been researched. The fitting models can provide promising fitting accuracy.
The up and low bounds of predictability of busy/idle duration data has been evaluated and compared.
From the compared predictability, the prediction performances using an AR based predictor with data categorization has been proposed and evaluated. The results show that data categorization is an efficient way to improve the prediction accuracy of partial data.
|















