 ICACT20230036 Slide.00
[Big Slide]
[YouTube] |
Chrome  Click!! |
 |
my youtube URL:https://youtu.be/_hgf5iB_z4w |
| ICACT20230036 Slide.01
[Big Slide]
[YouTube] |
Chrome Click!! |
 |
Hi, everyone. I’m Ying_Jhen,Su from National Taitung University of Science and Technology. Today I’m happy to present our new work, Graphed-based K-Means and Shortest Distance Tree for the Construction of Elderly Safe Corridor Accident and Prevention Platform. |
| ICACT20230036 Slide.02
[Big Slide]
[YouTube] |
Chrome Click!! |
 |
My presentation consists of the following parts.
|
| ICACT20230036 Slide.03
[Big Slide]
[YouTube] |
Chrome Click!! |
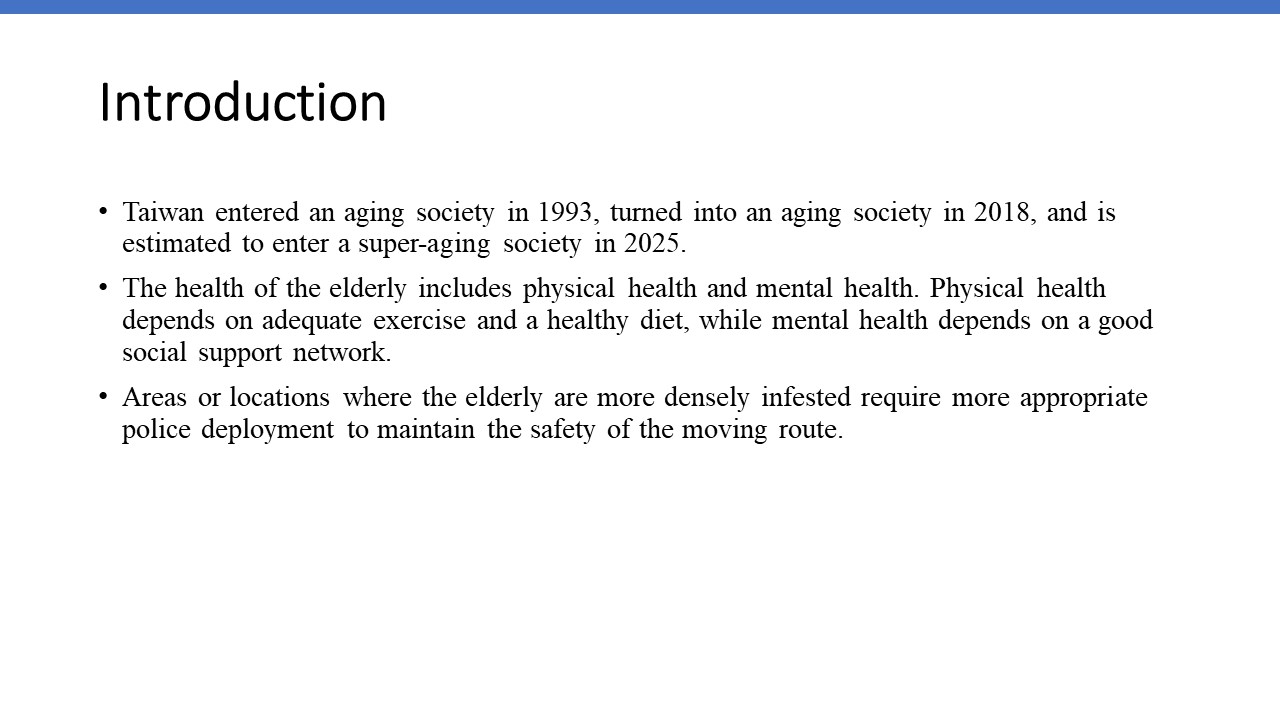 |
First I will give an introduction to our project. Taiwan entered an aging society in 1993 and turned into an aging society in 2018. It is estimated that the country will join a super-aged society by 2025. It is crucial to consider the safety and accident prevention needs of the elderly during the movement so that the elderly could take adequate exercise and will not suffer from social isolation. Properly arranging police officers in the moving routes is very important to ensure the safety of the elderly.
In order to cope with the safety of the elderly's movement and activities, we use the following steps to arrange the police force
Set the weight of the elderly.
(2) Use weighted K-means to make the elderly who need more care closer to the center of the cluster, so that the police officers can be arranged closer to the elderly.
(3) In order to make the elderly more active outdoors, the movement mode is set to walking, and the route from the elderly to the path is the shortest path between the activity site and the residential gathering point, and the shortest path tree is constructed.
(4) Due to the insufficient number of police officers, in order to serve as many elderly people as possible with as few police forces as possible, the intersections most frequently passed by the elderly are used as reference points for police dispatching.
(5) Use the breadth-first search method to calculate the number of people passing through each intersection, and the number of people at the multi-path convergence point is the basis for recommending police force arrangements.
|
| ICACT20230036 Slide.04
[Big Slide]
[YouTube] |
Chrome Click!! |
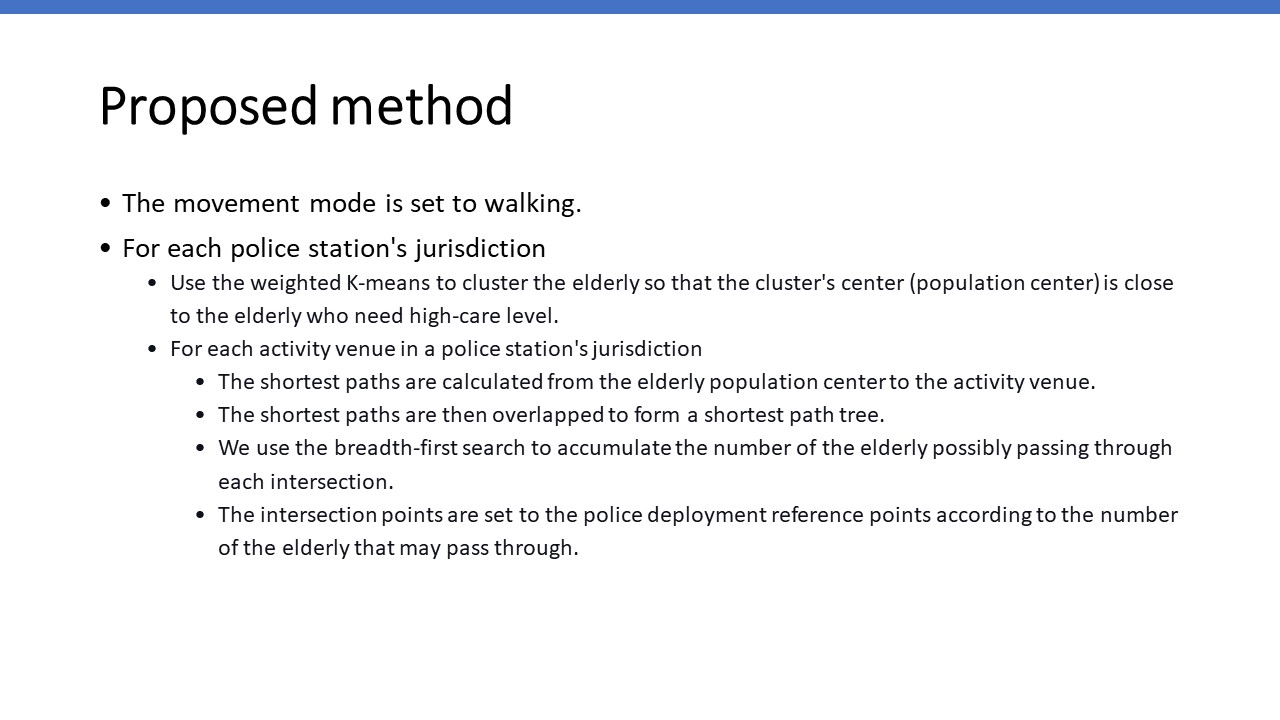 |
Since the elderly are not flexible enough, some of them could not drive or ride bikes. Especially the elderly who need high-care level. So we set the movement mode of the elderly to walk. This mode is set on the map application to calculate the shortest path.
We also set weights for the elderly according to their care levels.
For each police station's jurisdiction, we use the weighted K-means to cluster the elderly so that the cluster's center (population center) is close to the elderly who need high-care level.
For each activity venue in a police station's jurisdiction, we perform the following 4 steps.
In the first step, the shortest paths are calculated from the elderly population center to the activity venue.
In the second step, the shortest paths are then overlapped to form a shortest path tree.
In the third step, we use the breadth-first search to accumulate the number of the elderly possibly passing through each intersection.
Finally, the intersection points are set to the police deployment reference points according to the number of the elderly that may pass through.
|
| ICACT20230036 Slide.05
[Big Slide]
[YouTube] |
Chrome Click!! |
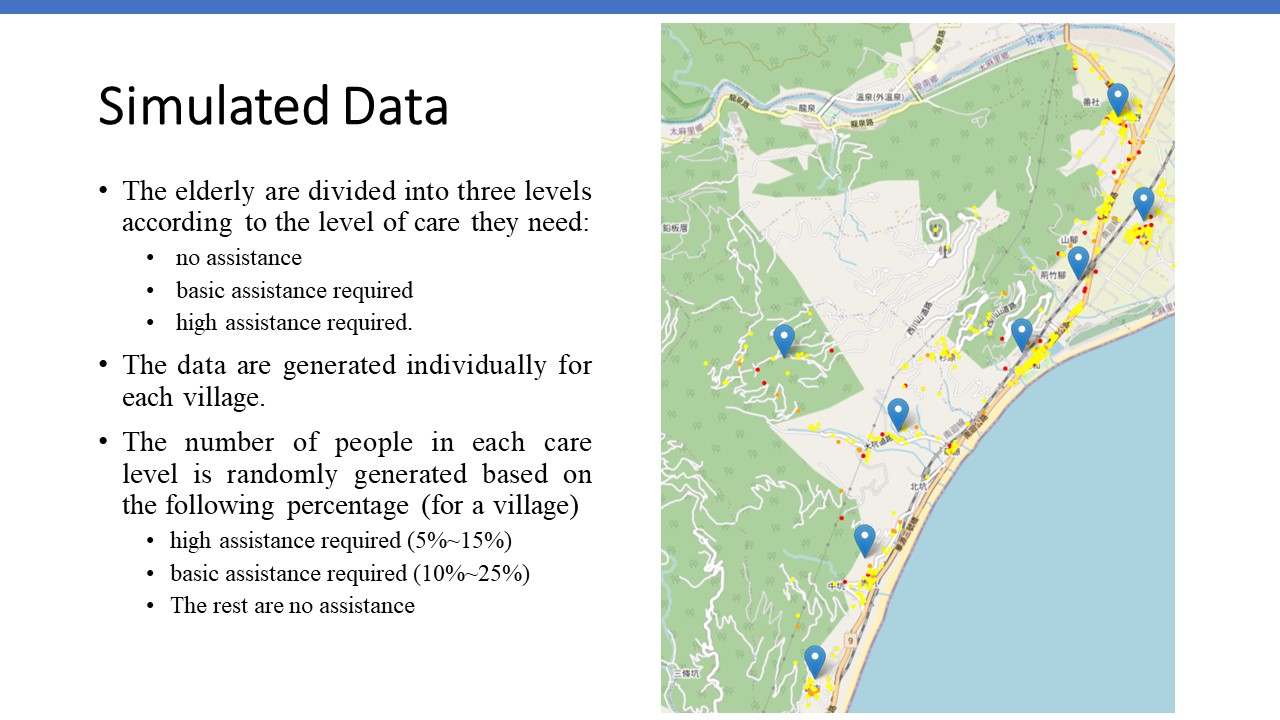 |
In order to reasonably simulate the population of the elderly, we generate elderly data according to the population characteristics surveyed by the Taitung county government in July 2022. The surveyed data is based on villages in the county. To arrange policies close to the elderly who need more help, we divide the elderly into three care levels: no assistance, basic assistance required, and high assistance required. We set 5% to 15% of the elderly population to be the ones who require extreme care, 10% to 25% require moderate care, and the rest is the elderly population that requires little care.
The map on the right side shows the elderly population distribution. The red points indicate the location of the elderly who need extreme care. The orange points are the location of the elderly who require moderate care. The rest elderly are in yellow colors.
|
| ICACT20230036 Slide.06
[Big Slide]
[YouTube] |
Chrome Click!! |
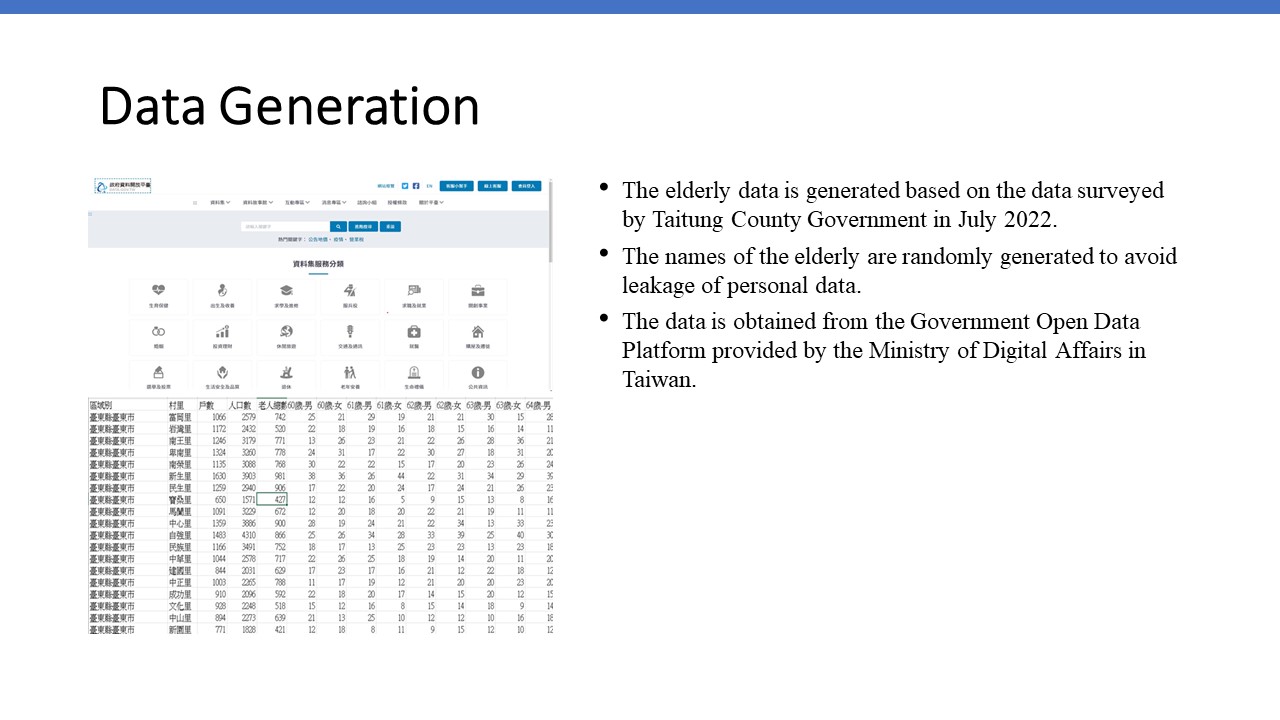 |
The name of the elderly is randomly generated.
In the generated data, the number and age of elderly men and women in each village are the same as the data surveyed by Taitung County Government in July 2022.
The surveyed data is obtained from the Government Open Data Platform provided by the Ministry of Digital Affairs in Taiwan.
|
| ICACT20230036 Slide.07
[Big Slide]
[YouTube] |
Chrome Click!! |
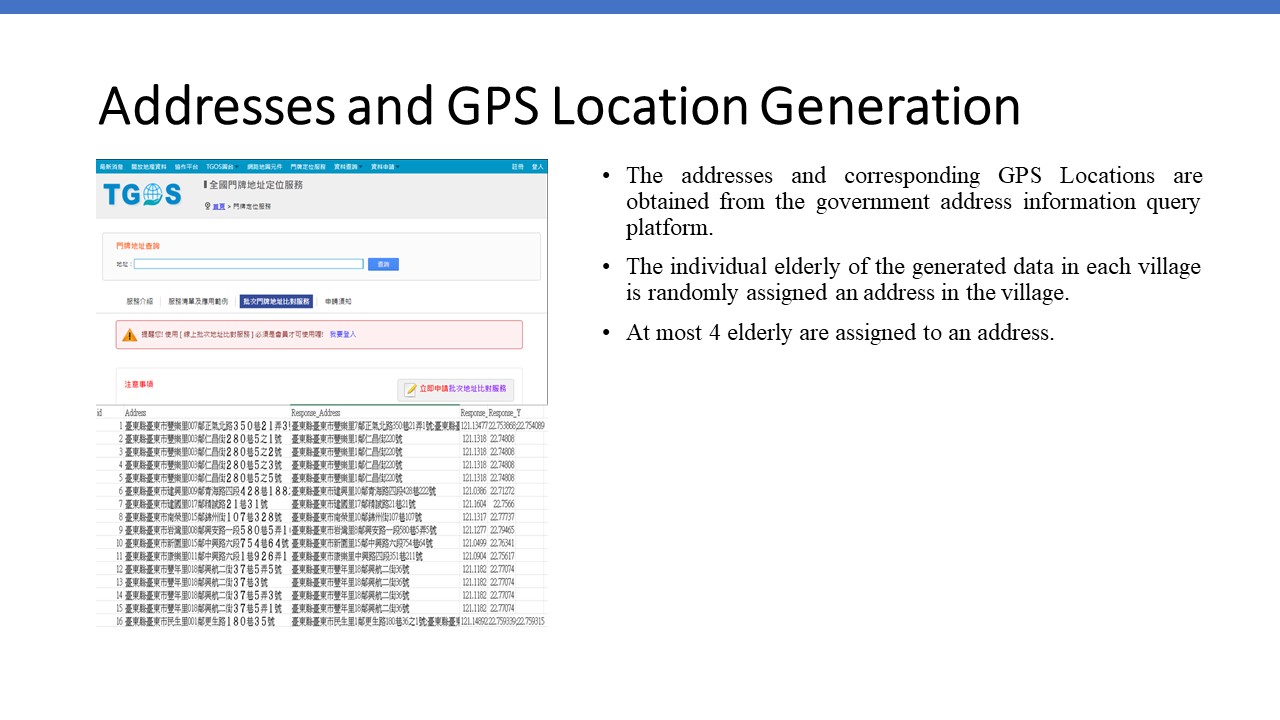 |
In order to assign addresses to the generated elderly, we first obtain all addresses and the corresponding GPS locations, including longitude and latitude values in each village from the government address information query platform. Then we randomly assigned an address in a village to an elderly individual in this village. We assign at most 4 elderly to an address.
|
| ICACT20230036 Slide.08
[Big Slide]
[YouTube] |
Chrome Click!! |
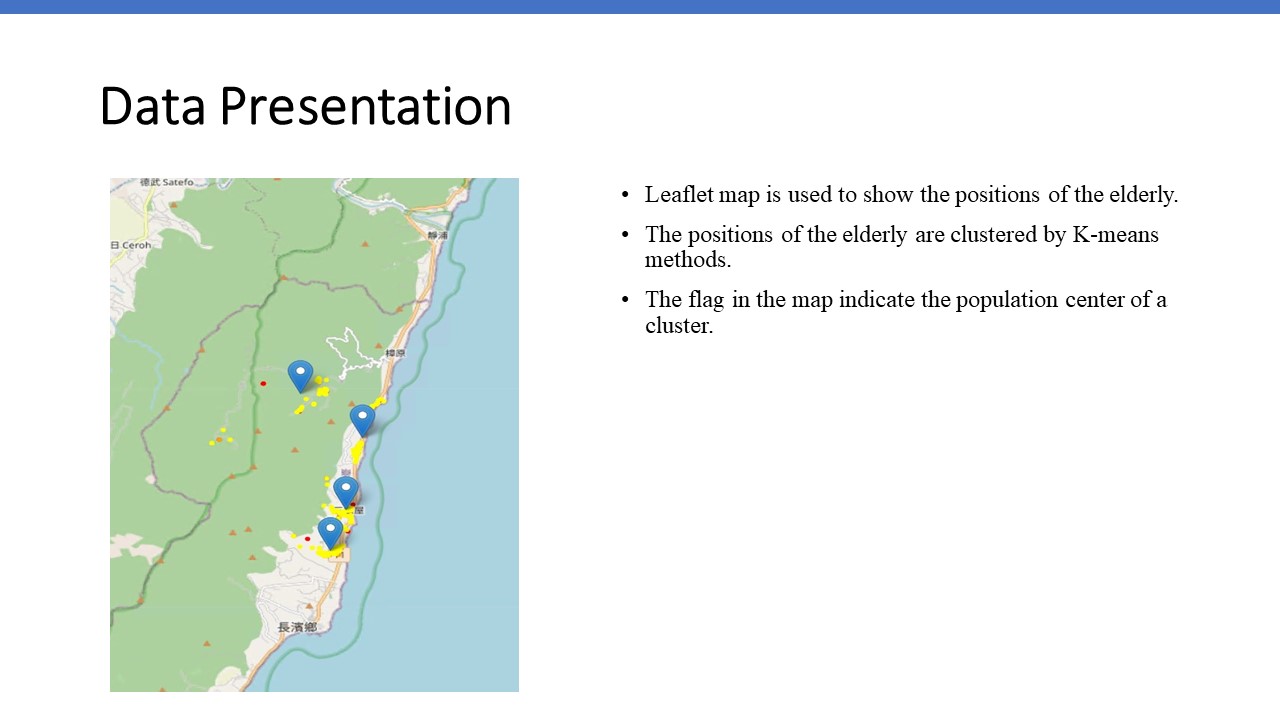 |
We use a leaflet map to mark the location of the elderly. After the locations of these elderly are clustered by k-means, the center point of the cluster is marked on the map in the form of a flag. |
| ICACT20230036 Slide.09
[Big Slide]
[YouTube] |
Chrome Click!! |
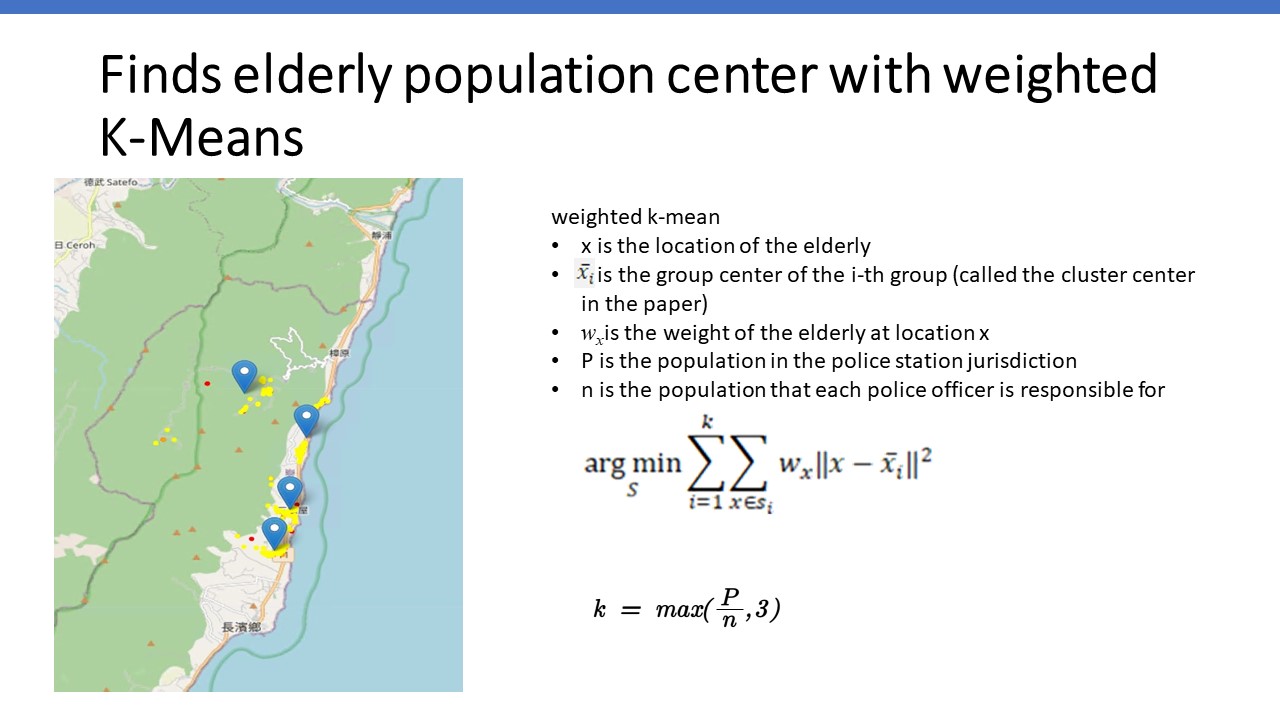 |
Because of the limited number of locations the police can
support, we will use the weighted K-means cluster analysis method to divide the elderly into k clusters, where k >= Ln. In this paper, we set Ln to be 3. This means the policies will support at least 3 locations in a police station jurisdiction. Kmeans is a nonsupervised data mining method to classify n samples into k clusters.
The locations of the elders are {x1, x2, ..., xn}. These locations will be classified into cluster S, defined as {s1, s2, ..., sk}. The cluster centers of si is xbari.
wx is the weight of the elderly at location x.
P is the population in the police station jurisdiction.
N is the population that each police officer is responsible for
To prevent clusters from being too scattered, the number of
clusters k in this study is set to the formula below where P is the population of the elderly in the police station jurisdiction, and n is the number of elderly responsible for by each police officer.
|
| ICACT20230036 Slide.10
[Big Slide]
[YouTube] |
Chrome Click!! |
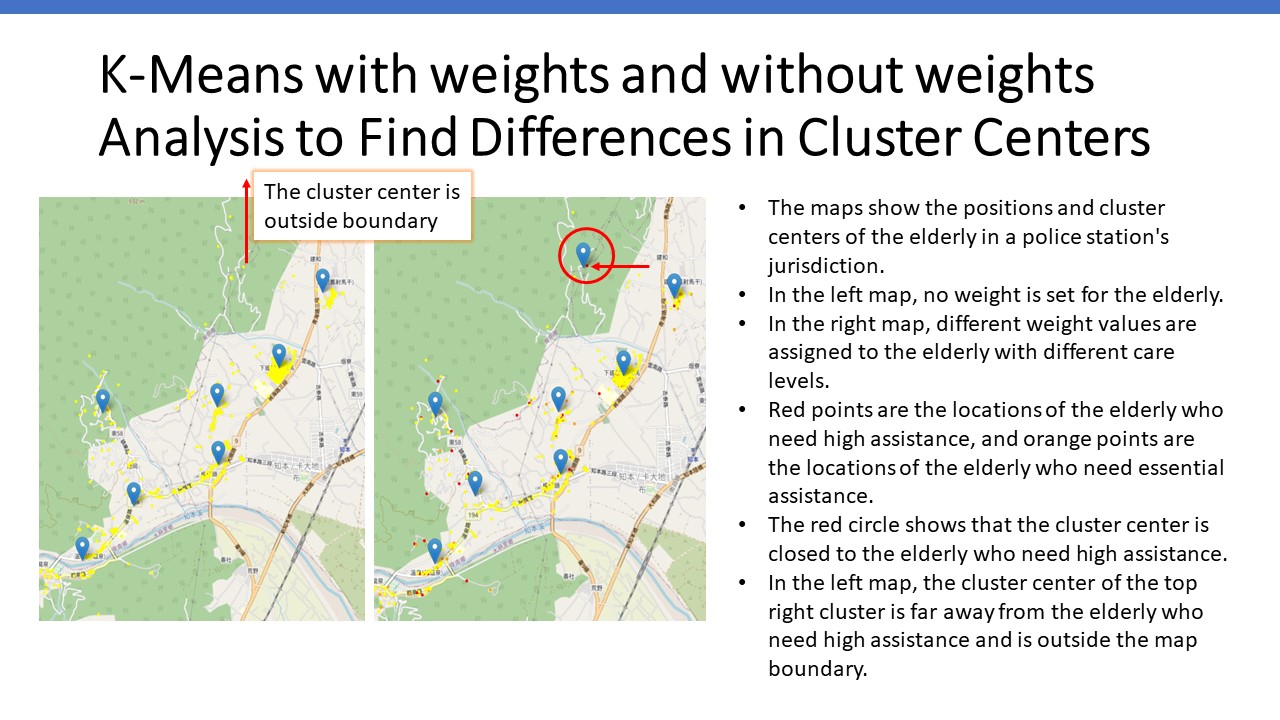 |
These 2 maps show the positions and cluster centers of the elderly in a police station's jurisdiction.
In the left map, no weight is set for the elderly.
In the right map, different weights are assigned to the elderly with different care levels.
Red points are the locations of the elderly who need high assistance, and orange points are the locations of the elderly who need essential assistance.
The red circle in the right map shows that the cluster center is closed to the elderly who need high assistance, as pointed out by the arrow.
In the left map, the cluster center of the top right cluster is outside the map boundary. It is far from the elderly who need high assistance.
|
| ICACT20230036 Slide.11
[Big Slide]
[YouTube] |
Chrome Click!! |
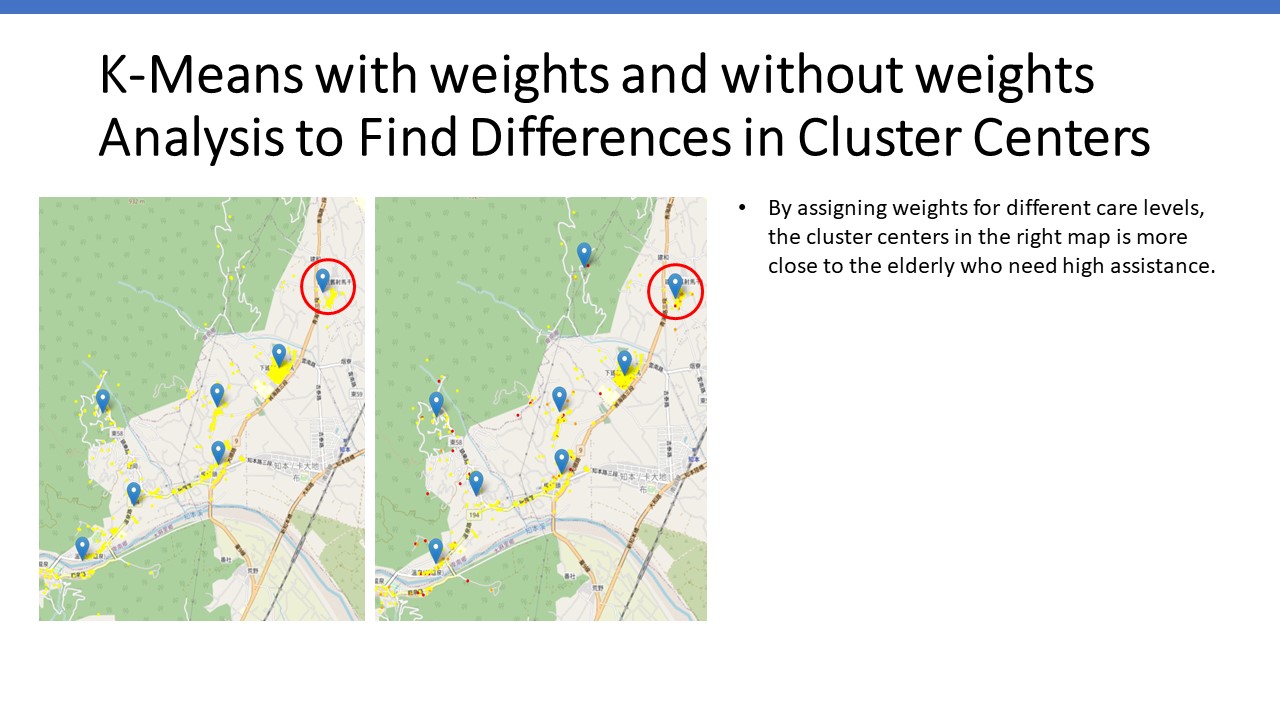 |
By assigning weights for different care levels, the cluster centers in the right map is more close to the elderly who need high assistance. You can see the cluster center on the right map is more close to the elderly who need high-care level.
|
| ICACT20230036 Slide.12
[Big Slide]
[YouTube] |
Chrome Click!! |
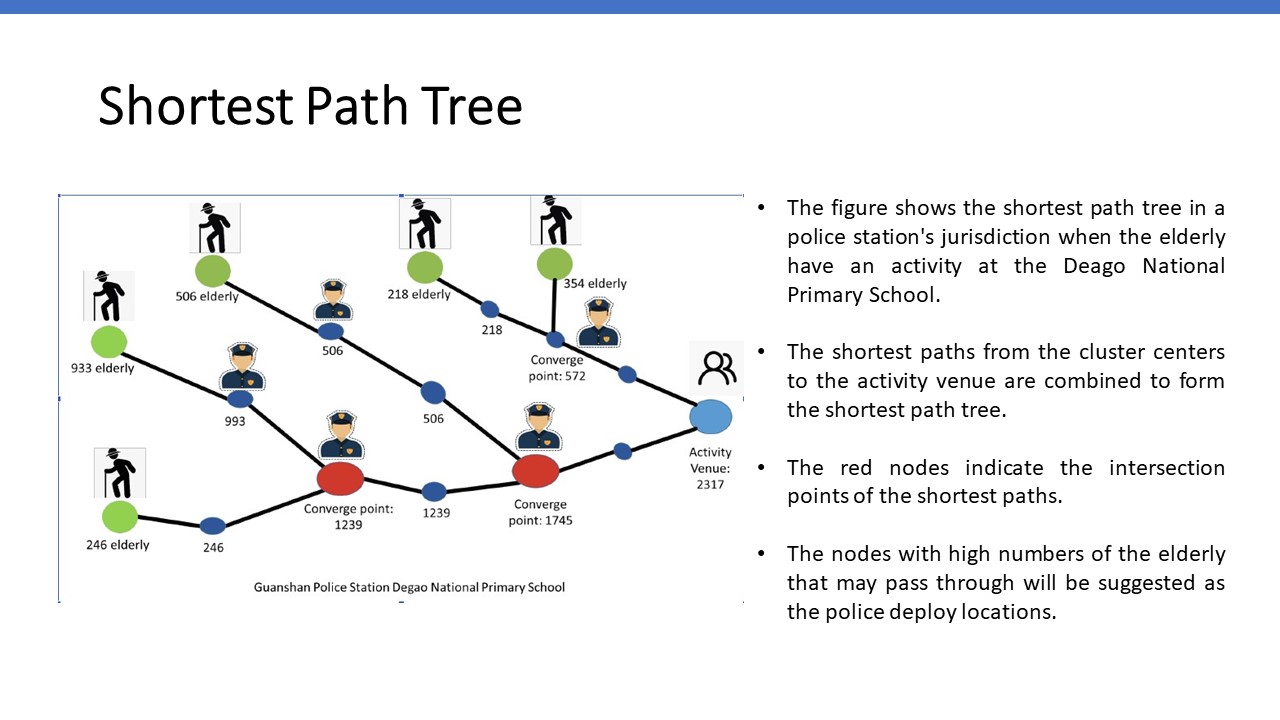 |
The figure shows the shortest path tree in a police station's jurisdiction when the elderly have an activity at the Deago National Primary School.
There are 5 clusters in the police station’s jurisdiction.
The shortest paths from the cluster centers to the activity venue are combined to form the shortest path tree.
The figure shows the number of elderly that may pass through the nodes on the shortest paths.
The red nodes indicate the intersection points of the shortest paths.
The nodes with high numbers of the elderly that may pass through will be suggested as the police deploy locations.
|
| ICACT20230036 Slide.13
[Big Slide]
[YouTube] |
Chrome Click!! |
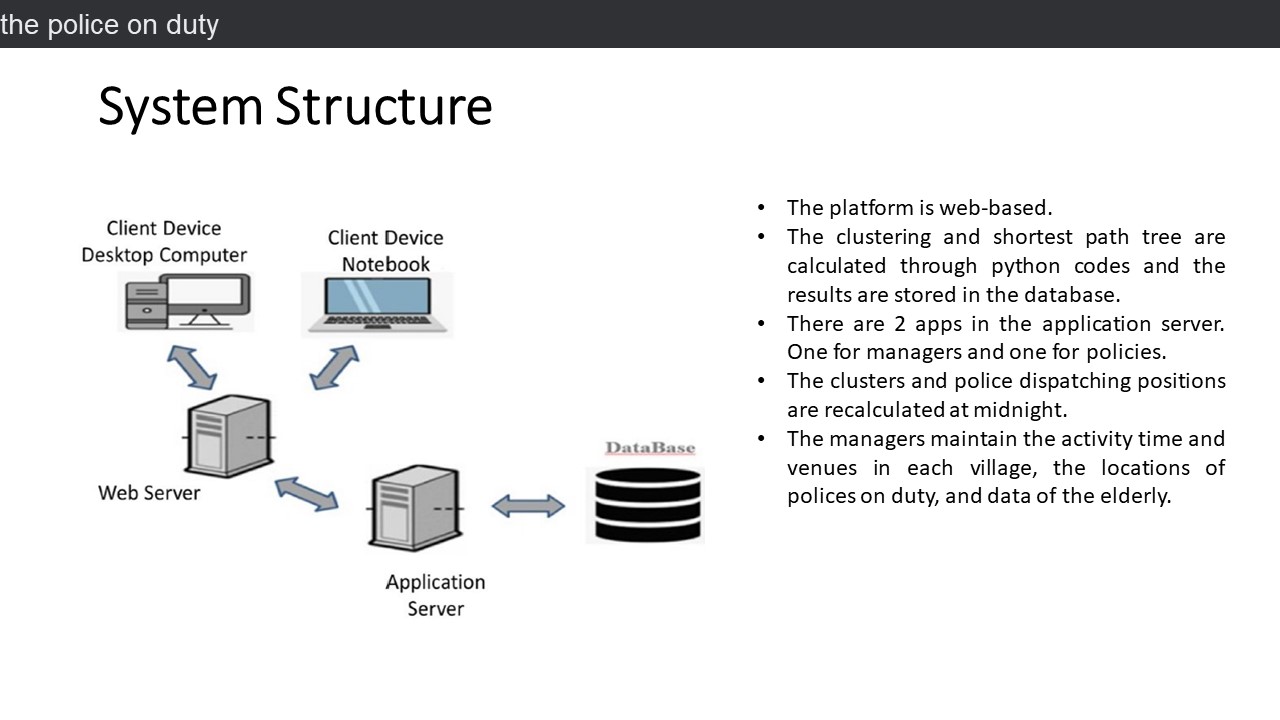 |
The system structure is shown in the figure.
Our platform is web-based.
We use PHP language and Laravel framework to develop the web part.
The clustering and shortest path tree are calculated through python codes, and the results are stored in the database.
There are 2 apps in the application server. One for managers and one for policies.
Since data of the elderly are not changed frequently, the clusters and police dispatching positions are recalculated at midnight.
There are 3 levels in the police department system, the police department, the precinct, and the police station.
The managers maintain the activity time and venues in each village, the locations of police on duty, and data of the elderly.
The polices could see their duty locations from the map in the app.
|
| ICACT20230036 Slide.14
[Big Slide]
[YouTube] |
Chrome Click!! |
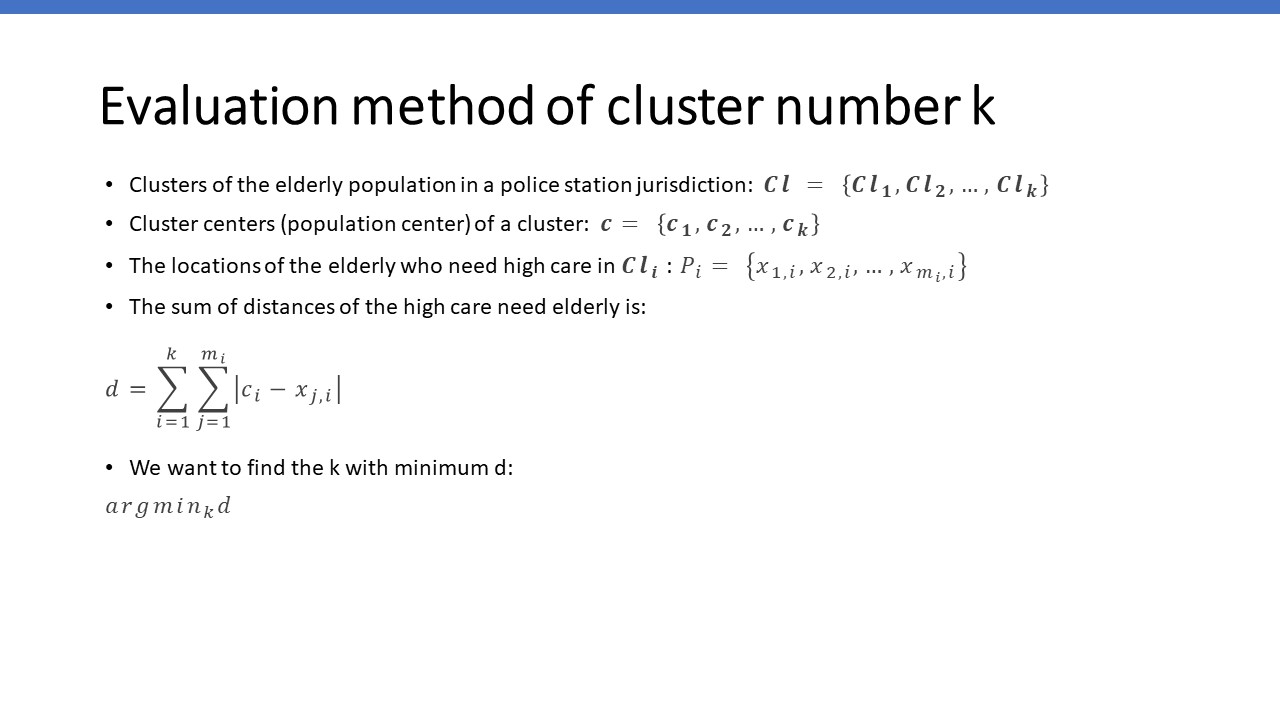 |
In this slide, we shows the clusters of the elderly population in a police station’s jurisdiction 𝑪𝒍, the cluster centers of a cluster 𝒄, and the locations of the elderly who need high care in Cl.
D is the sum of distances of the high-care need elderly.
We want to find the k with minimum d.
|
| ICACT20230036 Slide.15
[Big Slide]
[YouTube] |
Chrome Click!! |
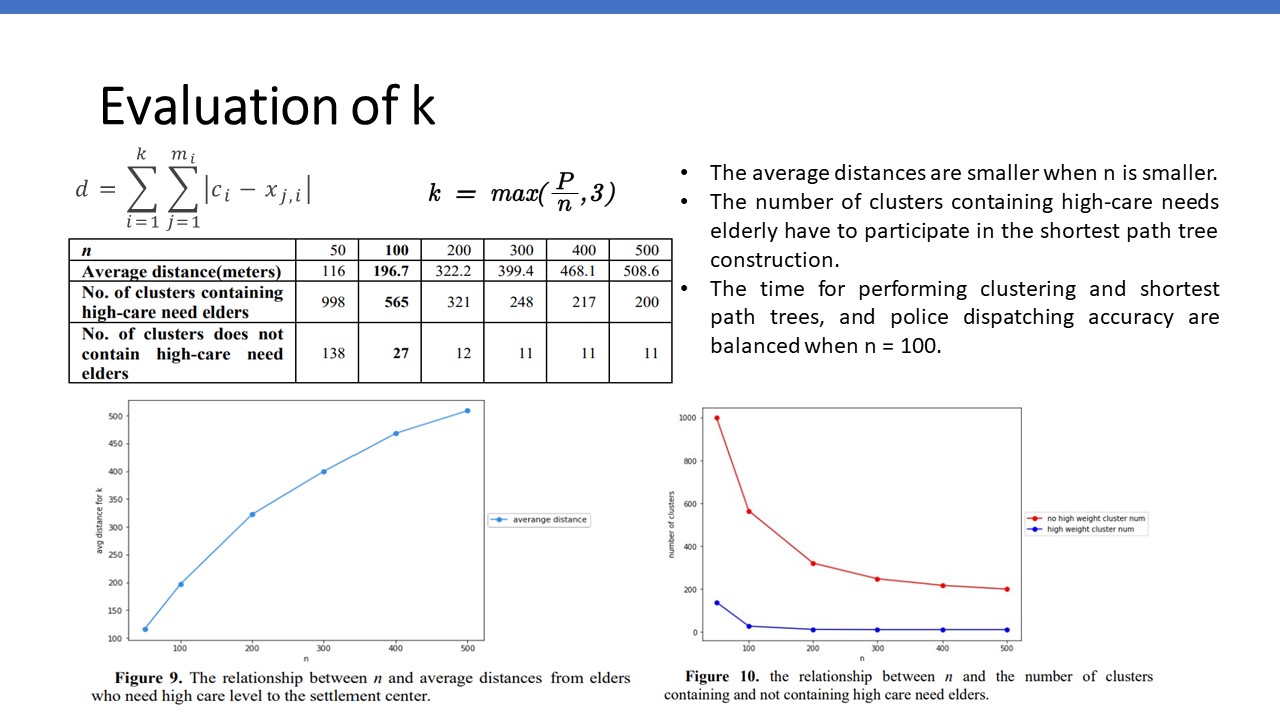 |
If the distance d is smaller, the cluster centers are more close to the elderly so that the end point of the shortest path is more close to the elderly.
If the end point of the shortest path is closer to the elderly, it is most likely to be adopted by the elderly to reach the activity venue.
Since the number of clusters containing high-care needs elderly have to participate in the shortest path tree construction. The larger value means we need more calculate times.
From the figures, we could find that when n is equal to 100, the distance between the cluster center and the location of the elderly is short enough. It also doesn’t take so much time to perform clustering and shortest path trees.
|
| ICACT20230036 Slide.16
[Big Slide]
[YouTube] |
Chrome Click!! |
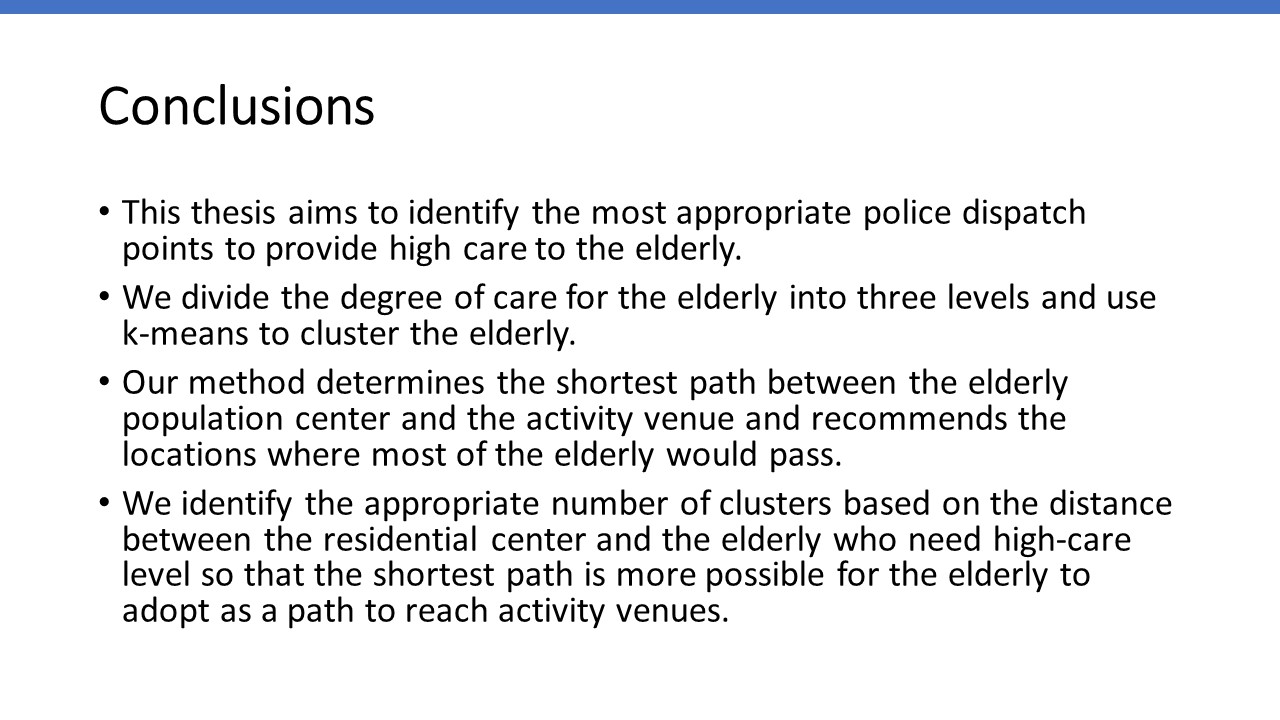 |
This thesis aims to identify the most appropriate police dispatch points to provide high care to the elderly.
We divide the degree of care for the elderly into three levels and use k-means to cluster the elderly.
Our method determines the shortest path between the elderly population center and the activity venue and recommends the locations where most of the elderly would pass.
We identify the appropriate number of clusters based on the distance between the residential center and the elderly who need high-care level so that the shortest path is more possible for the elderly to adopt as a path to reach activity venues.
|
| ICACT20230036 Slide.17
[Big Slide]
[YouTube] |
Chrome Click!! |
 |
Thank you very much for listening to this talk. If you have any questions, you could give them at the conference sessions online. You could also contact me with email. My email is 10811117@gm.nttu.edu.tw.
|















