 ICACT20230042 Slide.00
[Big Slide]
[YouTube] |
Chrome  Click!! |
 |
The title of our presentation is "A Study on Connectivity Evaluation Among Peer Groups in Pure P2P Networks." |
| ICACT20230042 Slide.01
[Big Slide]
[YouTube] |
Chrome Click!! |
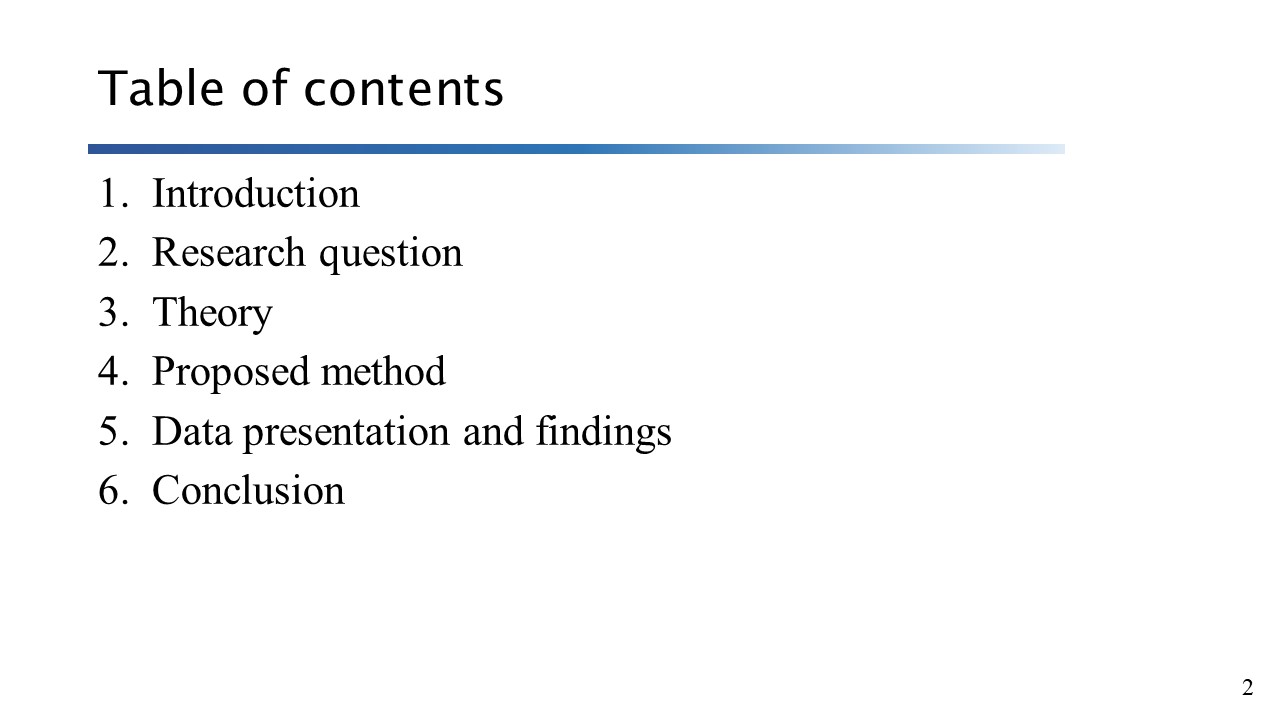 |
Table of contents is as displayed.
|
| ICACT20230042 Slide.02
[Big Slide]
[YouTube] |
Chrome Click!! |
 |
Recently P2P (peer-to-peer) network gathers attention as a technology for developing a peer group by use of connection of peers which function as autonomously distributed and cooperative units virtualized from computer resources. Wider P2P usage expands, more the need is increased in quantitative evaluation on connectivity among peer groups because pure P2P network has problem with fragmentation caused by peer's departure from peer groups. Otherwise the data collection required for quantitative evaluation to prevent this fragmentation is costly.
|
| ICACT20230042 Slide.03
[Big Slide]
[YouTube] |
Chrome Click!! |
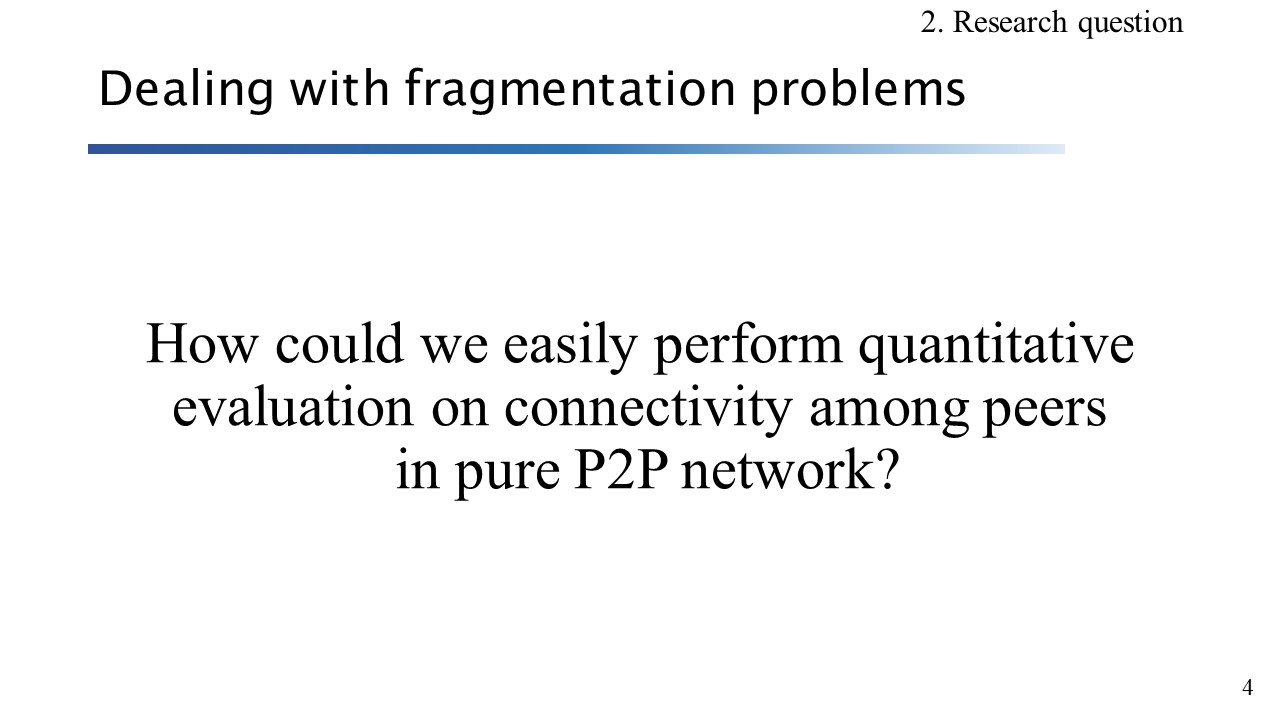 |
My research question is that how we could easily perform quantitative evaluation on connectivity among peers in pure P2P network. In this paper we propose an efficient method and clarify its effectiveness for dealing with fragmentation problems in pure P2P network.
|
| ICACT20230042 Slide.04
[Big Slide]
[YouTube] |
Chrome Click!! |
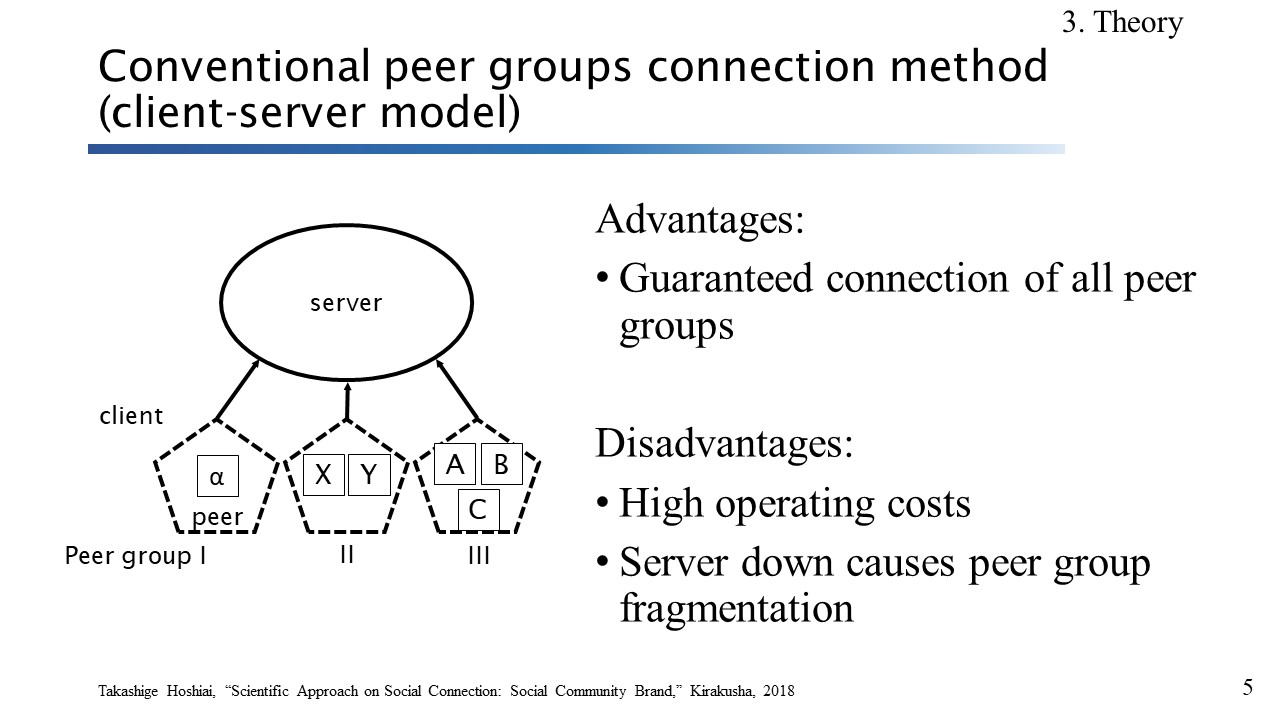 |
First, we explain conventional peer groups connection method (client-server model). It has server as an intermediate connecting peer groups. A peer is the smallest unit that makes up a network. A set of peers is called a peer group. The advantage of client-server model is a guaranteed connection of all peer groups. The disadvantages are high operating costs because of existence of a server, and that server down causes peer group fragmentation. |
| ICACT20230042 Slide.05
[Big Slide]
[YouTube] |
Chrome Click!! |
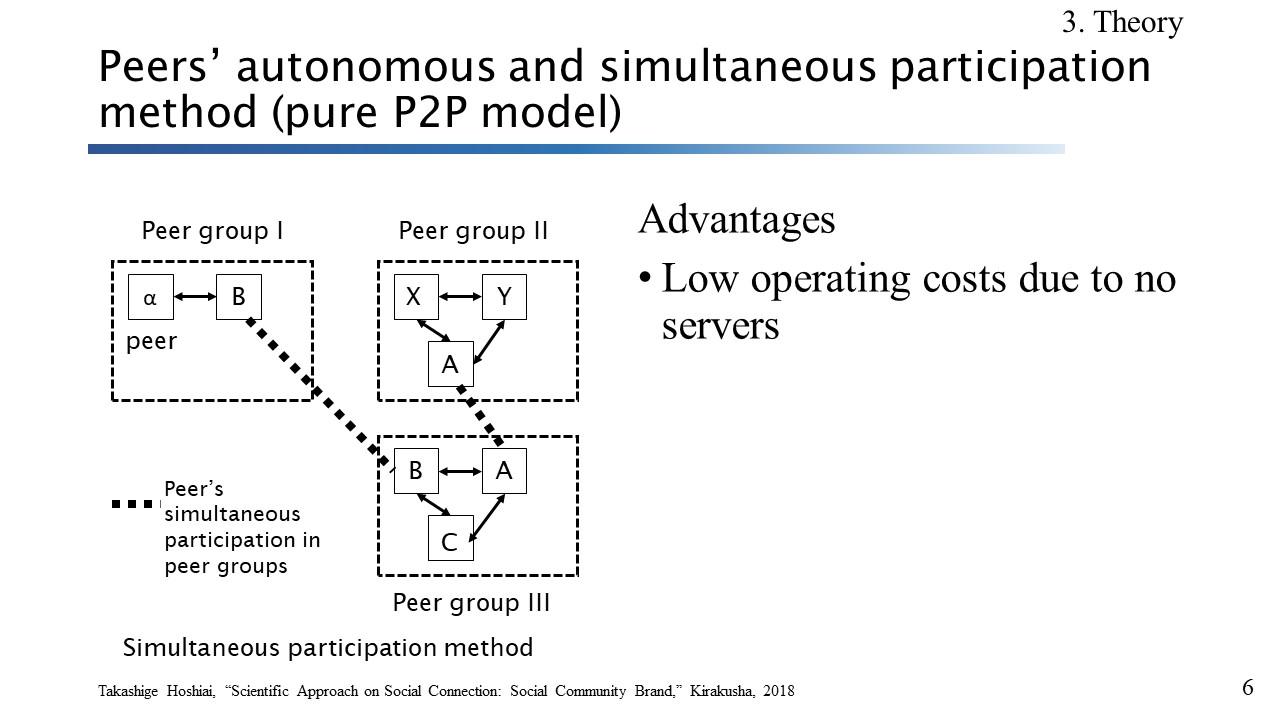 |
In contrast, peers’ autonomous and simultaneous participation method, as shown in the figure, peer A and peer B, which belong to peer group III, respectively join peer group II and peer group I simultaneously. Peer A and peer B can be connected to peer α and peer Y through peer A and peer B, and consequently, peer group I, peer group II and peer group III can be connected. The advantage of this method is that requiring low operating costs due to no servers. |
| ICACT20230042 Slide.06
[Big Slide]
[YouTube] |
Chrome Click!! |
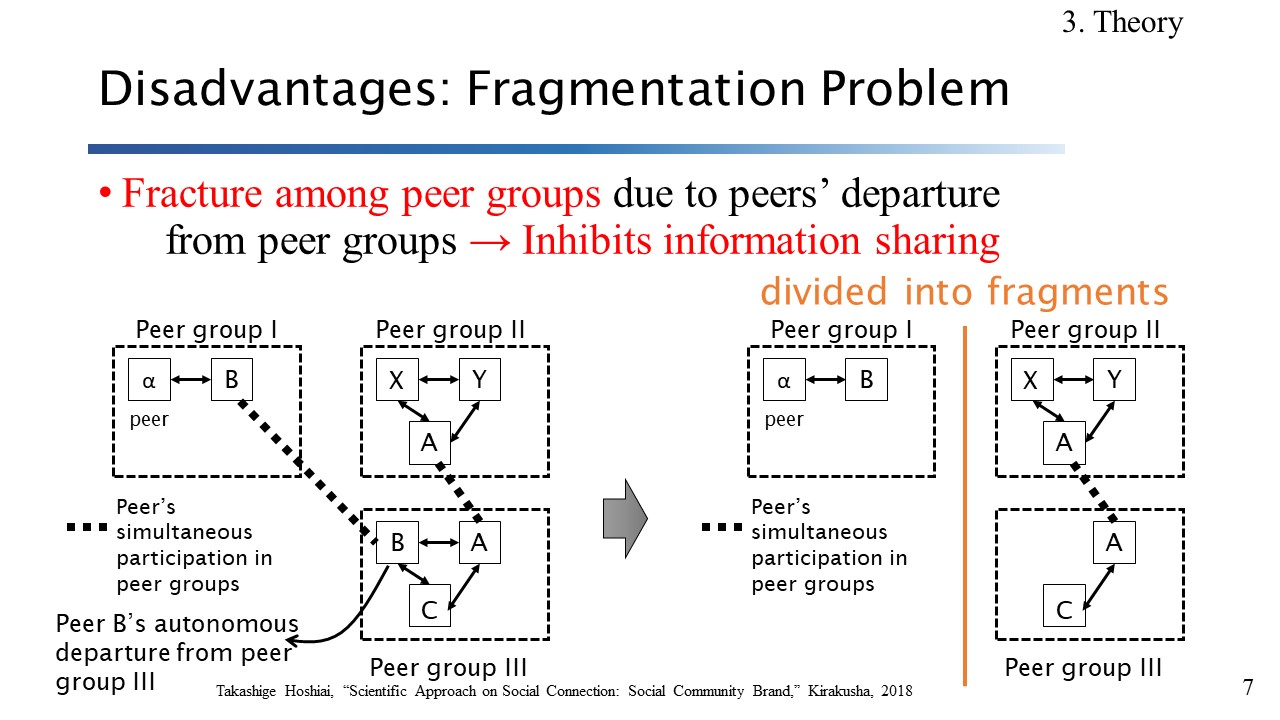 |
The disadvantage of peers’ autonomous and simultaneous participation method is fragmentation problem. When a peer connecting peer groups departs from a peer group, the peer groups are broken up into fragments. In the figure on the right, peer group I is separated from peer groups II and III because of departure of peer B from peer group III. |
| ICACT20230042 Slide.07
[Big Slide]
[YouTube] |
Chrome Click!! |
 |
Hereby we show an example of usage for peers' simultaneous participation method applied in hotel industry. About 25% of hotels introduce peers' simultaneous participation method, it is called "multi-tasking work method," and staffs are autonomously move in and out of working sections. In the figure, Staff B originally belong to front desk section is autonomously moving in a restaurant section and serving foods to guests. Staff B who interviewed guests' food preferences while working as a receptionist at the front desk will prepare the guests’ favorite food when he/she works in restaurant section. On the other hand, fragmentation might occur if Staff B quitted peers' simultaneous participation method. That will incur reduce of customer satisfaction. |
| ICACT20230042 Slide.08
[Big Slide]
[YouTube] |
Chrome Click!! |
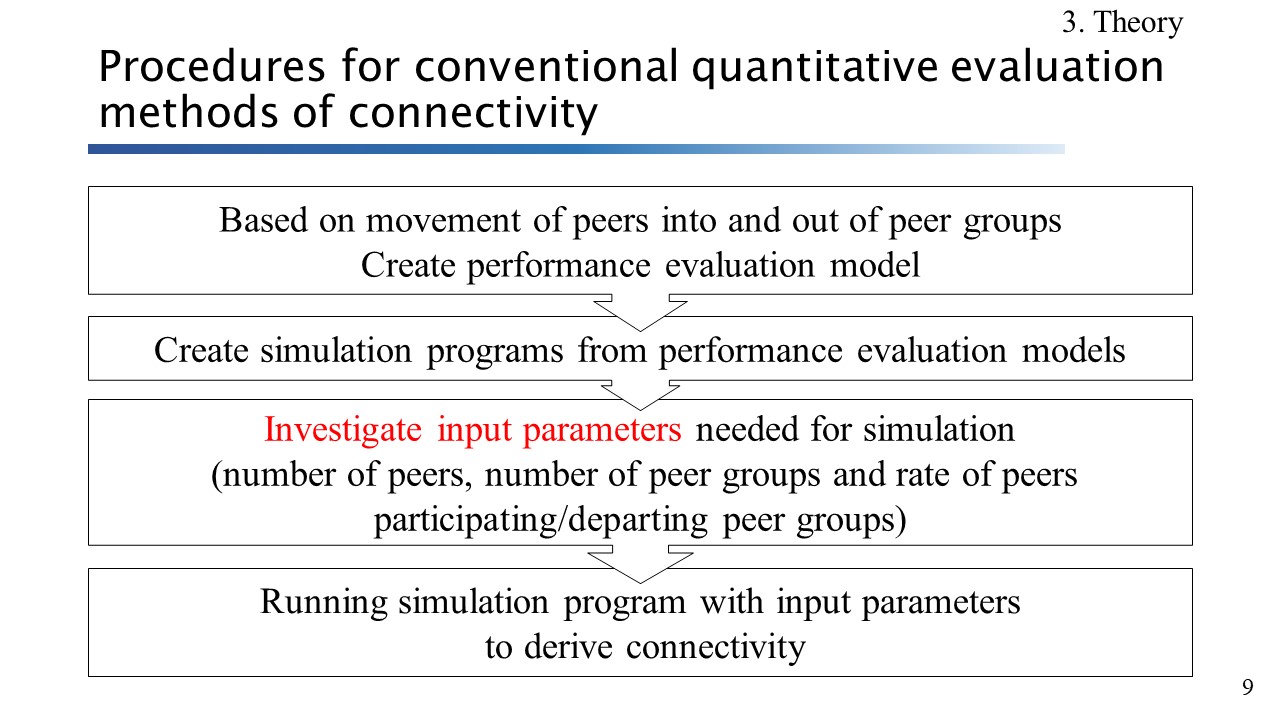 |
Quantitative evaluation for P2P network is important to deal with fragmentation among peer groups. Procedures for conventional quantitative evaluation methods of connectivity is as follows: 1. Creating performance evaluation model. 2. Create simulation programs from performance evaluation model. 3. Investigate input parameters needed for simulation. 4. Running simulation program with input parameters to derive connectivity. Investigation of input parameters demands costs because it requires to figure out number of peers, number of peer groups and rate of peers participating/departing peer groups. |
| ICACT20230042 Slide.09
[Big Slide]
[YouTube] |
Chrome Click!! |
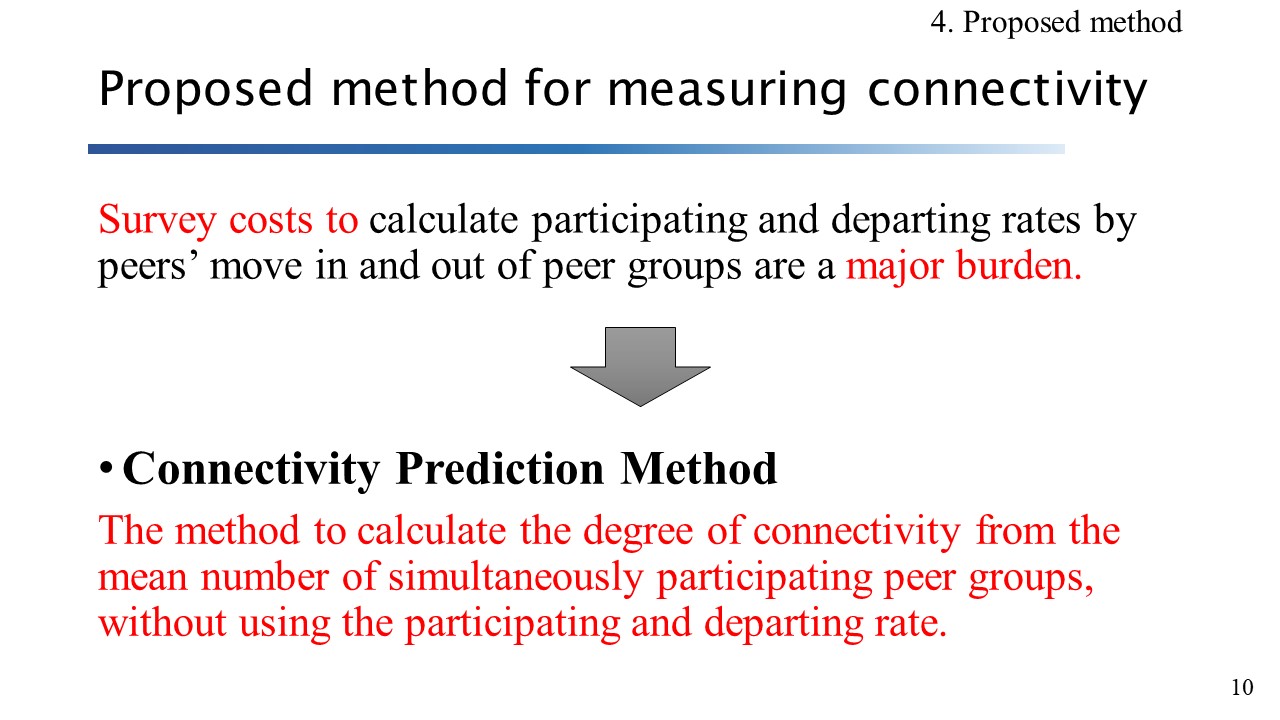 |
Especially survey costs to calculate participating and departing rates by peers’ move in and out of peer groups are a major burden. So we propose more convenient method named "Connectivity Prediction Method" which is a method to calculate the degree of connectivity from the mean number of simultaneously participating peer groups of all peers, without using the participating and departing rates. |
| ICACT20230042 Slide.10
[Big Slide]
[YouTube] |
Chrome Click!! |
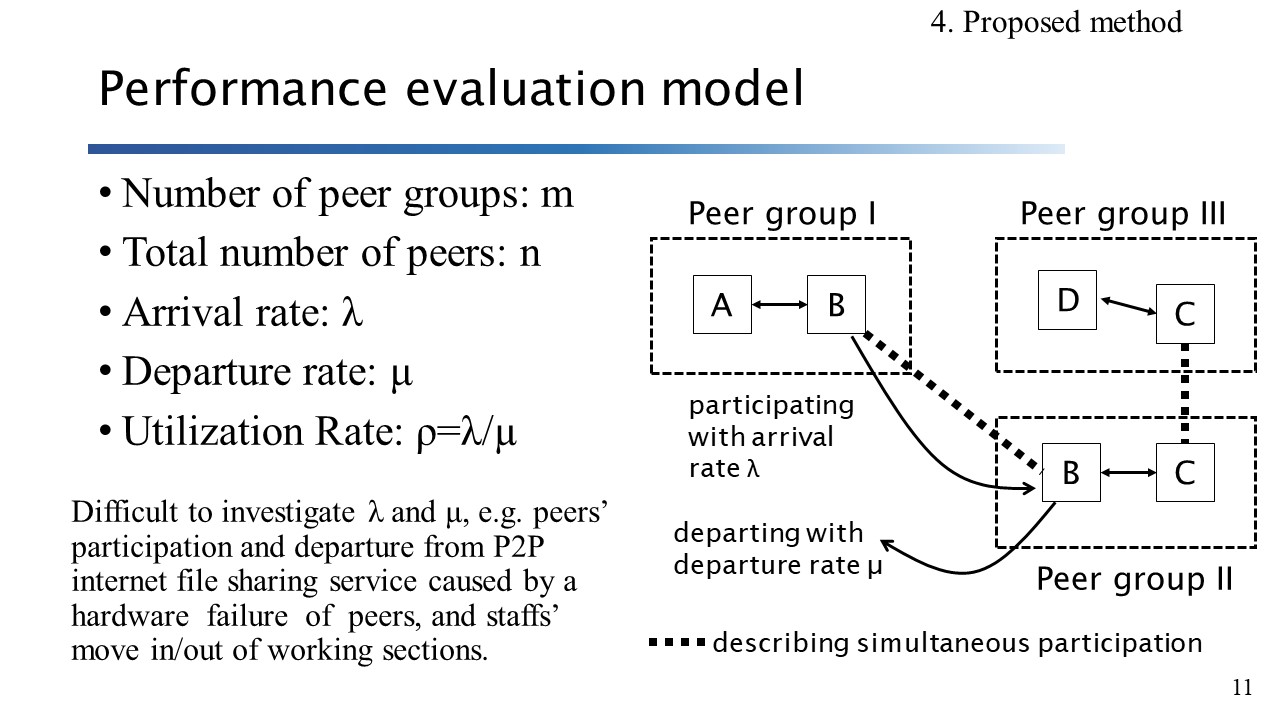 |
To describe the Connectivity Prediction Method, we create a performance evaluation model. In this model, parameters are as follows:
Number of peer groups: m
Total number of peers: n
Arrival rate: λ
Departure rate: μ
Utilization Rate: ρ=λ/µ
In the figure, peer B is participating in peer group II with arrival rate λ and also departing peer group II with departure rate μ. It is difficult to investigate λ and μ, e.g. peers’ participation and departure from P2P internet file sharing service caused by a hardware failure of peers, and staffs' move in/out of their working sections in the society. |
| ICACT20230042 Slide.11
[Big Slide]
[YouTube] |
Chrome Click!! |
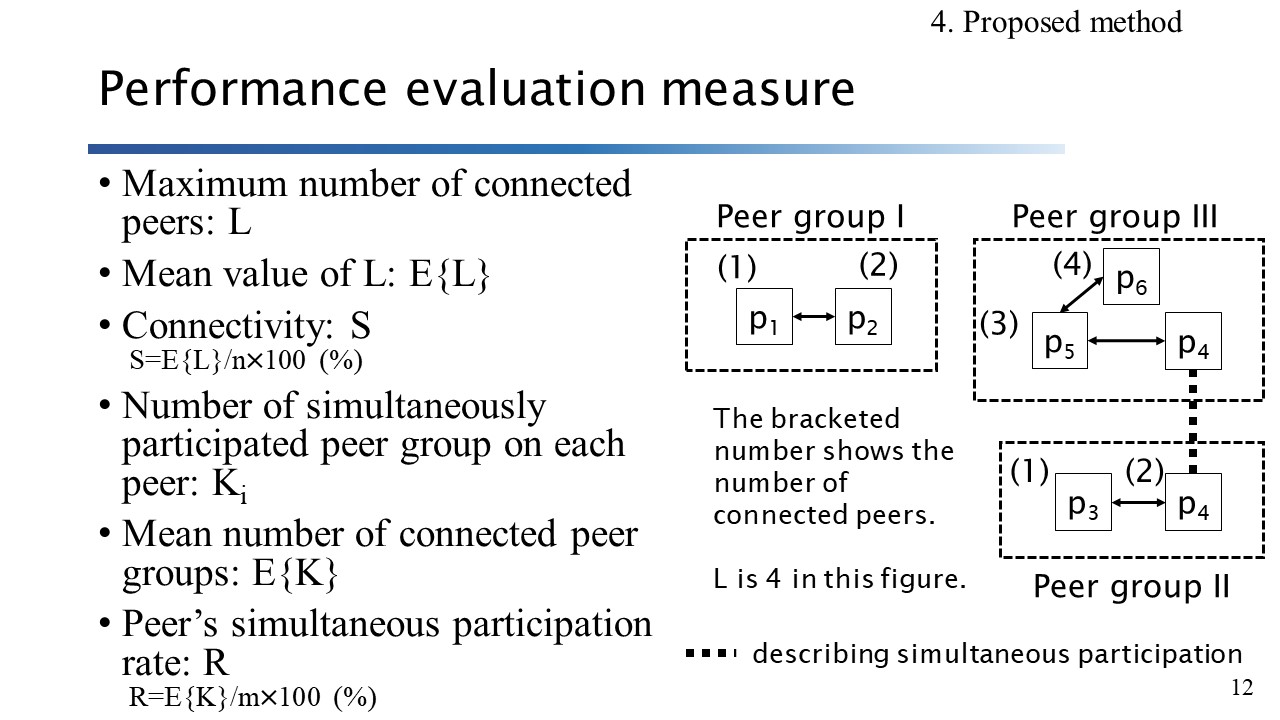 |
Next, we set up performance evaluation measures as follows:
Maximum number of connected peers: L
Mean value of L: E{L}
Connectivity: S, S=E{L}/n×100 (%)
Number of simultaneously participated peer group on each peer: Ki
Mean number of connected peer groups: E{K}
Peer's simultaneous participation rate: R, R=E{K}/m×100 (%)
In the figure, the bracketed number shows the number of connected peers. Maximum number of connected peers L is 4 (p3, p4, p5 and p6). |
| ICACT20230042 Slide.12
[Big Slide]
[YouTube] |
Chrome Click!! |
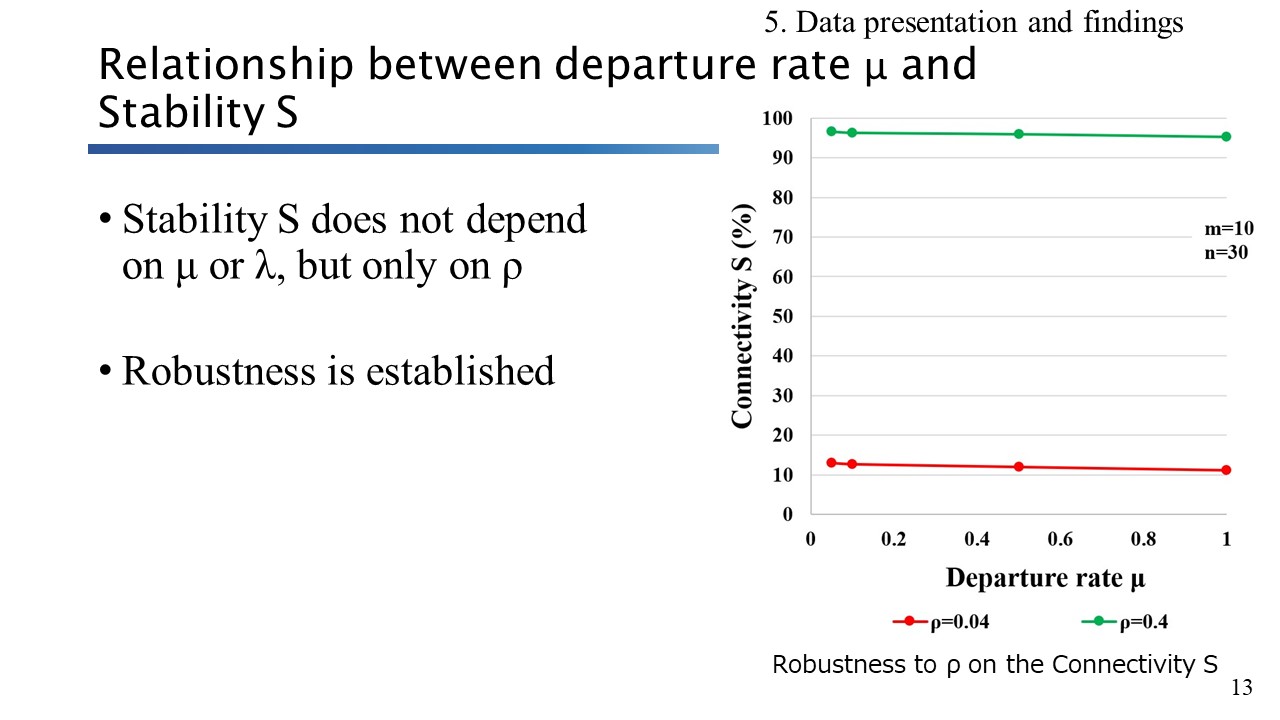 |
Here we show the simulation results in the graph. First we explain relationship between departure rate μ and Stability S. With m=10 and n=30, Stability S does not depend on μ or λ, but only on ρ. Robustness to ρ is established on the Connectivity S. |
| ICACT20230042 Slide.13
[Big Slide]
[YouTube] |
Chrome Click!! |
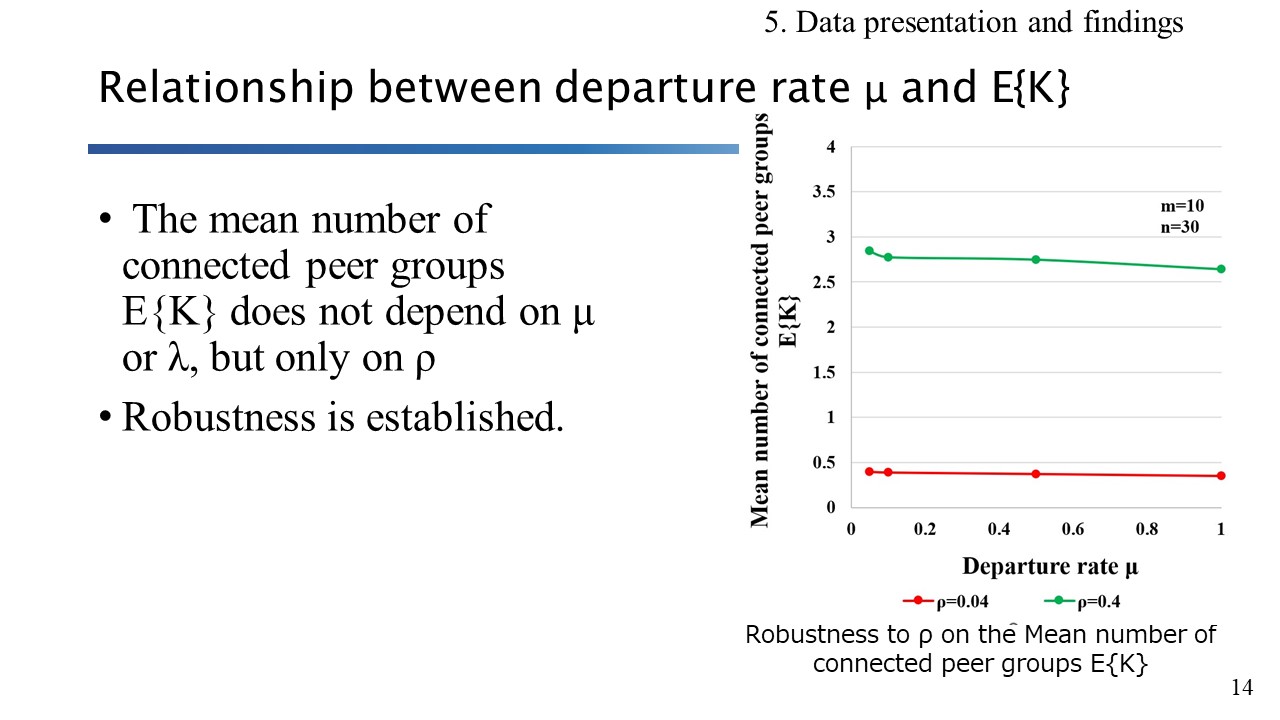 |
Next, we explain relationship between departure rate μ and the mean number of connected peer groups E{K}. With m=10 and n=30, E{K} does not depend on μ or λ, but only on ρ. Robustness to ρ is established on E{K}. |
| ICACT20230042 Slide.14
[Big Slide]
[YouTube] |
Chrome Click!! |
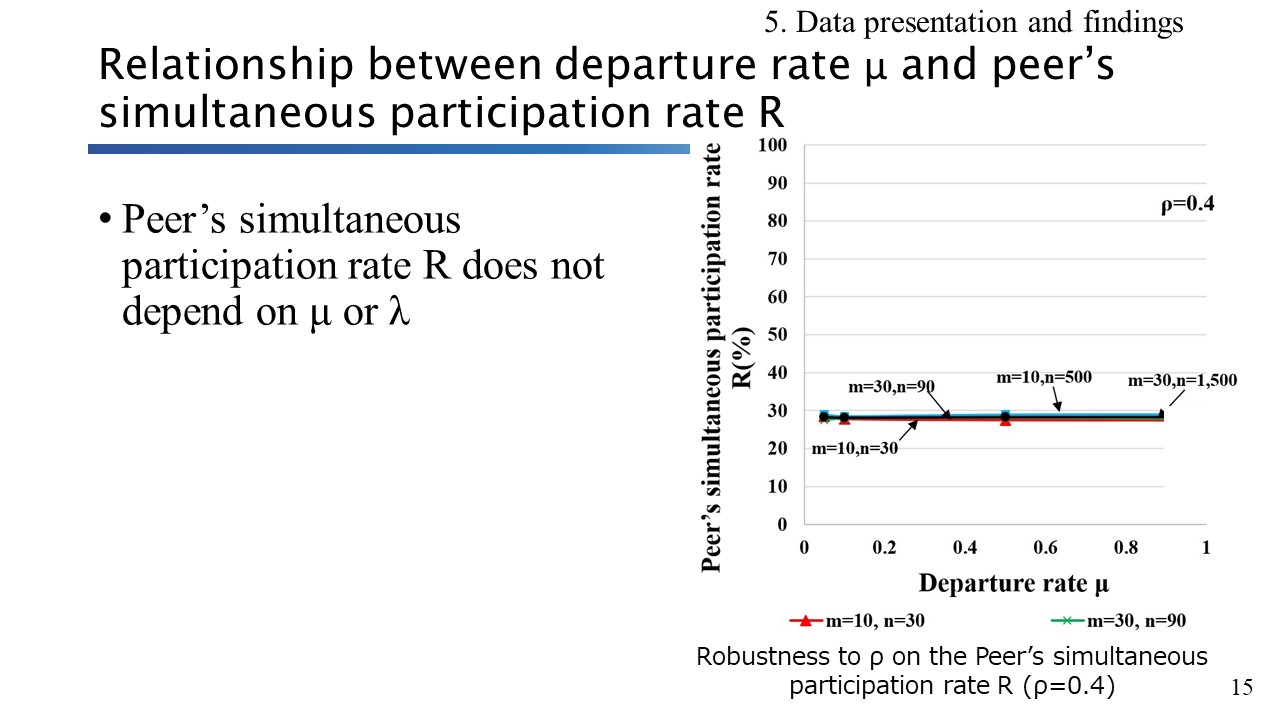 |
Here we describe relationship between departure rate μ and peer's simultaneous participation rate R using coming two slides. Peer's simultaneous participation rate R does not depend on μ or λ with ρ=0.4. |
| ICACT20230042 Slide.15
[Big Slide]
[YouTube] |
Chrome Click!! |
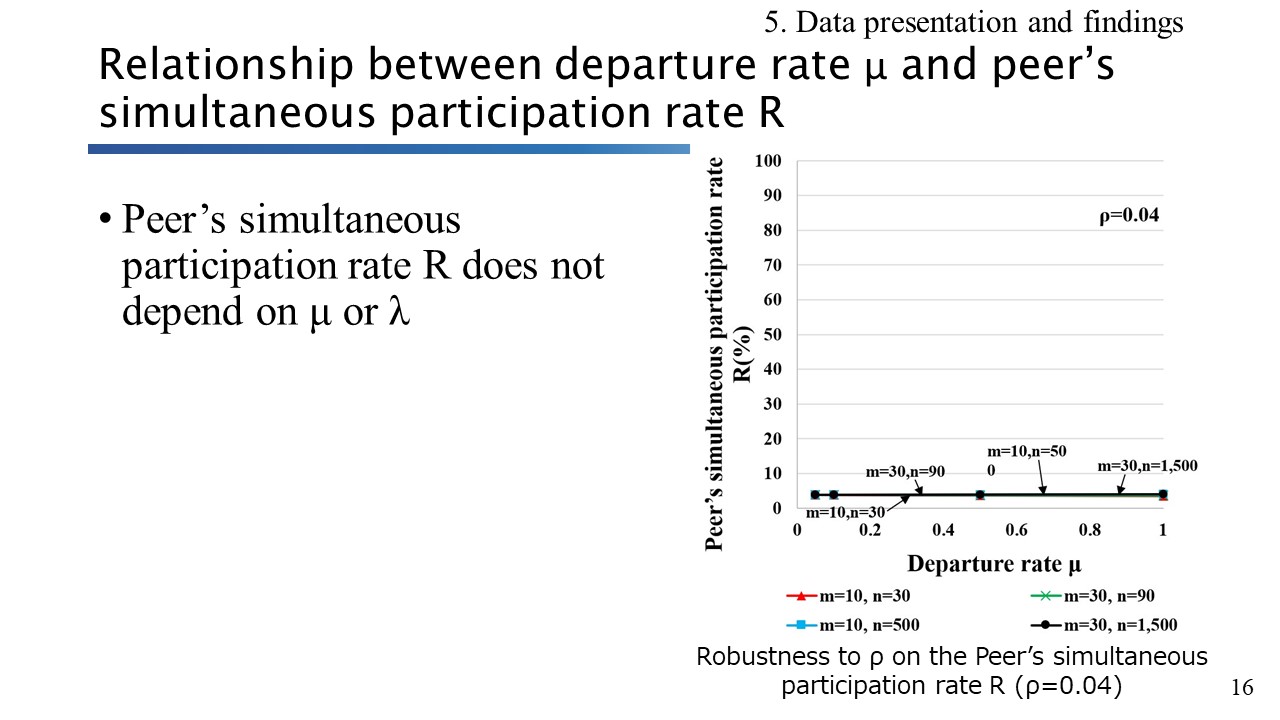 |
We describe relationship between departure rate μ and peer's simultaneous participation rate R with ρ=0.04. Peer's simultaneous participation rate R does not depend on μ or λ. |
| ICACT20230042 Slide.16
[Big Slide]
[YouTube] |
Chrome Click!! |
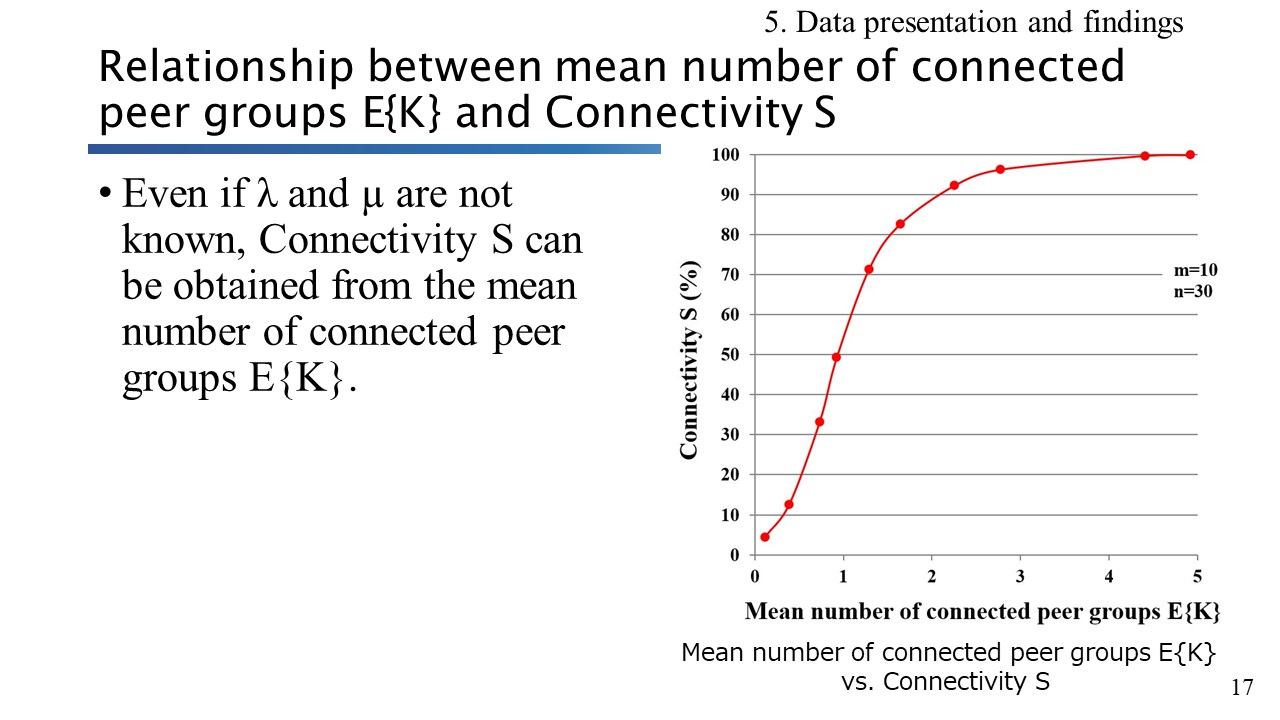 |
From combination of the graphs which are robustness of μ vs S on the slide no.13 and μ vs E{K} on the slide no.14, a graph "Mean number of connected peer groups E{K} vs. Connectivity S" can be constructed. We clarify that even if λ and μ are not known, connectivity S can be obtained from the mean number of connected peer groups E{K}. The graph shows that connectivity S is almost 100% when a peer participates in three peer groups simultaneously in average. |
| ICACT20230042 Slide.17
[Big Slide]
[YouTube] |
Chrome Click!! |
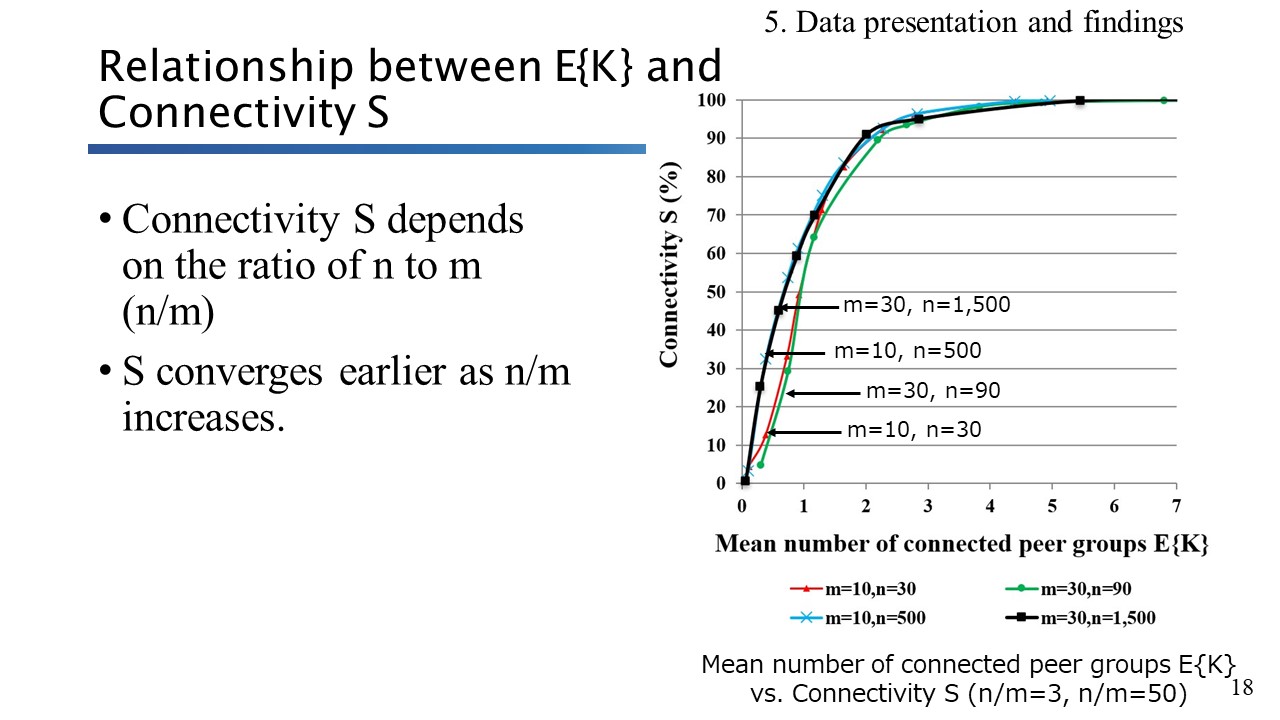 |
In the end, we explain relationship between E{K} and connectivity S with n/m=3 and n/m=50. Connectivity S depends on the ratio of n to m (n/m). S converges earlier as n/m increases. |
| ICACT20230042 Slide.18
[Big Slide]
[YouTube] |
Chrome Click!! |
 |
In conclusion, we discuss key points of the Connectivity Prediction Method. Even without knowing the arrival rate λ and the departure rate μ, the Connectivity S can be obtained from the average number of simultaneously participating peer groups E{K}. The Connectivity S depends on the ratio of n to m (n/m) (if n/m is the same, the result will be the same). The Peers simultaneous participation rate R depends only on ρ.
|
| ICACT20230042 Slide.19
[Big Slide]
[YouTube] |
Chrome Click!! |
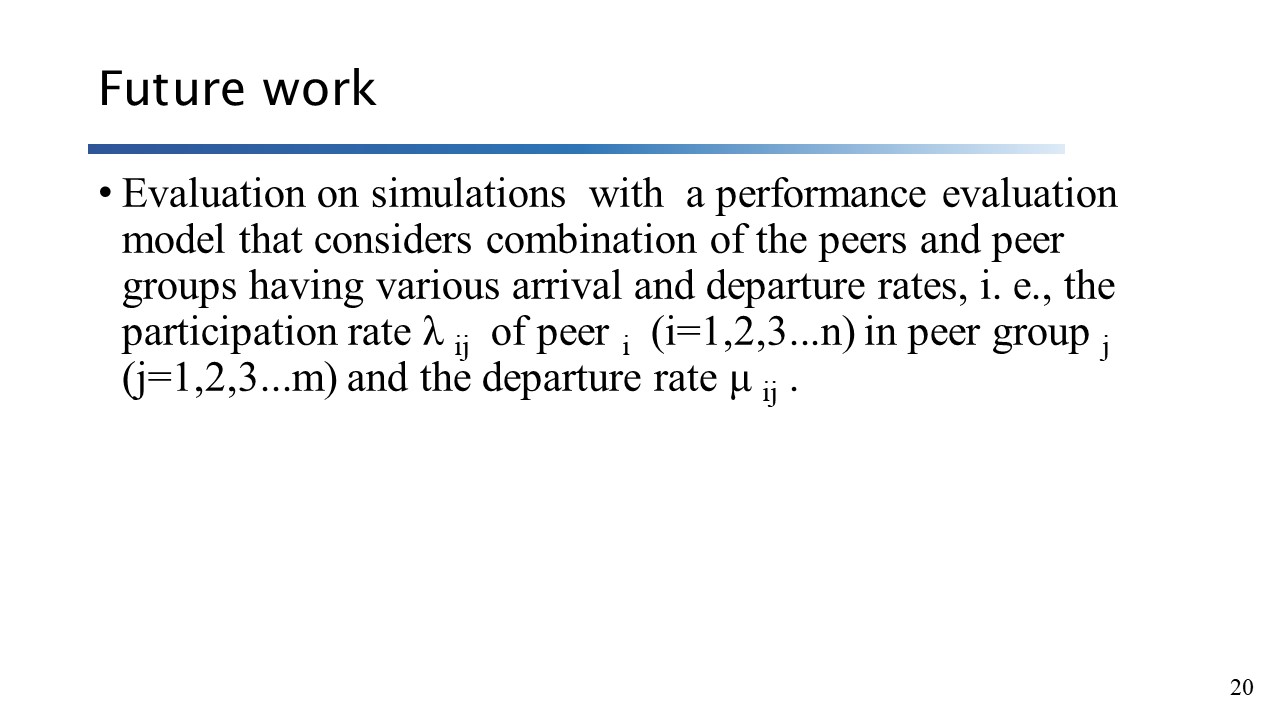 |
We plan to evaluate simulations with a performance evaluation model that considers combination of the peers and peer groups having various arrival and departure rates, i. e., the participation rate λij of peer i (i=1,2,3...n) in peer group j (j=1,2,3...m) and the departure rate μij .
|
| ICACT20230042 Slide.20
[Big Slide]
[YouTube] |
Chrome Click!! |
 |
Finally, references are provided as follows.
Thank you. |















