 ICACT20240482 Slide.01
[Big Slide]
[YouTube] |
Chrome  Click!! |
 |
Hello everybody. my name is jeeho kim.
today our presentation is ‘a study on real-time evaluation of uncertainty of PM-10 concentration determined by tele-measuring instrument’
|
| ICACT20240482 Slide.02
[Big Slide]
|
Chrome Click!! |
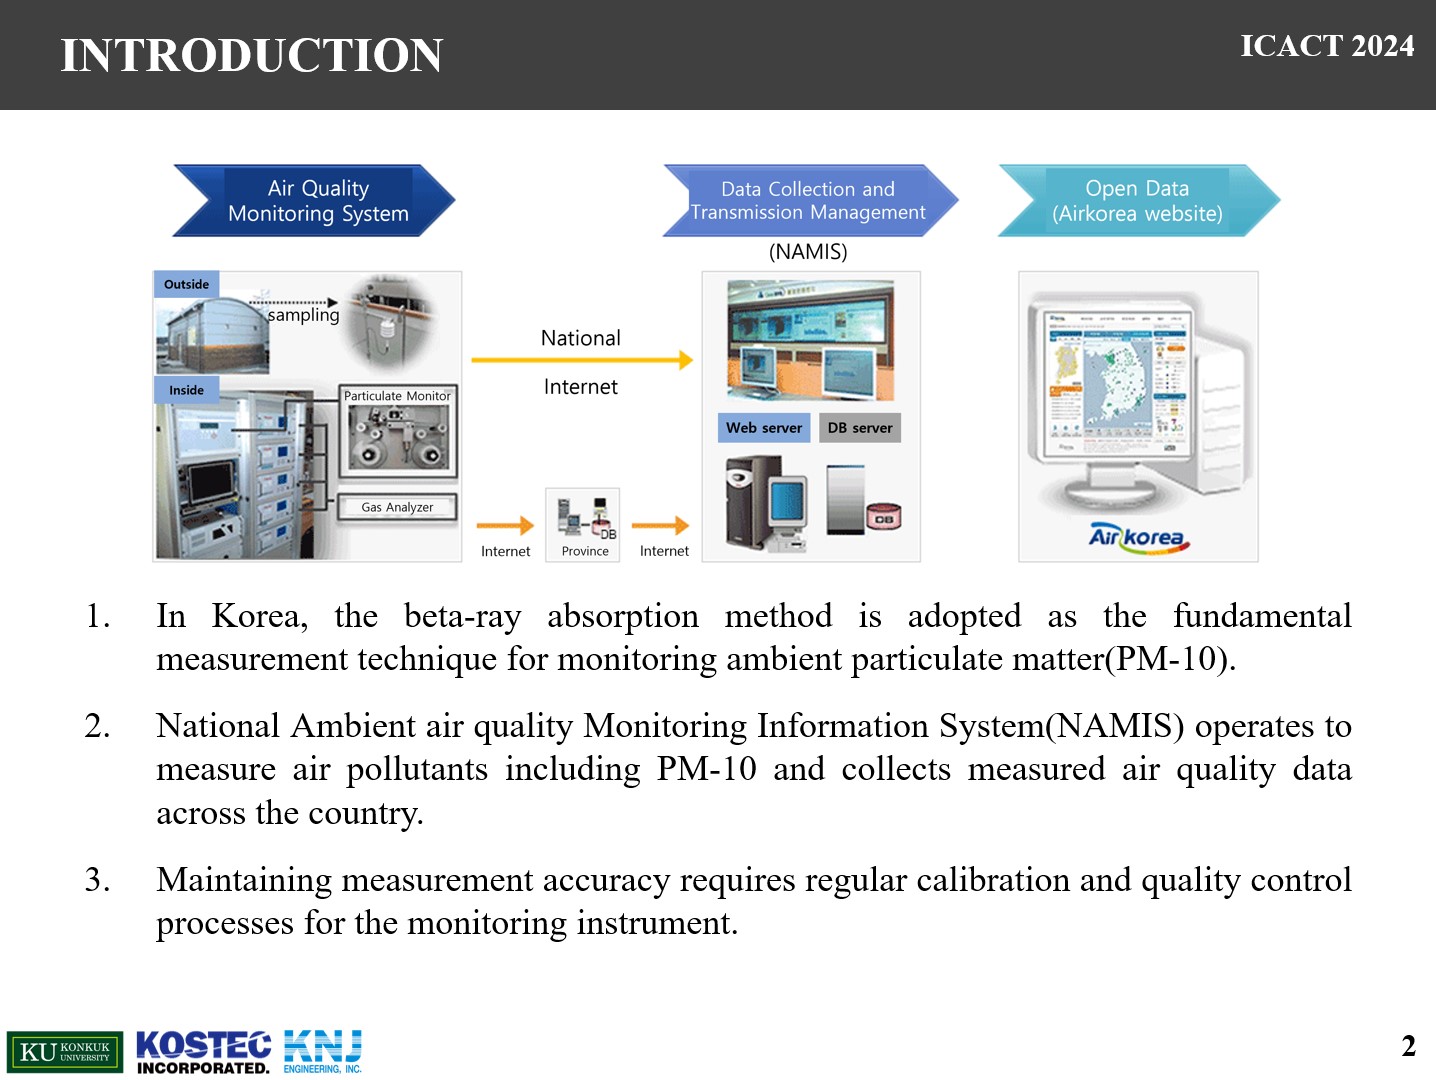 |
In Korea, the beta-ray absorption method is the primary technique for monitoring PM-10.
NAMIS is the national air quality monitoring system that collects and manages measurement data for air pollutants such as PM10 nationwide.
Measurement data, crucial for policy evaluation, requires reliable data as it is utilized in policy assessments.
To achieve this, regular calibration and quality control of the monitoring instruments are essential.
|
| ICACT20240482 Slide.03
[Big Slide]
|
Chrome Click!! |
 |
In this study, we developed an instrument for real-time monitoring of ambient PM-10 concentration and its measurement uncertainty.
This instrument uses beta-ray absorption method and uncertainty is calculated based on GUM.
Applying this instrument, PM concentration and uncertainty were collected in Gwanpyeong-dong, Daejeon for the month of November 2023.
We discussed the measurement quality and feasibility of the developed instrument for the results.
|
| ICACT20240482 Slide.04
[Big Slide]
|
Chrome Click!! |
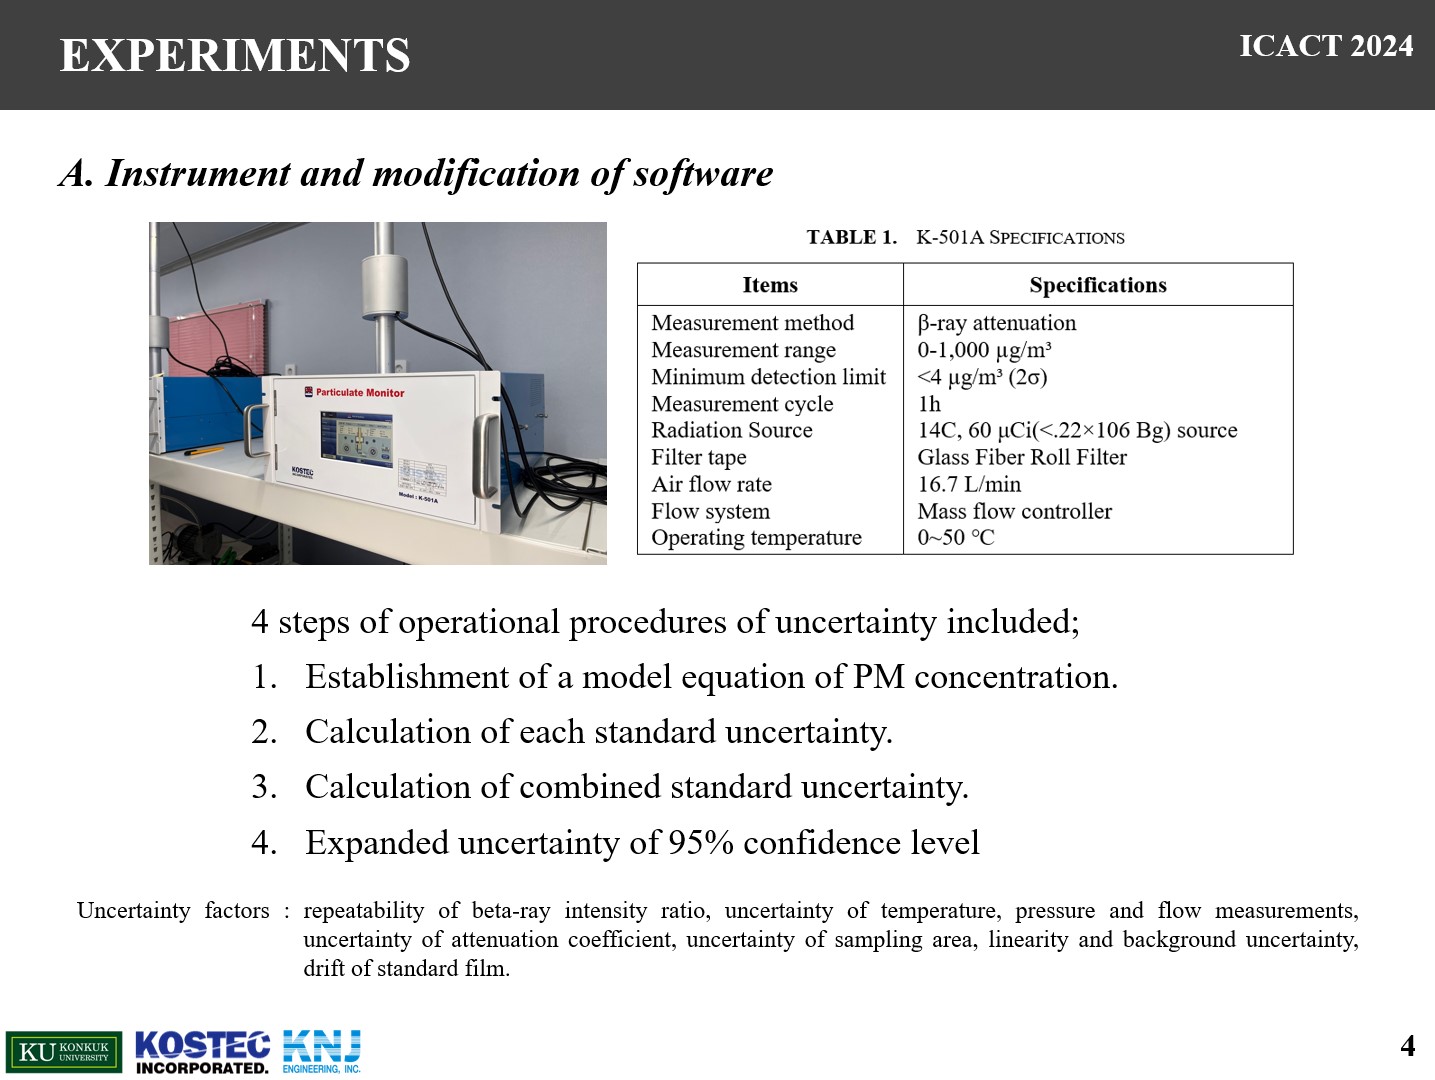 |
We modified the software of Kostec’s K-501A, a continuous ambient particulate monitoring instrument for use in this study.
To calculate measurement uncertainty, we programmed the following four steps
At first, establishing the model equation of PM concentration, at second, calculating each standard uncertainty, at third, calculating combined standard uncertainty, and finally, calcultaing expanded uncertainty of 95% confidence level.
The uncertainty factors considered here are as follows.
|
| ICACT20240482 Slide.05
[Big Slide]
|
Chrome Click!! |
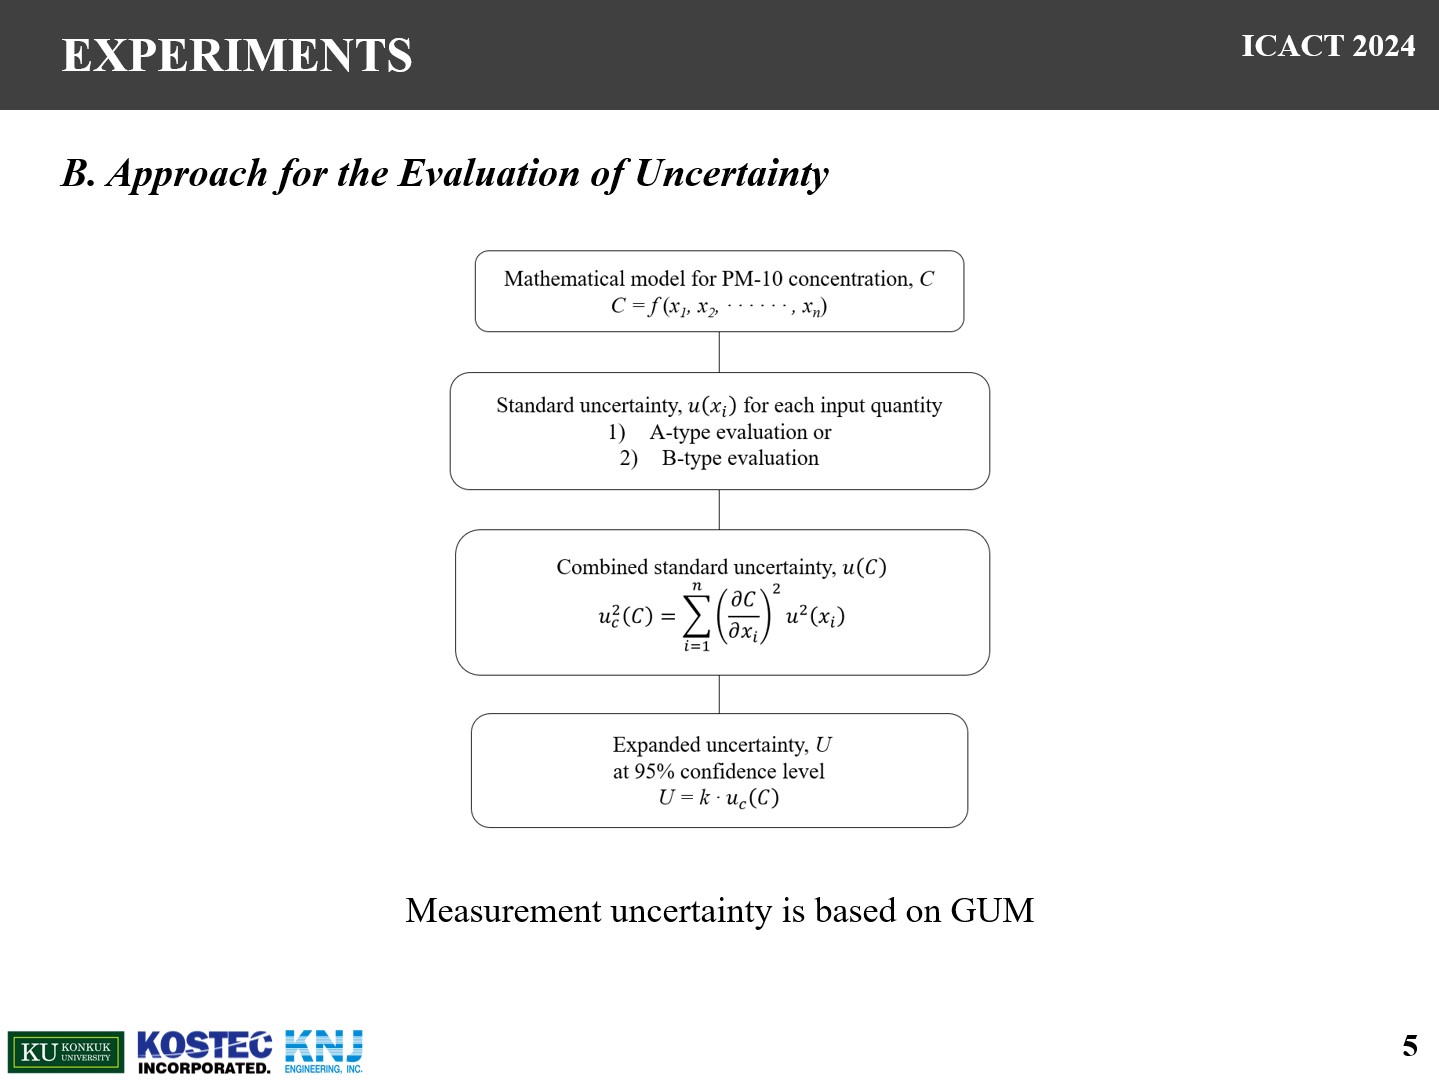 |
Generally, measurement uncertainty calculation is based on GUM. In this study, the software of K-501a was also designed to include the GUM procedure.
|
| ICACT20240482 Slide.06
[Big Slide]
|
Chrome Click!! |
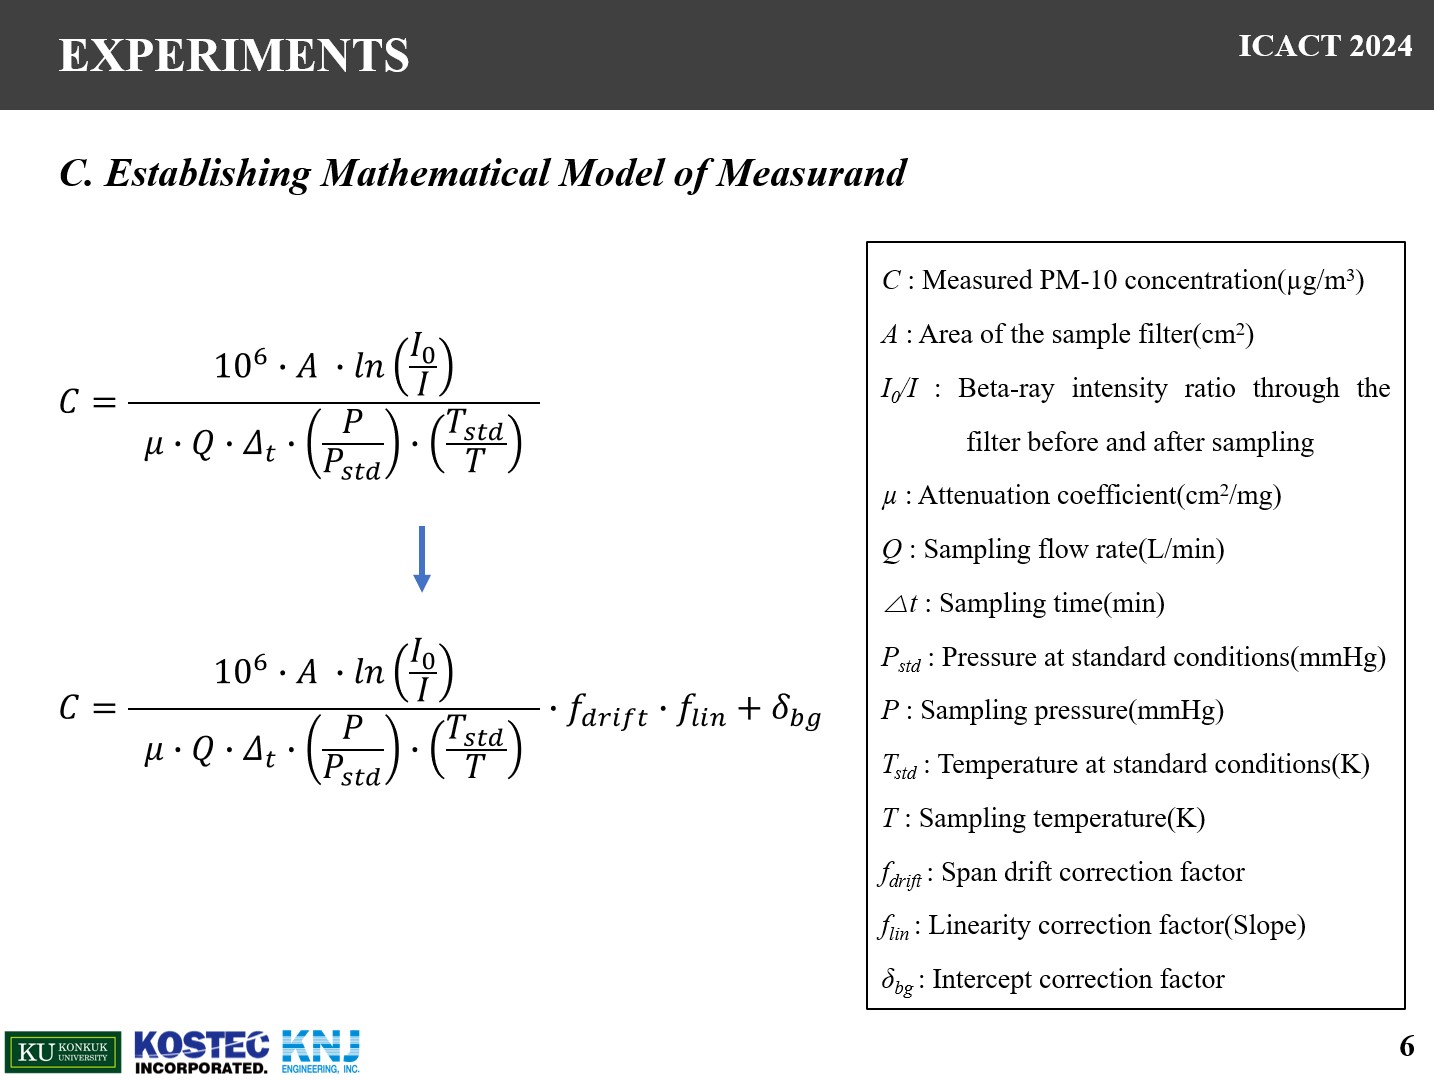 |
first, establishing mathematical model of measurand.
The concentration calculation of the beta-ray absorption method for measuring pm10 is as shown above, and the description of each variable is as shown on the right.
Uncertainty factors may arise during measurements conducted while the instrument is in operation. Accounting for uncertainty factors such as span drift, linearity, and intercept, the final equation is as shown follows.
|
| ICACT20240482 Slide.07
[Big Slide]
|
Chrome Click!! |
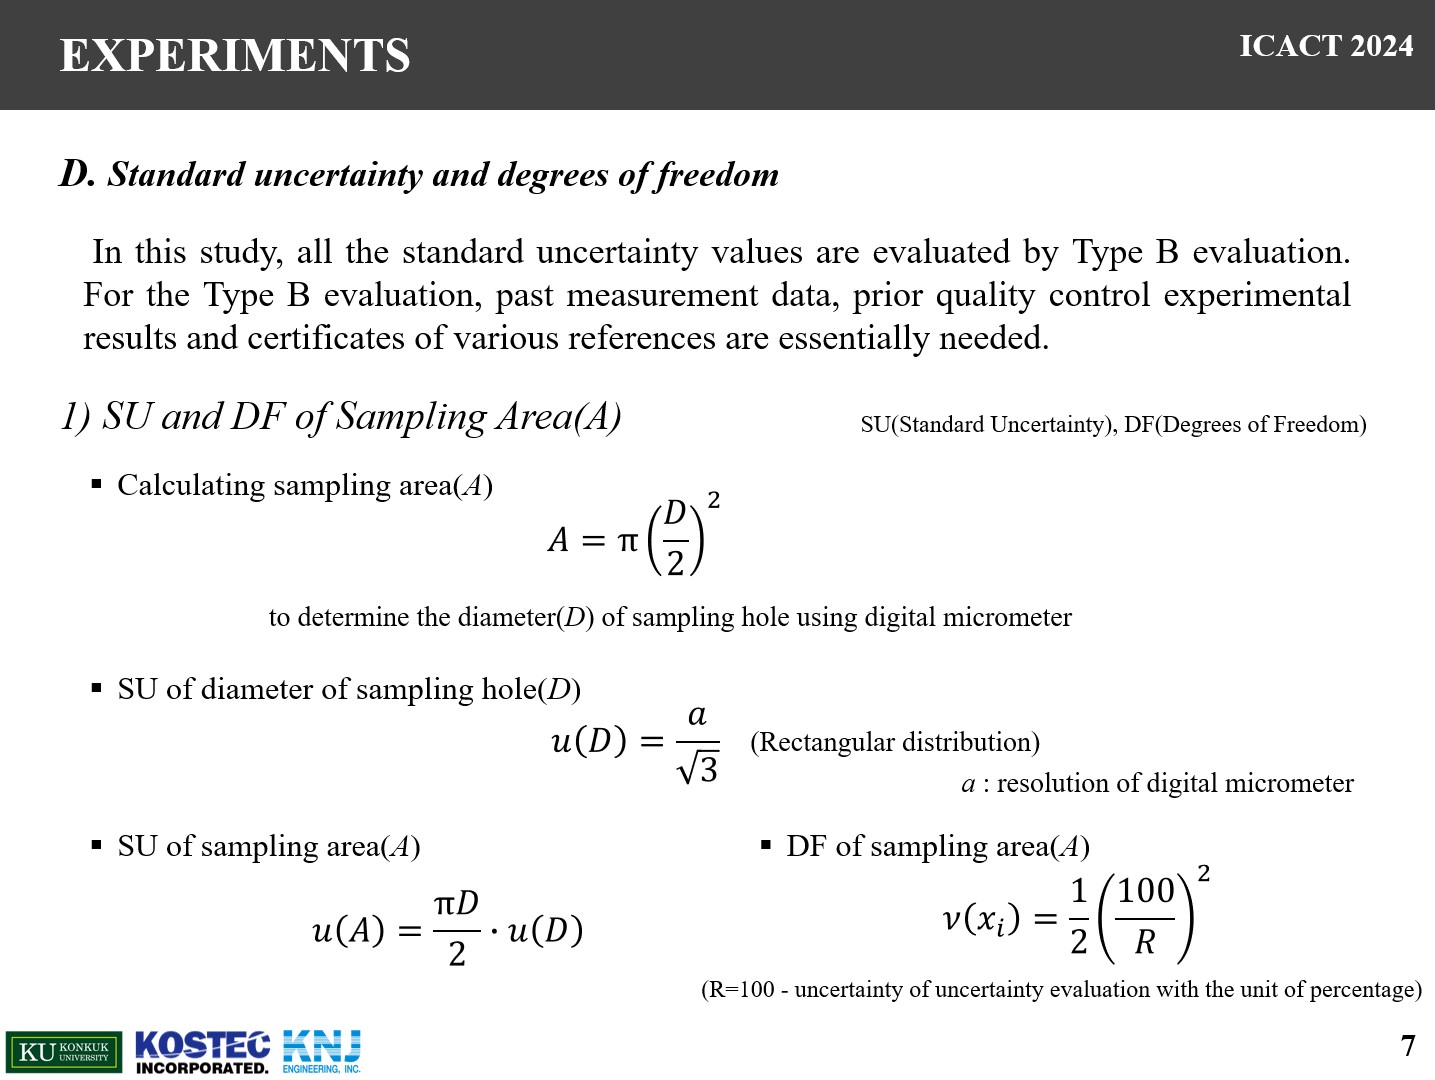 |
second step, calculation of each standard uncertainty and degrees of freedom
In this study, all the standard uncertainty values are evaluated by Type B evaluation.
For the Type B evaluation, past measurement data, prior quality control experimental results and certificates of various references are essentially needed.
Since the sampling area is determined through the diameter of the sampling hole, the standard uncertainty of the sampling area is calculated as follows.
Also, the degrees of freedom for Type B evaluation are determined as following the equation below, and following factors are mostly similar to this.
|
| ICACT20240482 Slide.08
[Big Slide]
|
Chrome Click!! |
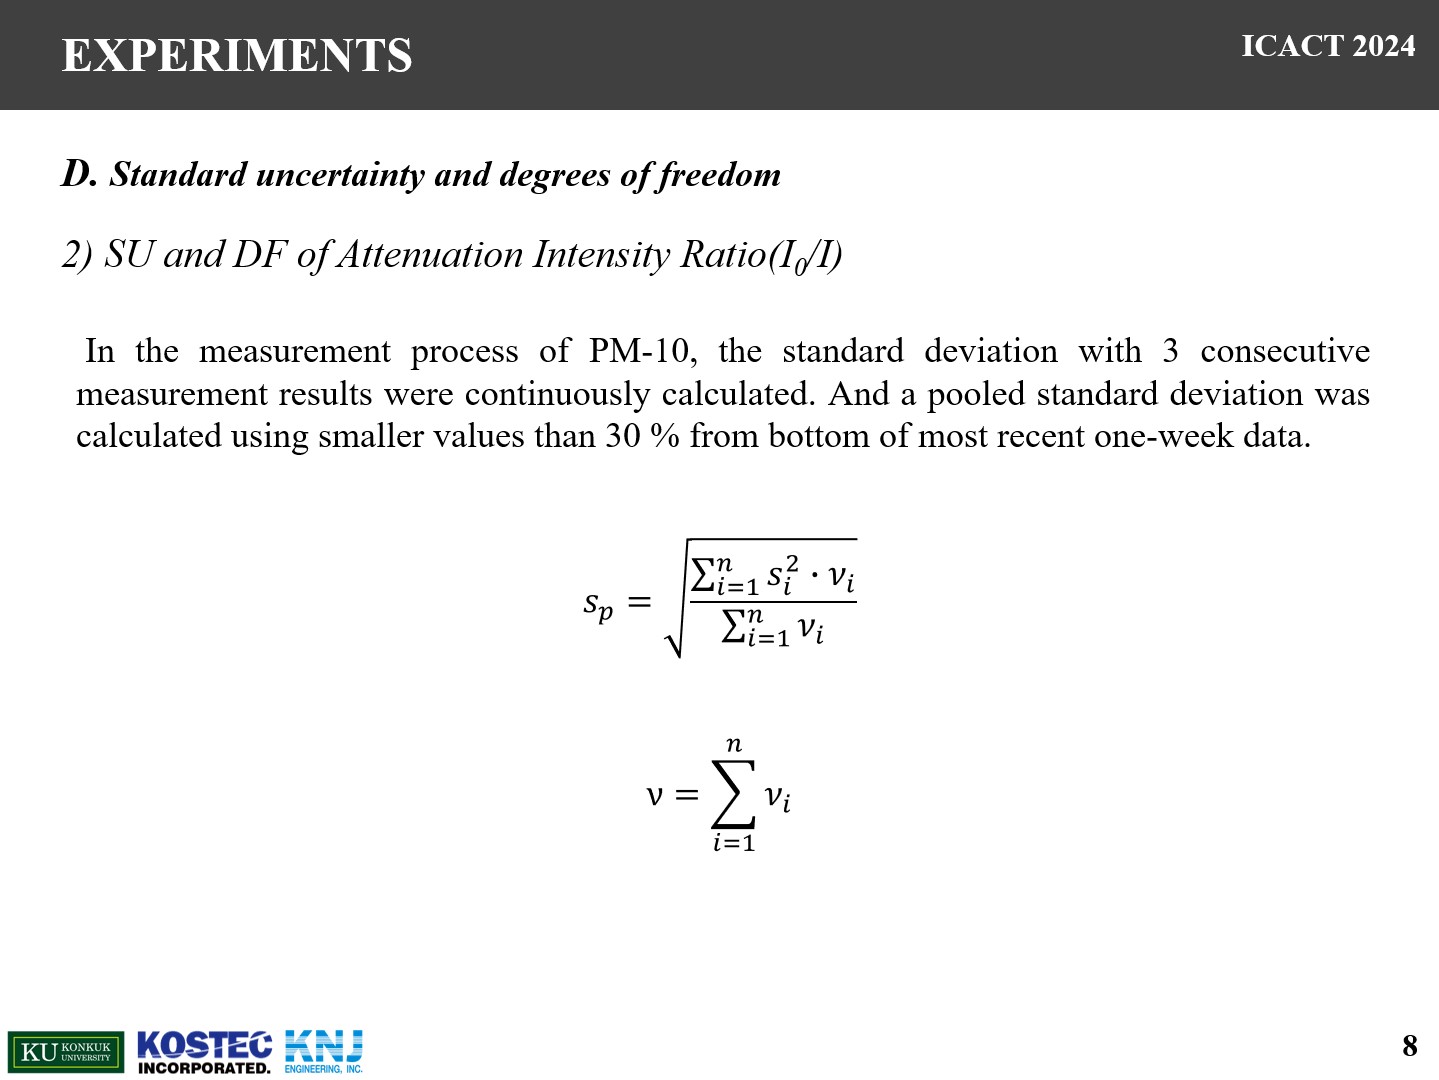 |
For the Attenuation Intensity Ratio, it determined the standard uncertainty using the pooled standard deviation.
In the measurement process of PM-10, the standard deviation with 3 consecutive measurement results were continuously calculated.
|
| ICACT20240482 Slide.09
[Big Slide]
|
Chrome Click!! |
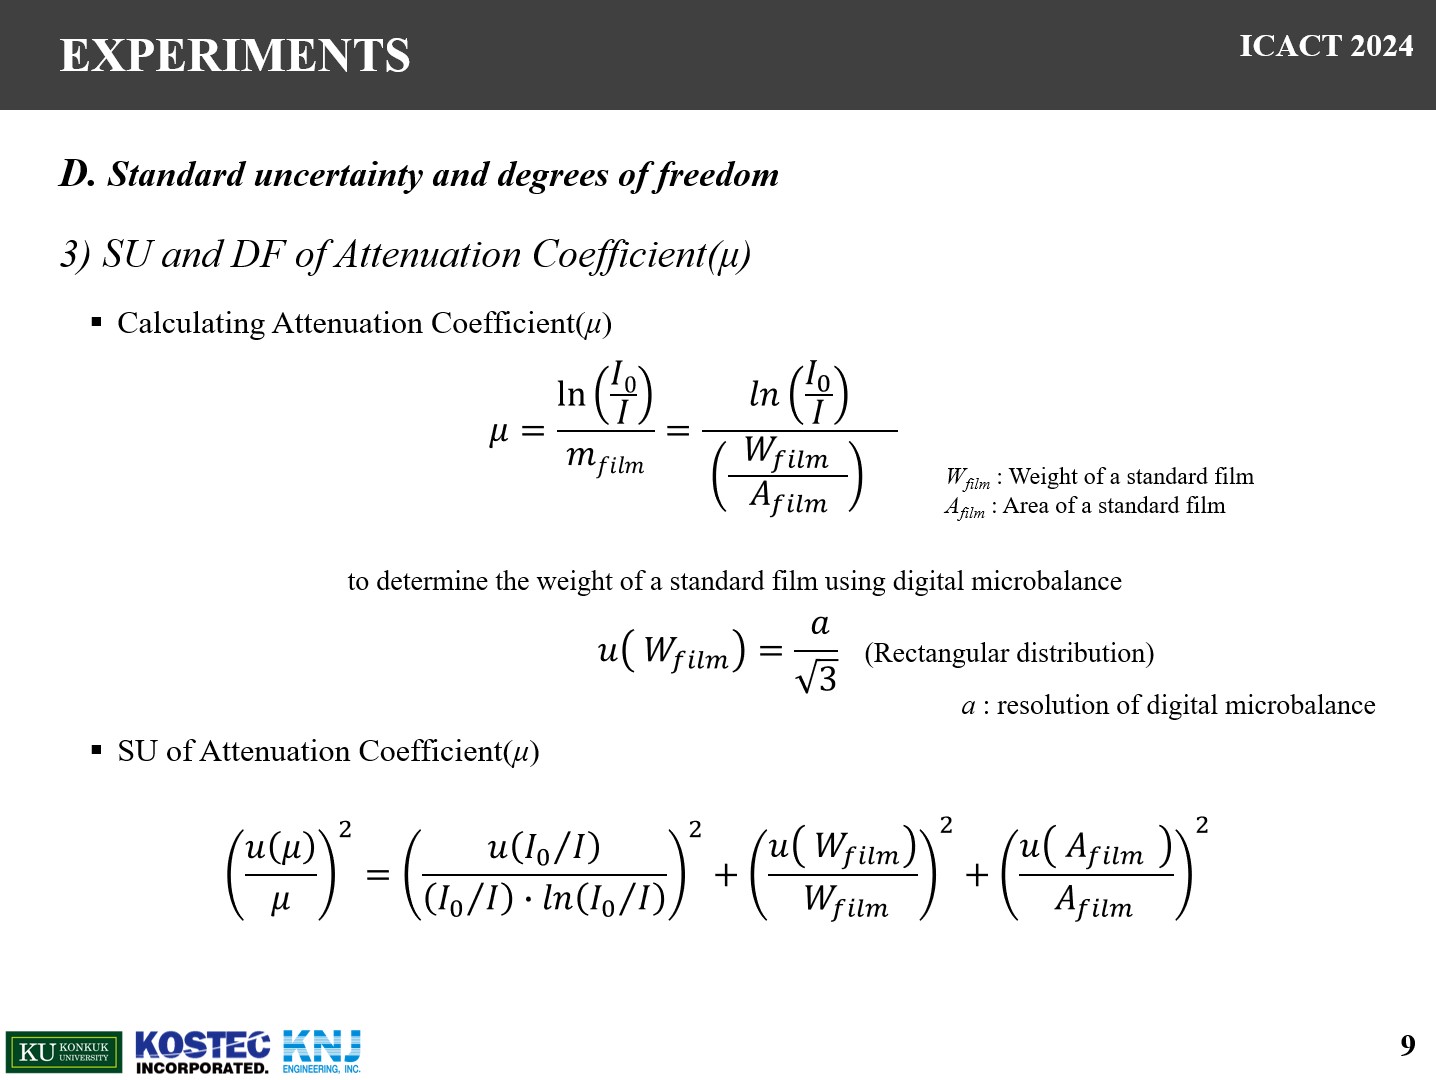 |
To determine the standard uncertainty of attenuation coefficient, it is necessary to measure the weight and area of a standard film, and the beta-ray intensity ratio before and after determining the standard film.
After calculating the individual standard uncertainties, Finally, the standard uncertainty of attenuation coefficient was combined using uncertainty propagation rule.
|
| ICACT20240482 Slide.10
[Big Slide]
|
Chrome Click!! |
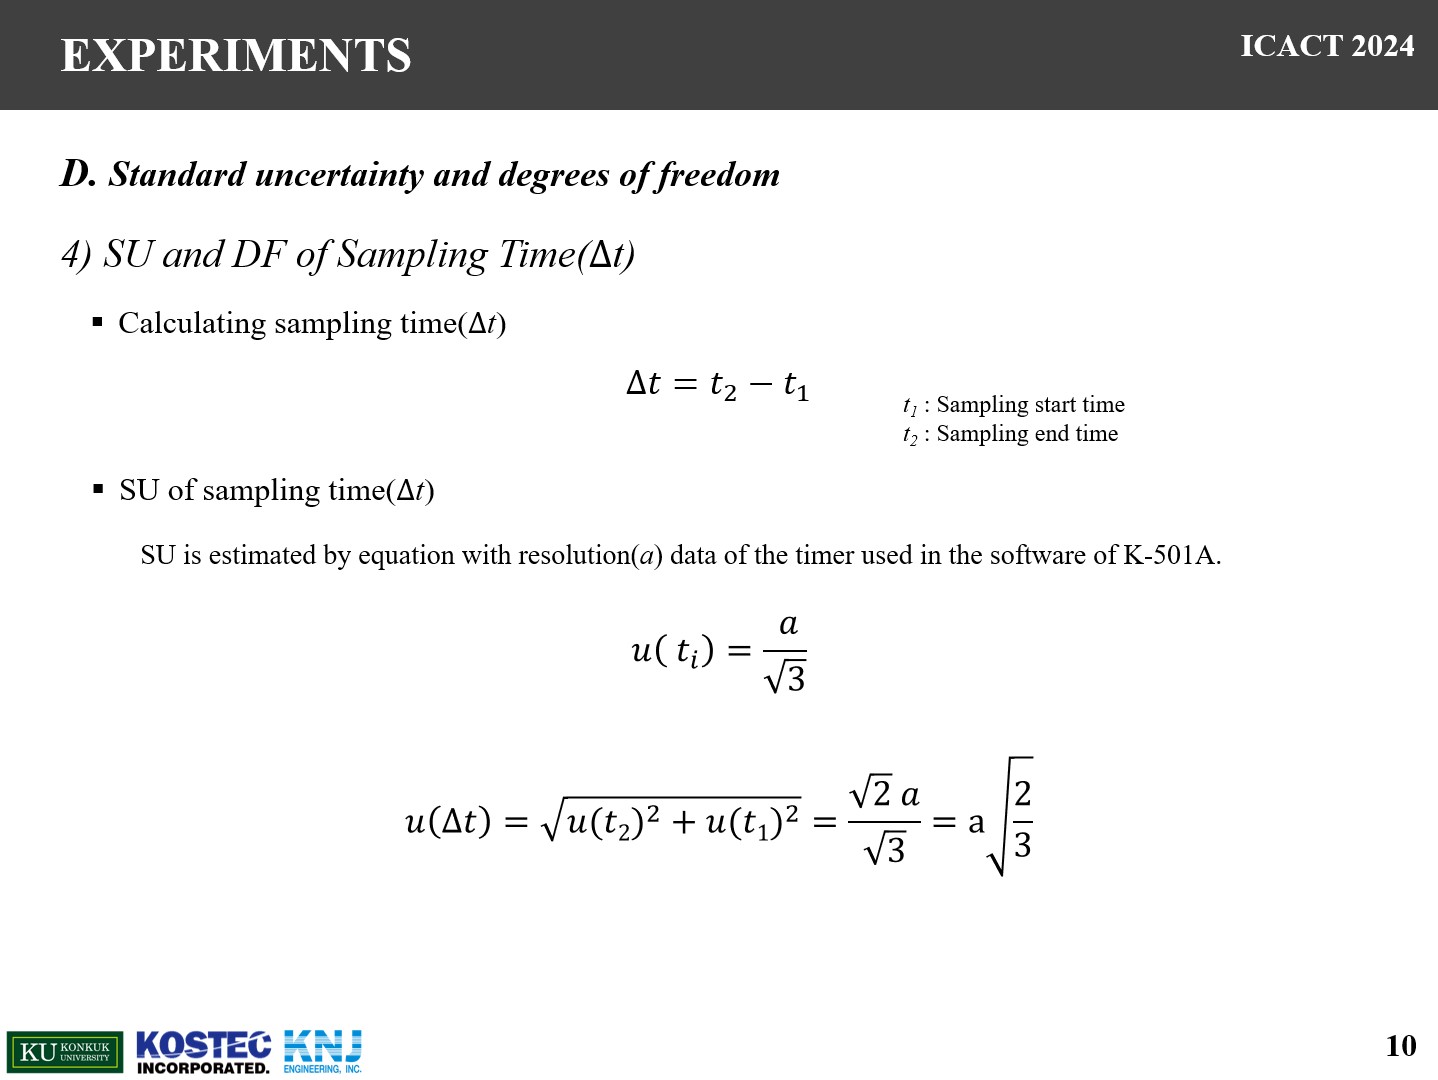 |
In the case of sampling time, the standard uncertainty is calculated by resolution data of the timer used in the software of K-501A.
Since Delta t is the time difference between the start and the end, the standard uncertainty of Delta t is calculated as follows.
|
| ICACT20240482 Slide.11
[Big Slide]
|
Chrome Click!! |
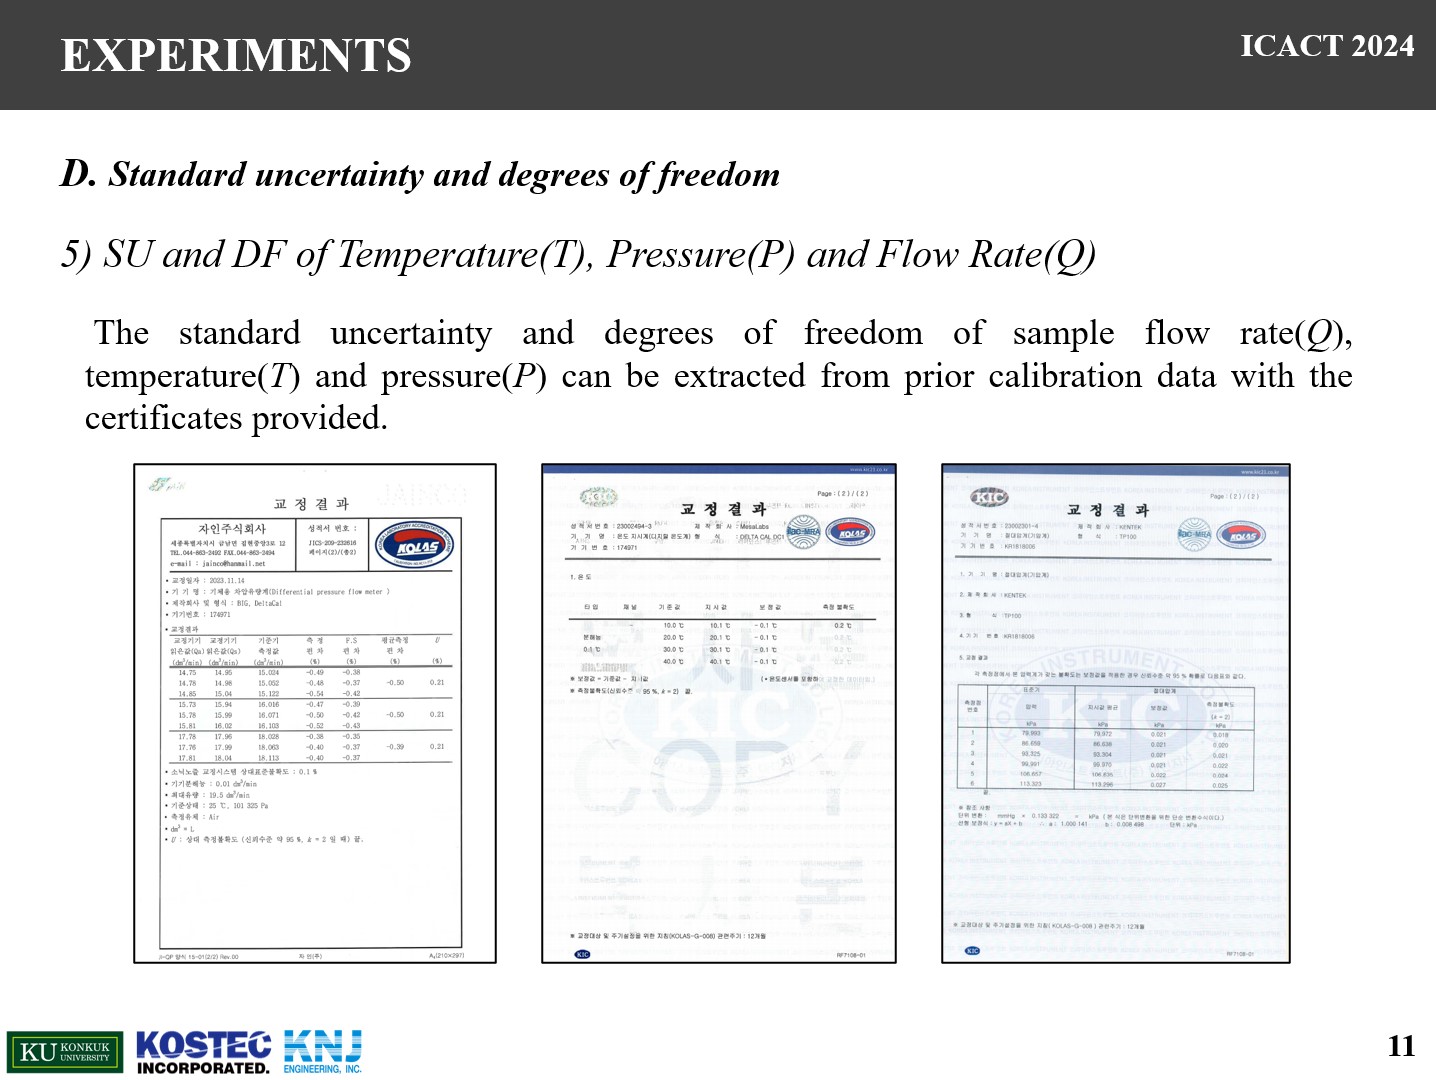 |
For the standard uncertainty and degrees of freedom of flow rate, temperature, and pressure, we used data from each calibration certificate.
|
| ICACT20240482 Slide.12
[Big Slide]
|
Chrome Click!! |
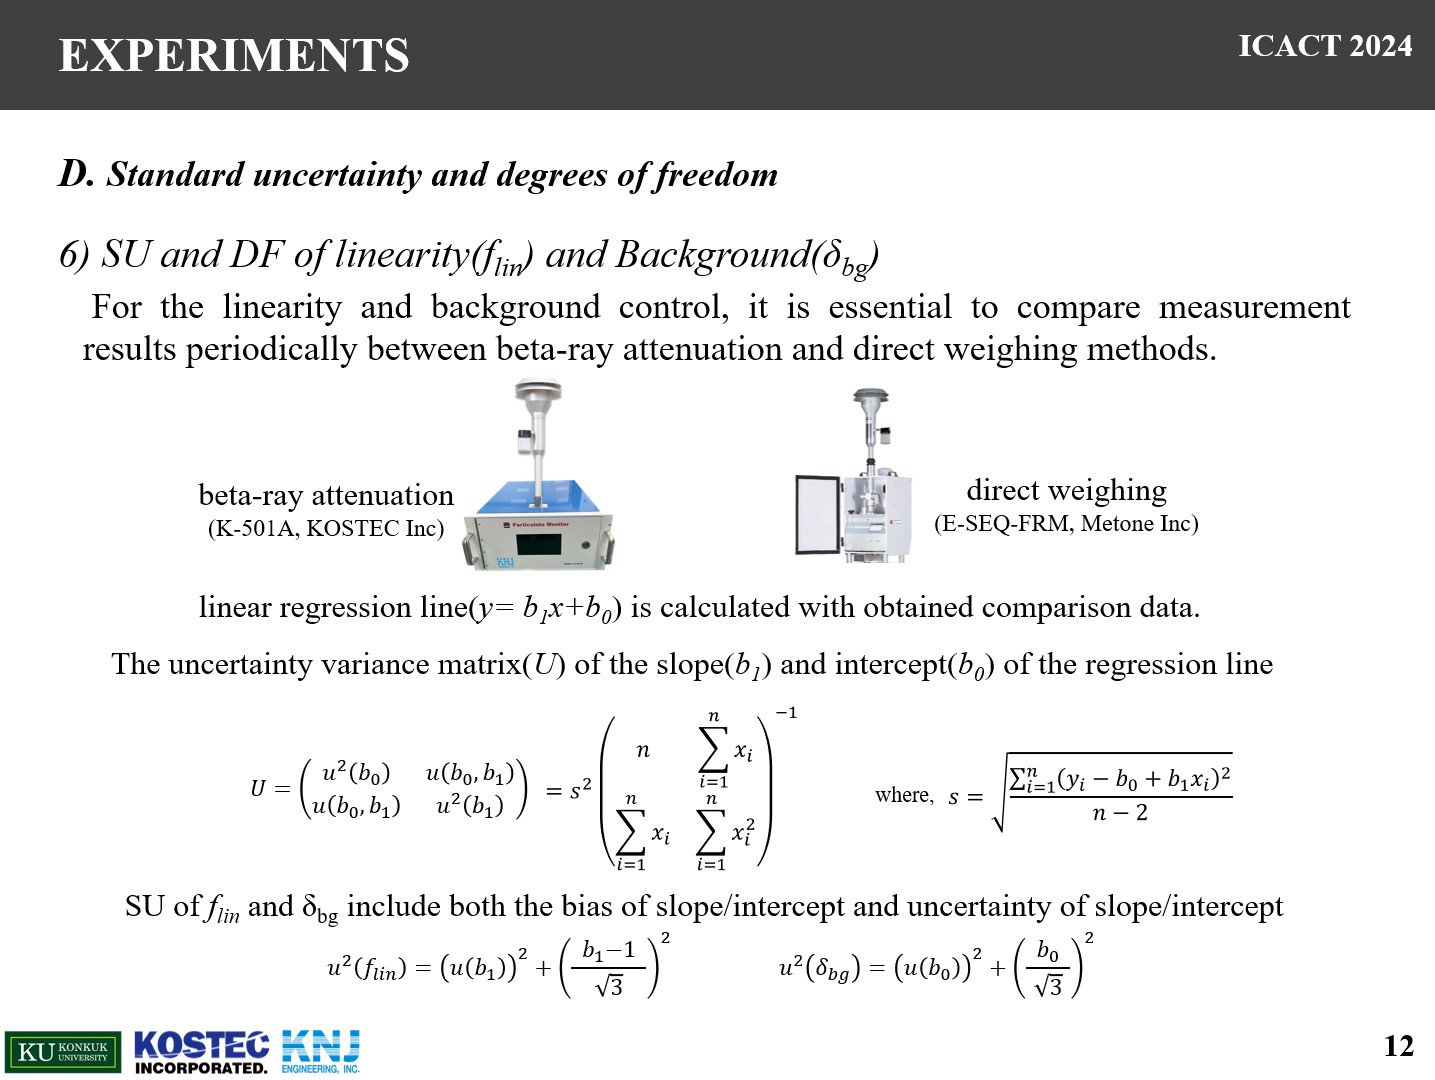 |
For the linearity and background control, it is essential to compare measurement results between beta-ray attenuation and direct weighing method.
This test, known as equivalence evaluation, is mandatory in Korea and is conducted once every two years.
In this study, to perform the equivalence evaluation, we compared measurements with an E-SEQ-FRM manual sampler using the direct weighing method.
We conducted experiments for more than two months and the 24-hour average data measured by two methods were compared.
To calculate standard uncertainty, at first, a linear regression line(y= b1x+b0) is calculated with obtained comparison data.
And the uncertainty variance matrix of the slope and intercept of the regression line is calculated as shown in Equation.
Since the standard uncertainty of linearity factor, includes both the bias of slope and uncertainty of slope, the final standard uncertainty of linearity factor can be calculated as below Equation.
The same goes for intercept.
|
| ICACT20240482 Slide.13
[Big Slide]
|
Chrome Click!! |
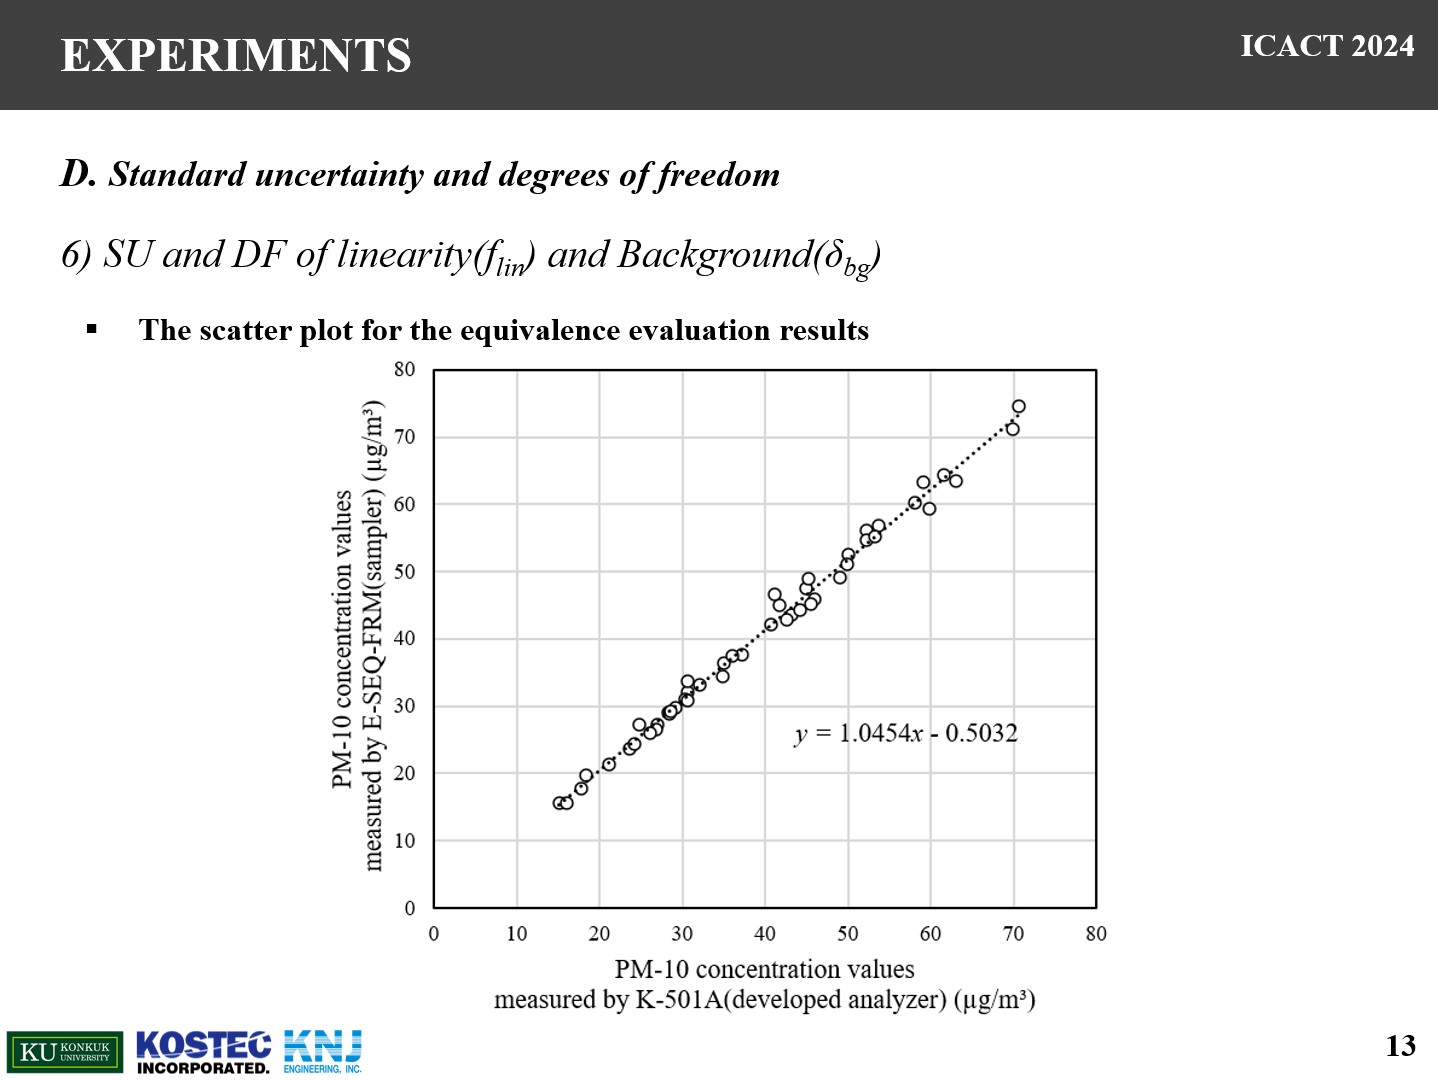 |
This is the result of the equivalence evaluation of this study.
The linear regression line was calculated as follows.
|
| ICACT20240482 Slide.14
[Big Slide]
|
Chrome Click!! |
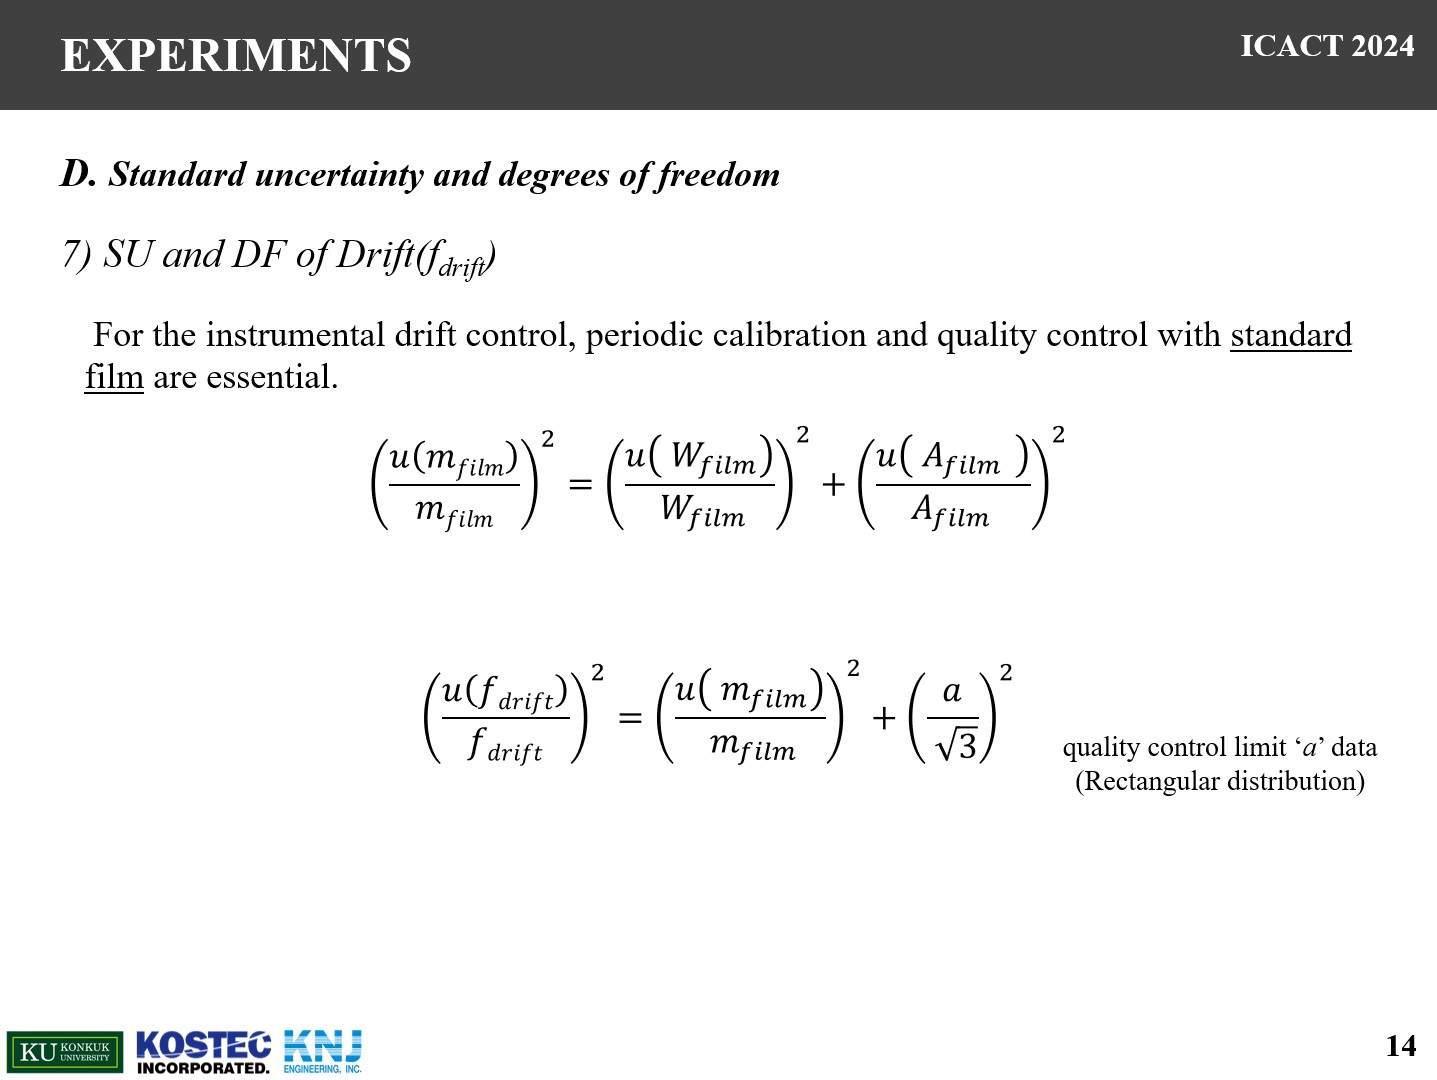 |
For the instrumental drift control, regular calibration and quality control with standard film are essential.
So, the standard uncertainty of drift can be calculated using the standard uncertainty of standard film and quality control limit data.
|
| ICACT20240482 Slide.15
[Big Slide]
|
Chrome Click!! |
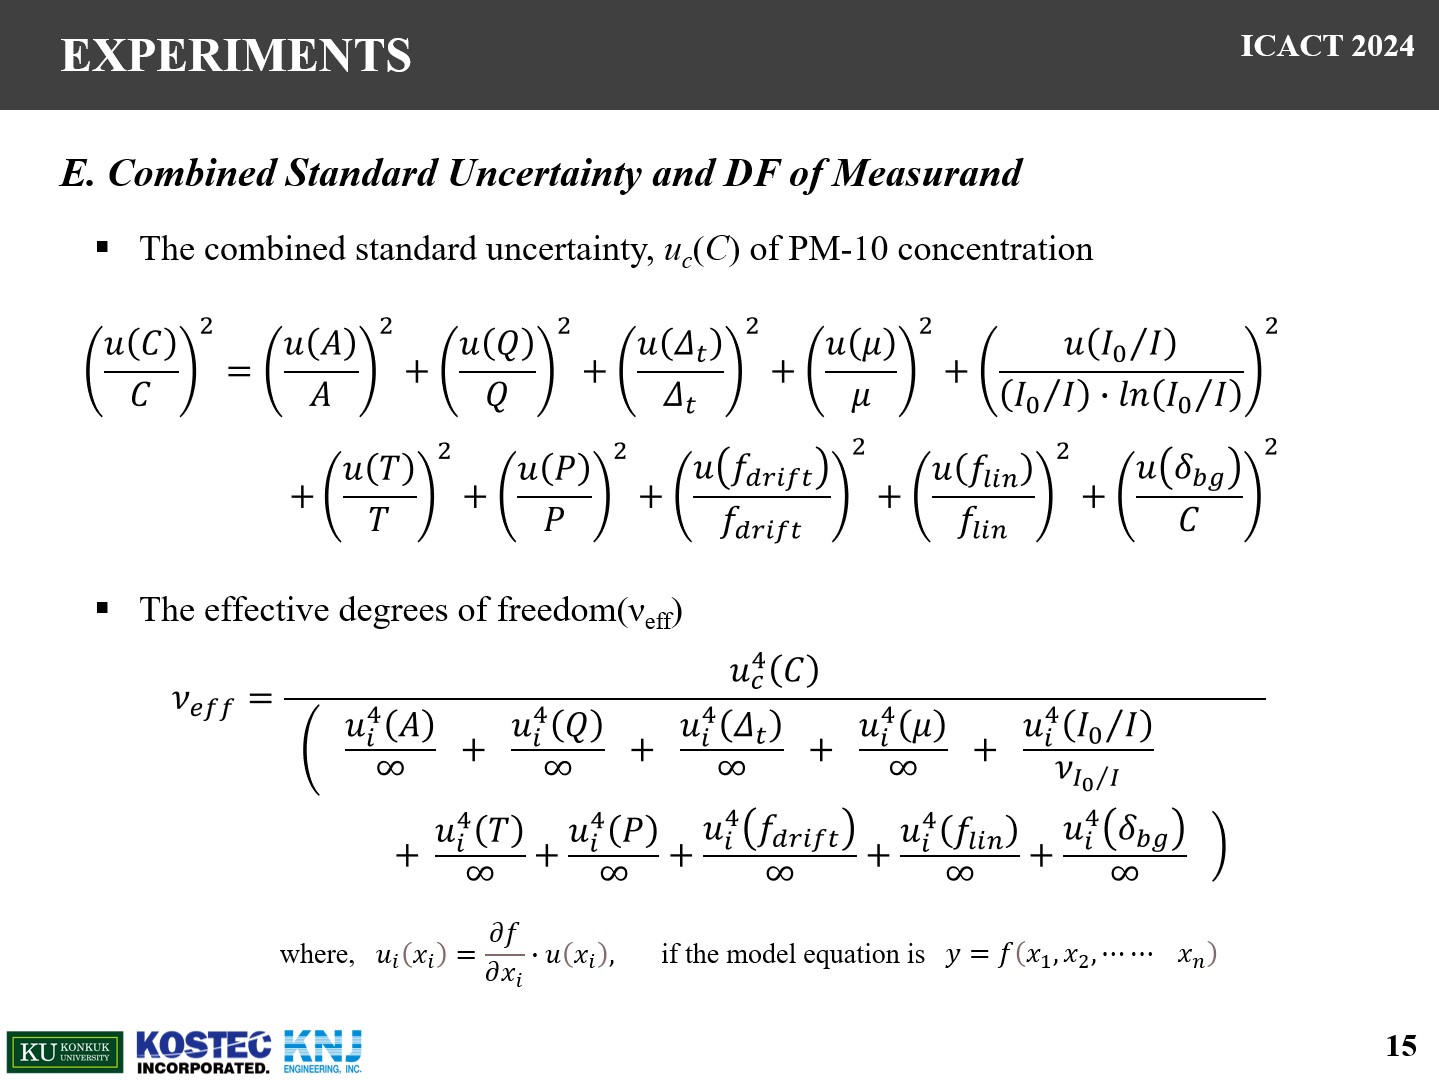 |
third step, calculation of combined standard uncertainty and effective degrees of freedom of measurand.
these are calculated as shown through the uncertainty propagation rule.
|
| ICACT20240482 Slide.16
[Big Slide]
|
Chrome Click!! |
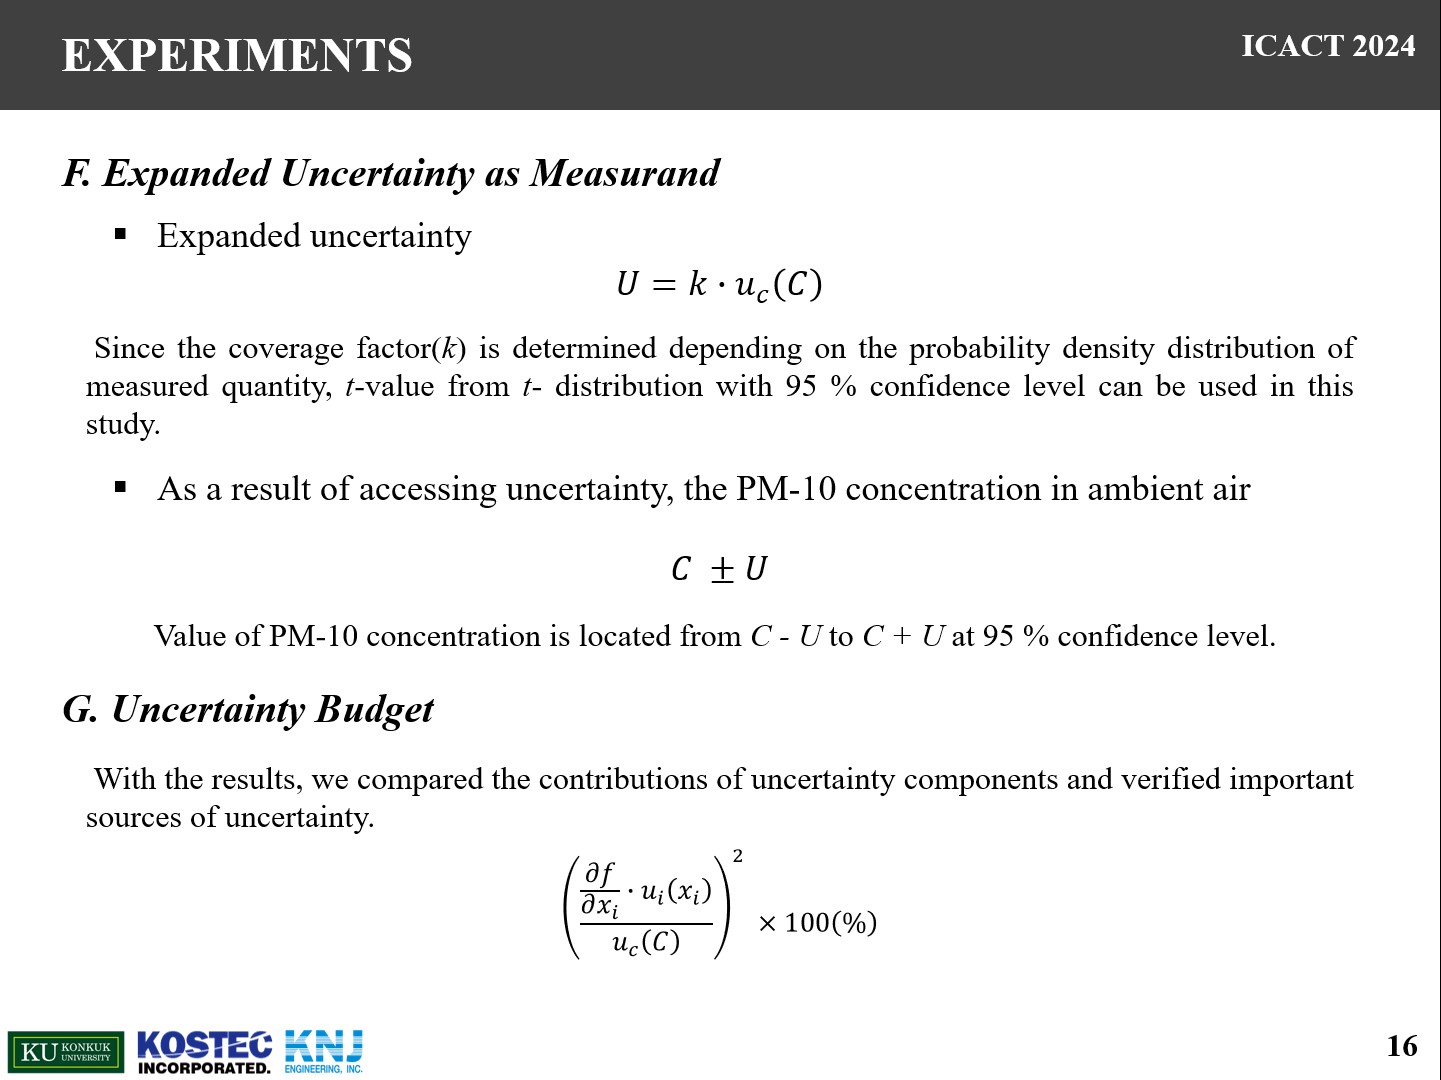 |
Final step, calculation of expanded uncertainty.
It calculated by multiplying the combined standard uncertainty to coverage factor k.
Since the coverage factor is determined depending on the probability density distribution of measured quantity, t-value from t- distribution with 95 % confidence level can be used in this study.
As a result, PM-10 concentration in ambient air can be expressed in a simple form “C±U”
Also, In this study, we calculated how much each uncertainty factor contributes to the uncertainty of the final measurement value.
we compared the contributions of uncertainty components and checked important sources of uncertainty.
|
| ICACT20240482 Slide.17
[Big Slide]
|
Chrome Click!! |
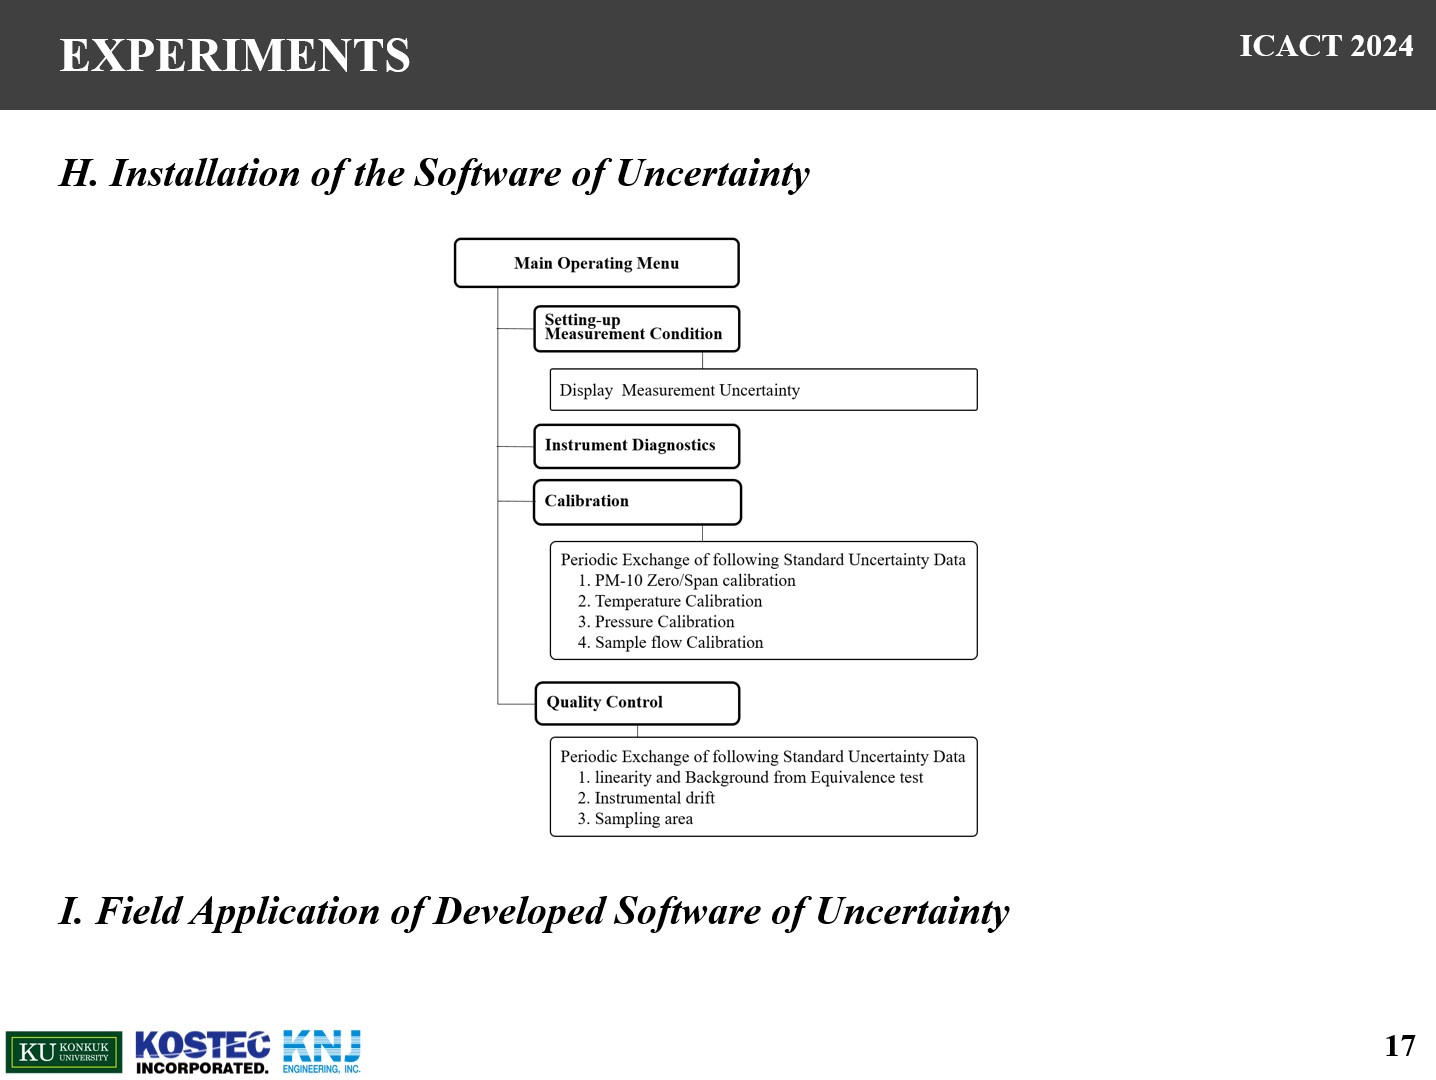 |
We installed and implemented software to enable the calculation of uncertainties, following the procedures outlined in this study.
|
| ICACT20240482 Slide.18
[Big Slide]
|
Chrome Click!! |
 |
results
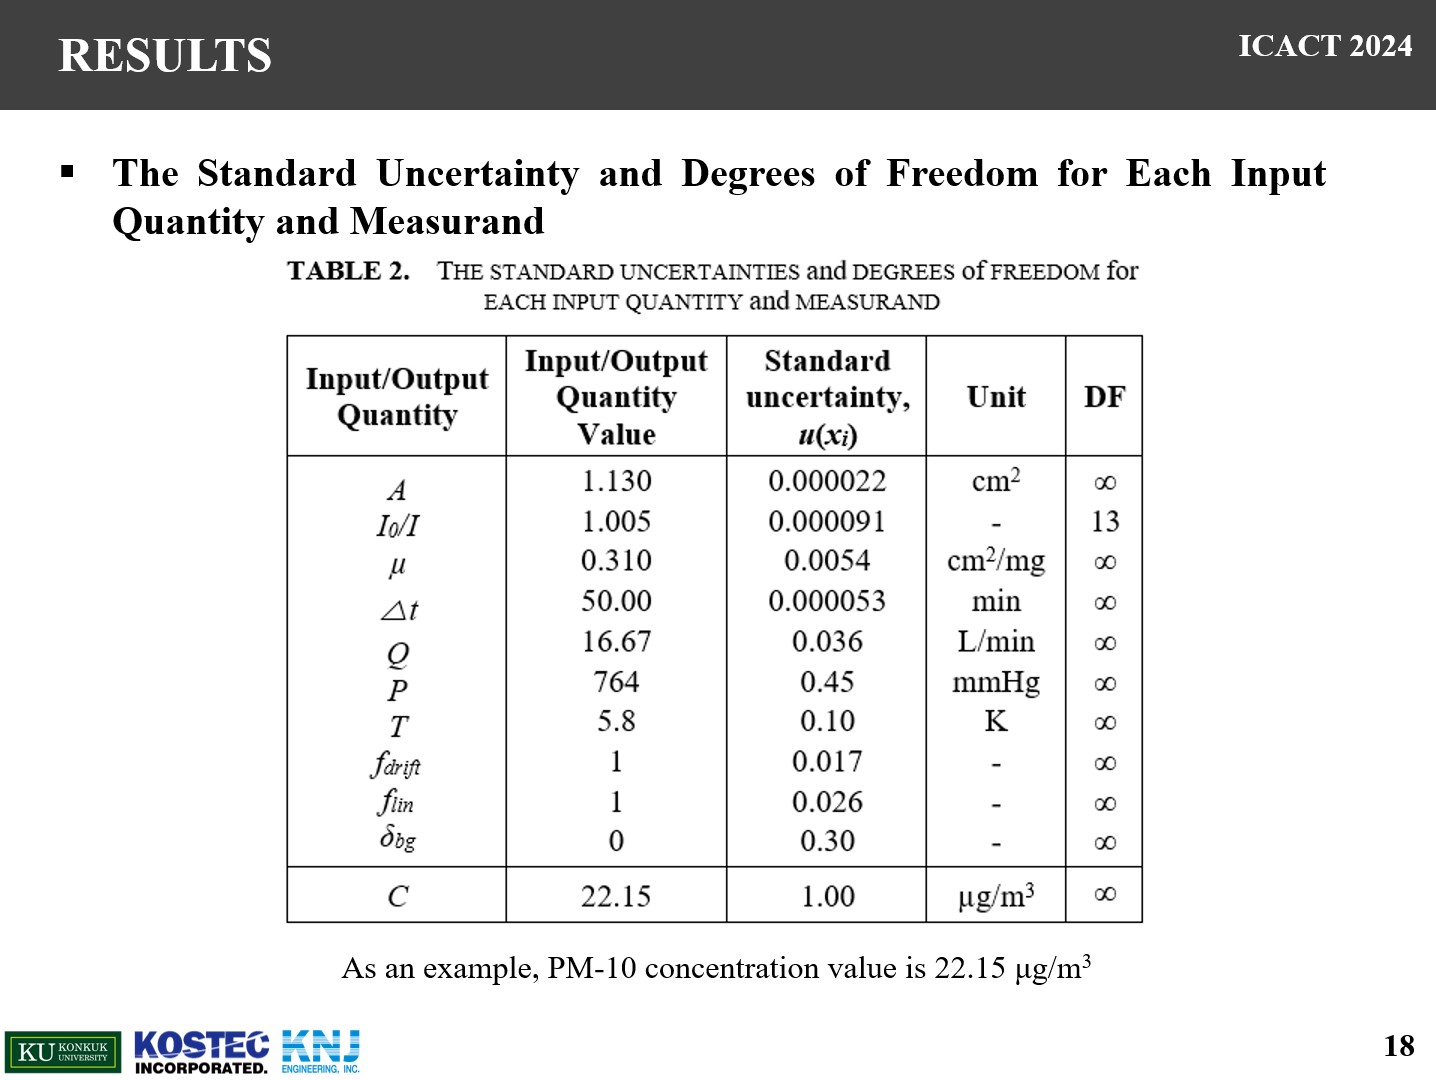
We obtained PM-10 concentration data and uncertainty values during the experimental period.
Here, as an example, we present detailed results only on a PM-10 concentration value, 22.15 μg/m3 obtained once at the field application of measurement and onsite evaluation of uncertainty.
|
| ICACT20240482 Slide.19
[Big Slide]
|
Chrome Click!! |
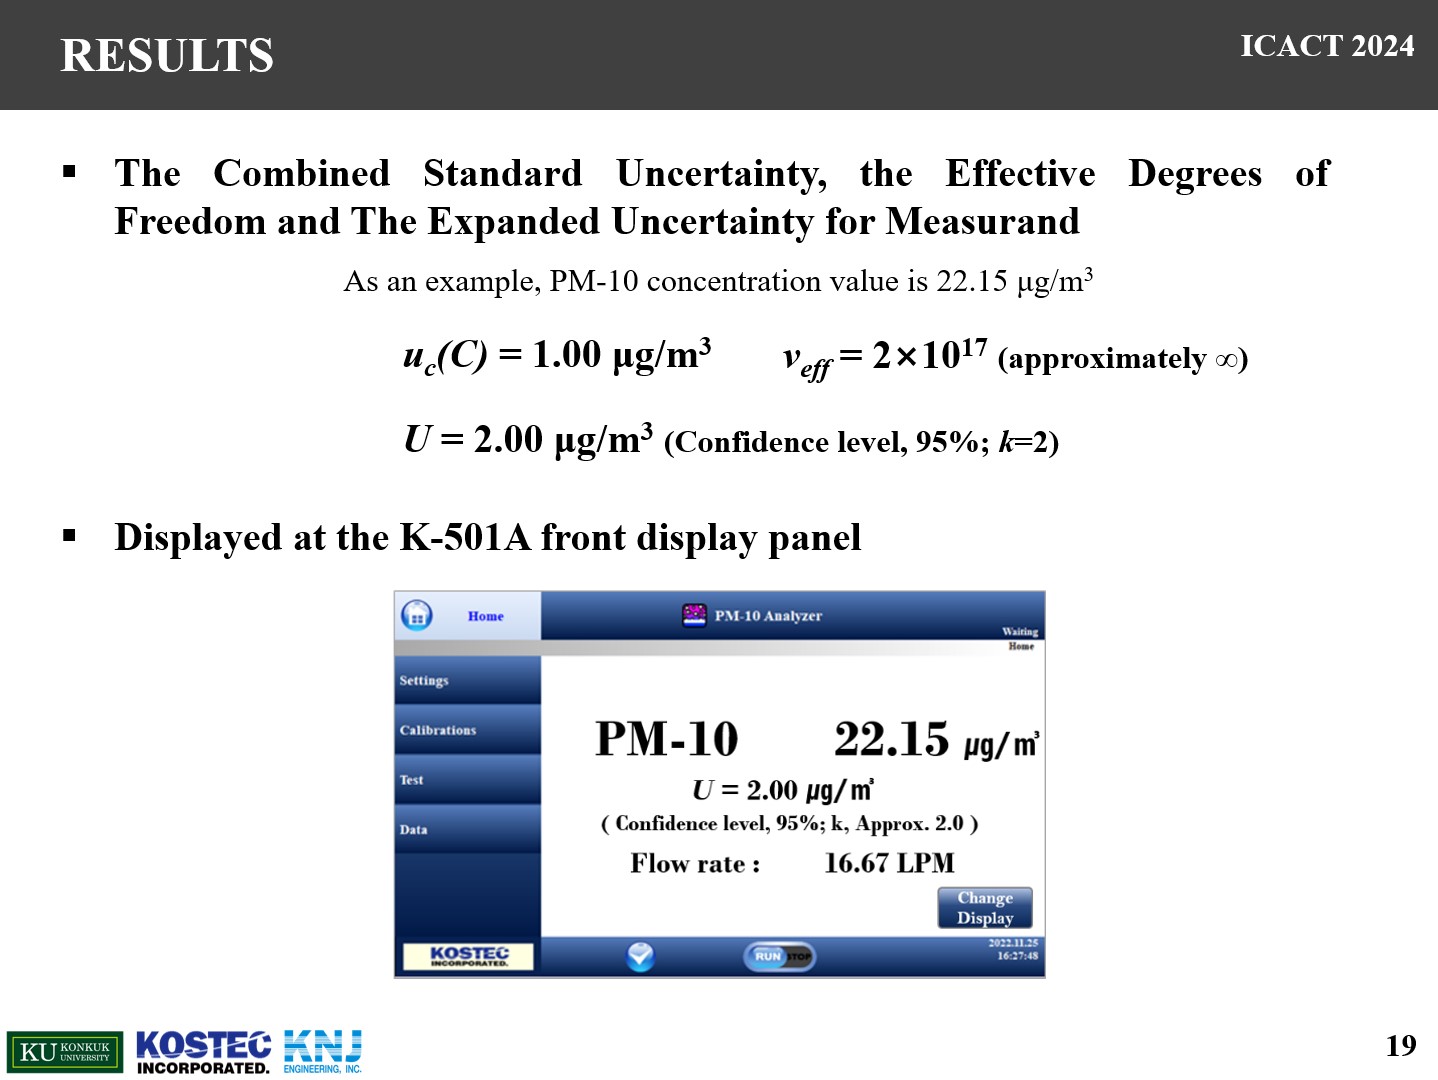 |
The combined standard uncertainty and effective degrees of freedom were calculated as follows.
The effective degrees of freedom appeared to be nearly infinite.
The expanded uncertainty was calculated 2 μg/m³.
In the end, each result is displayed on the screen of the instrument.
|
| ICACT20240482 Slide.20
[Big Slide]
|
Chrome Click!! |
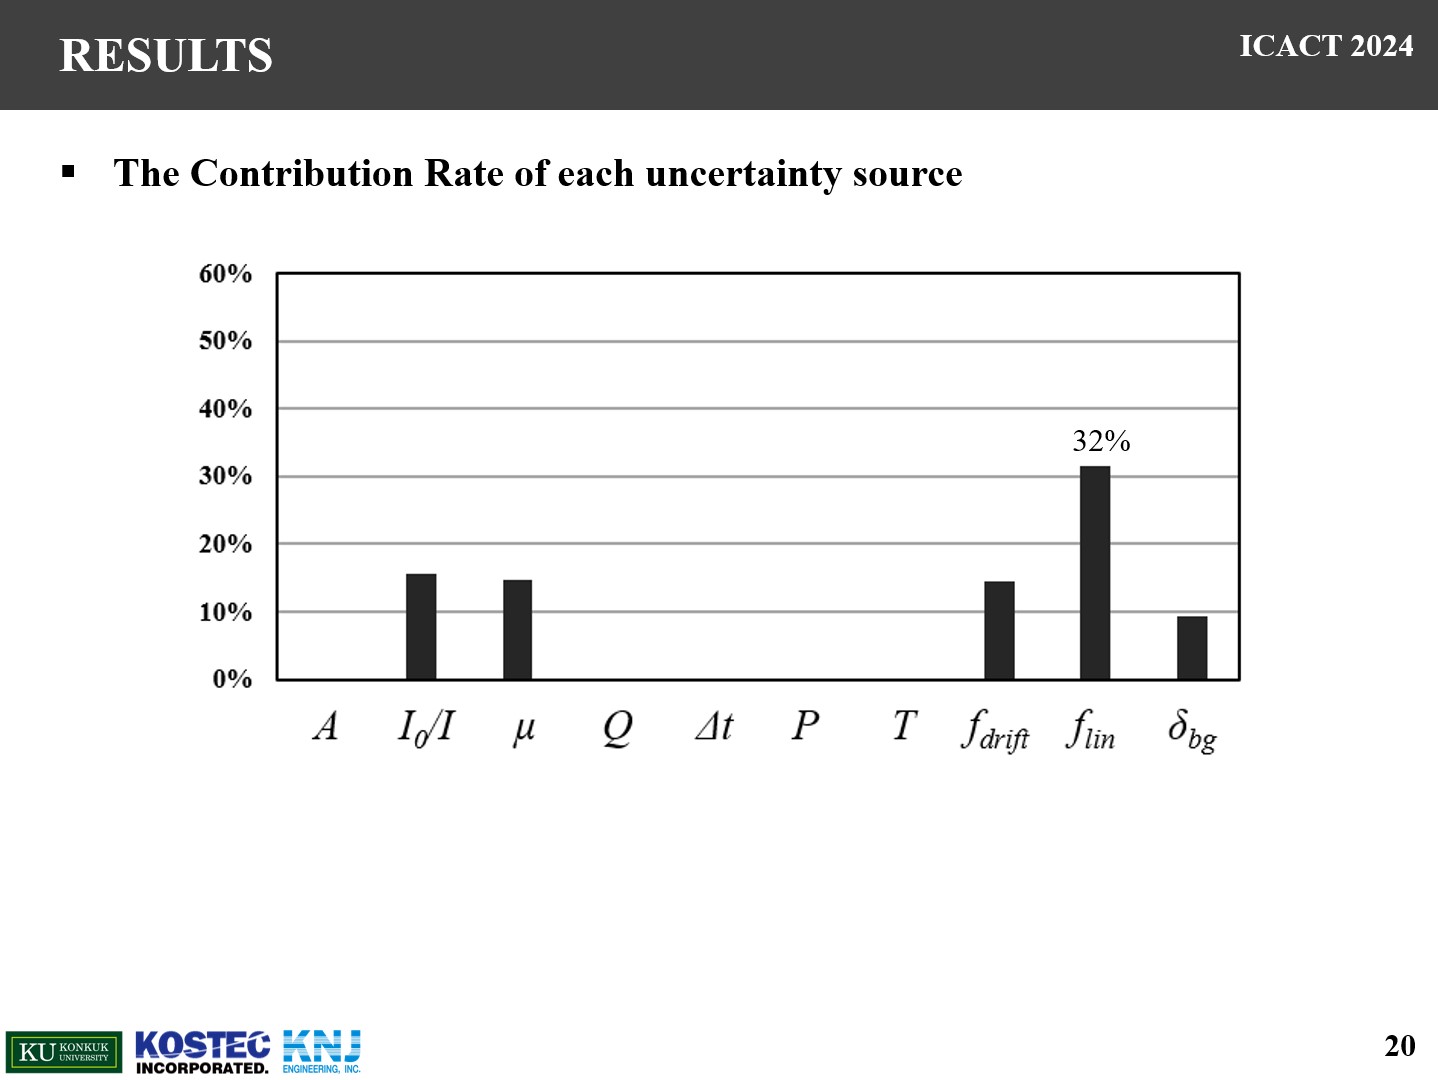 |
We compared the contribution rate of each uncertainty source, and the highest contribution is the uncertainty of linearity, accounting for as much as 32%.
|
| ICACT20240482 Slide.21
[Big Slide]
|
Chrome Click!! |
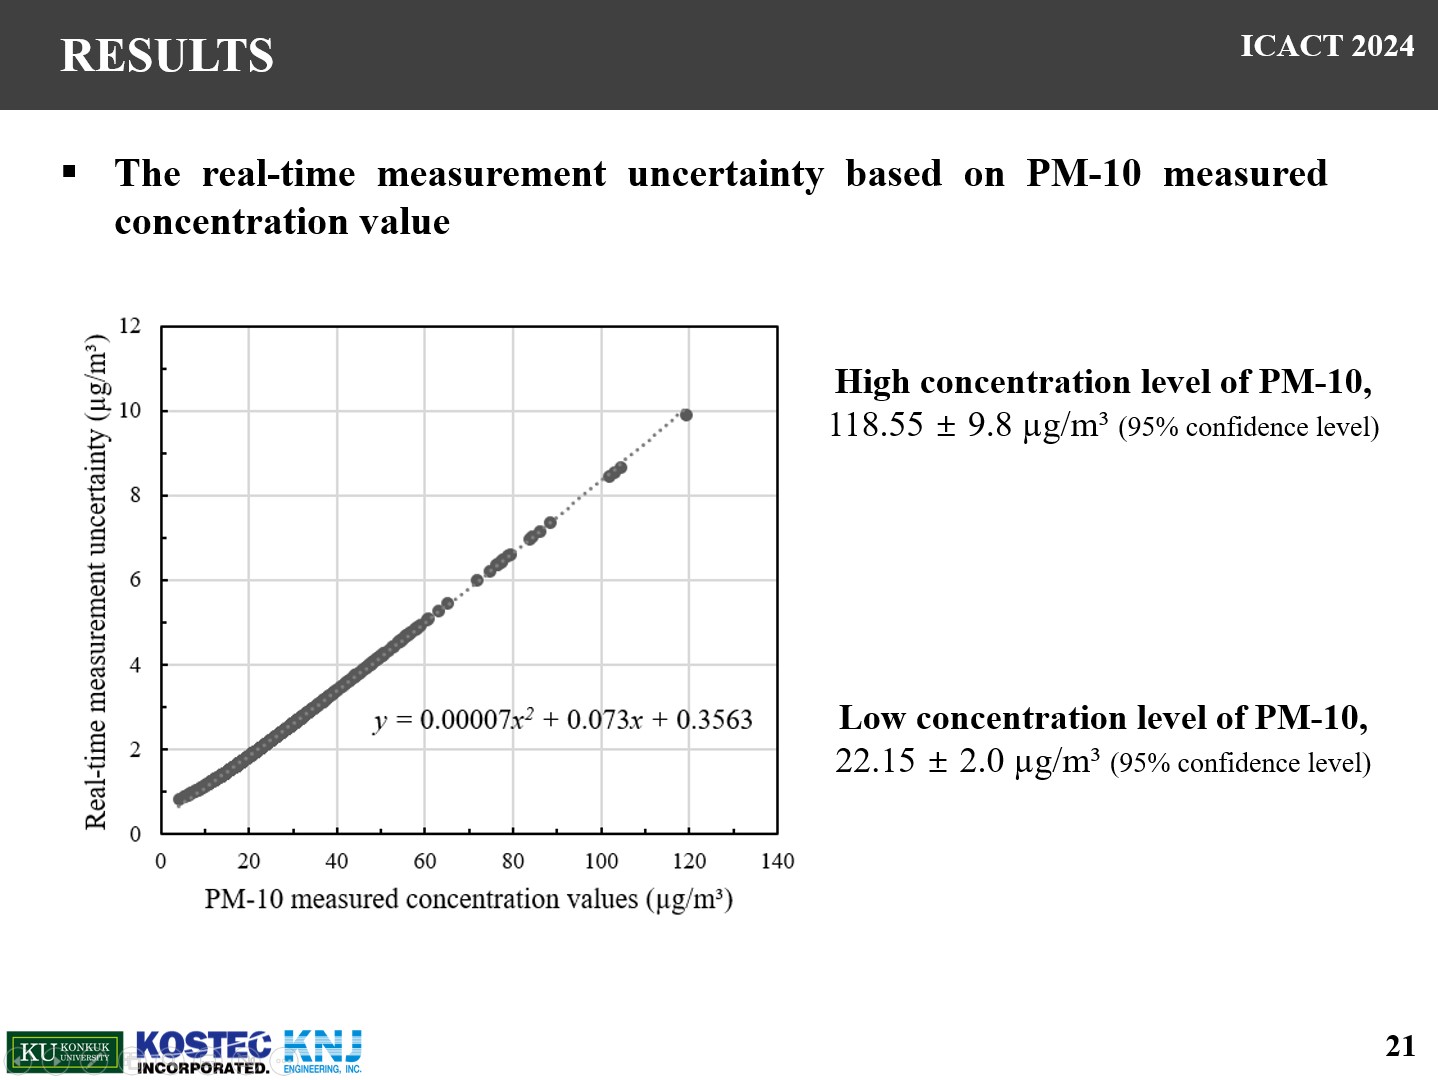 |
Finally, we calculated real-time measurement uncertainties for all concentration values during the month of November, and the results are depicted in the figure below.
As the PM concentration increased, the expanded uncertainty also increased.
Based on the results, the regression equation of the expanded uncertainty(y) versus PM-10 concentration(x) was formulated as shown in Equation.
The data was well fitted with a second-order regression line. |
| ICACT20240482 Slide.22
[Big Slide]
|
Chrome Click!! |
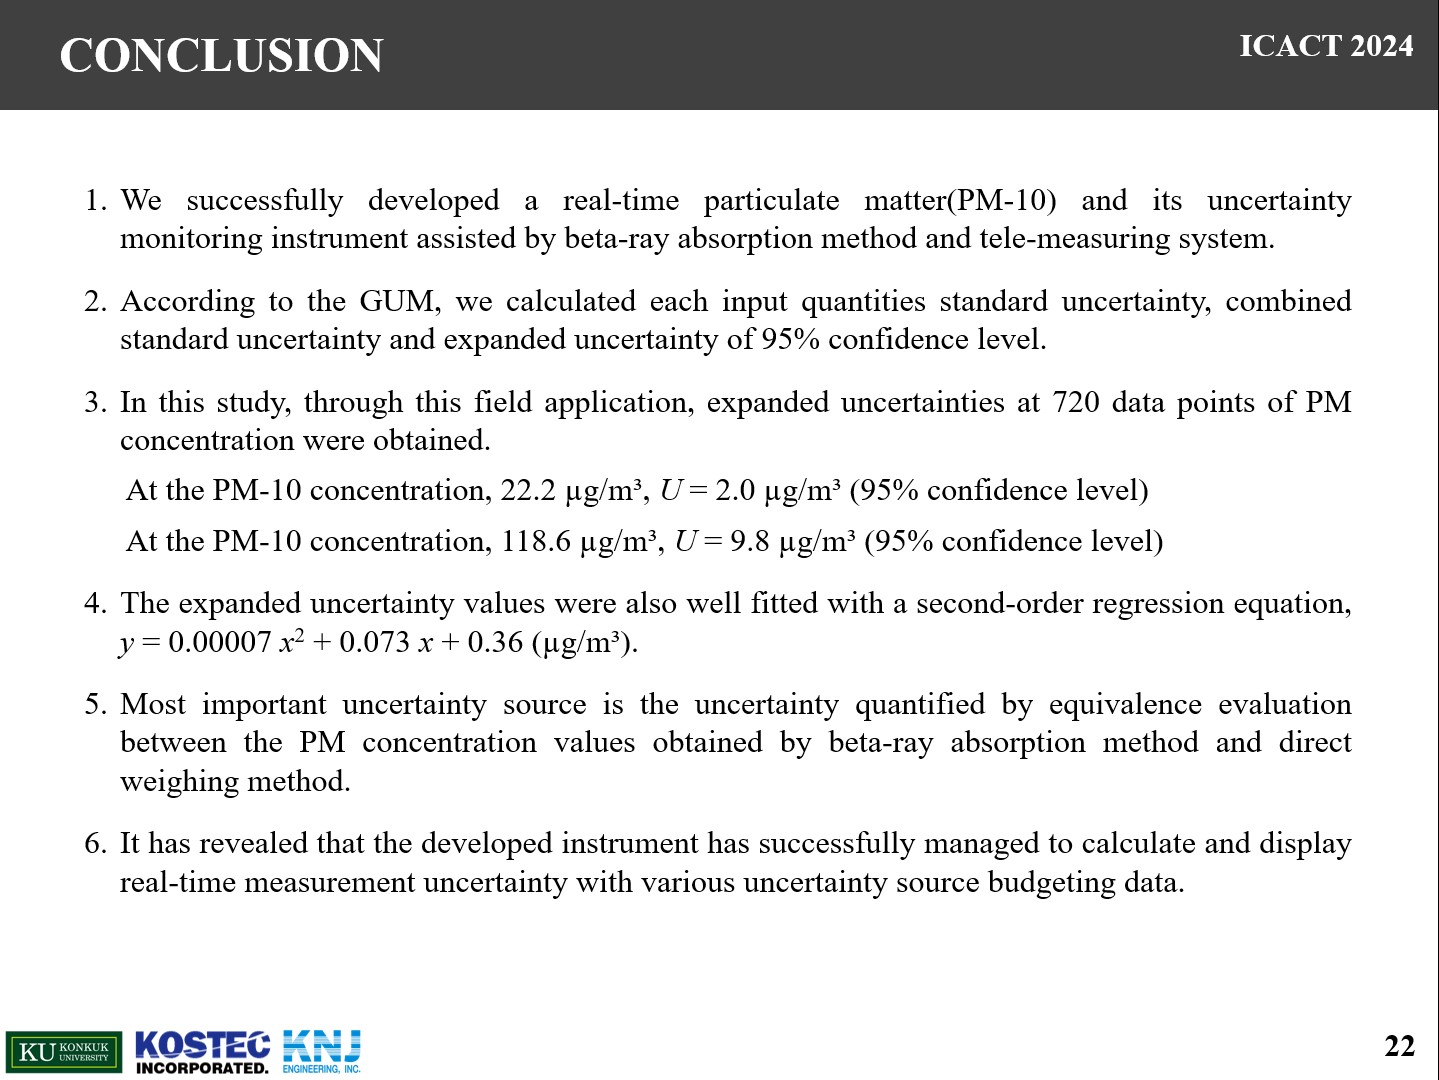 |
conclusion,
1. We successfully developed a real-time particulate matter(PM-10) and its uncertainty monitoring instrument.
2. According to the GUM, we calculated each input quantities standard uncertainty, combined standard uncertainty and expanded uncertainty.
3. In this study, through this field application, expanded uncertainties at 720 data were obtained.
4. The expanded uncertainty values were also well fitted with a second-order regression equation.
5.Most important uncertainty source is the uncertainty quantified by equivalence evaluation.
6.The developed instrument has successfully managed to calculate and display real-time measurement uncertainty with various uncertainty source. |
| ICACT20240482 Slide.23
[Big Slide]
|
Chrome Click!! |
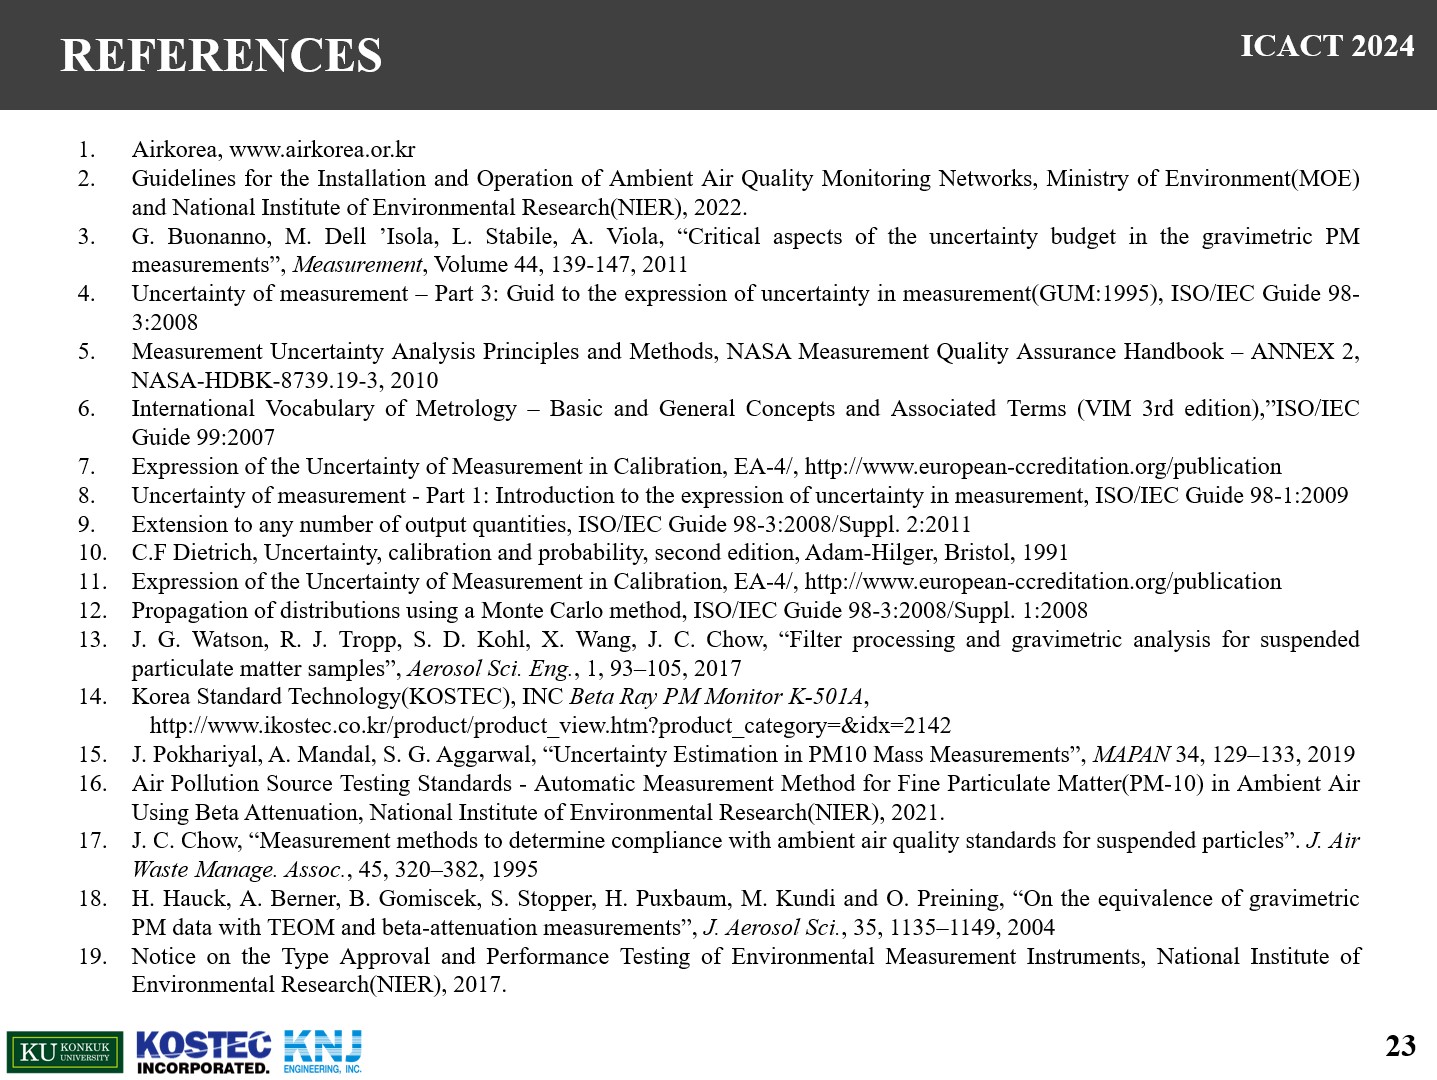 |
These are the references we have used. |
| ICACT20240482 Slide.24
[Big Slide]
|
Chrome Click!! |
 |
Thank you for your attention. |















