 ICACT20250064 Slide.01
[Big Slide] |
Chrome  Click!! |
 |
This is Hyun Kim, Department of electronic engineering, Semyung University.
I Will presents "Edge-IoT Architecture-Based Visualization Service Platform for RTO Real-Time Monitoring"
|
| ICACT20250064 Slide.02
[Big Slide]
|
Chrome Click!! |
 |
Presentation contents is as follows |
| ICACT20250064 Slide.03
[Big Slide]
|
Chrome Click!! |
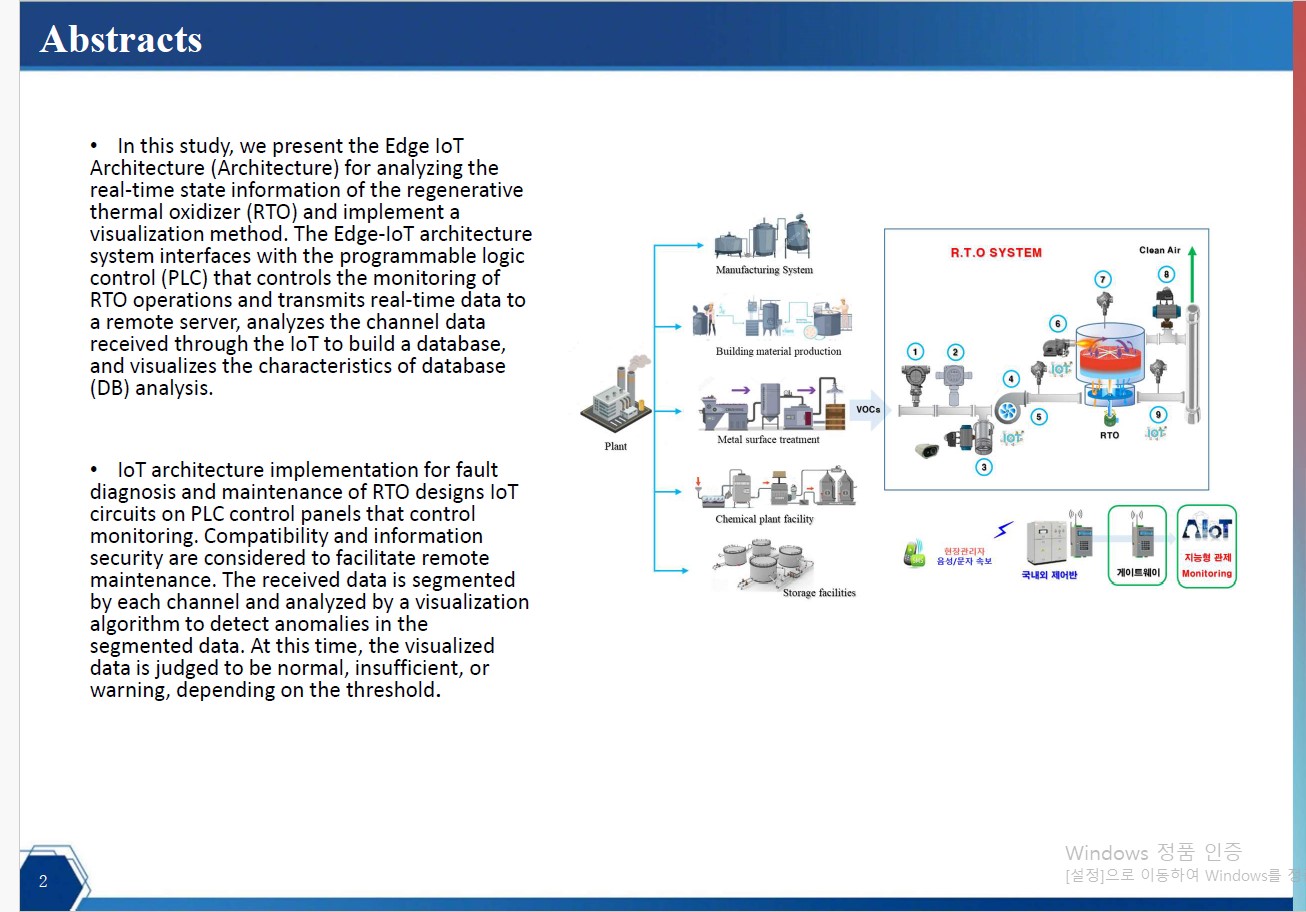 |
In this study, we present the Edge IoT Architecture (Architecture) for analyzing the real-time state information of the regenerative thermal oxidizer (RTO) and implement a visualization method. The Edge-IoT architecture system interfaces with the programmable logic control (PLC) that controls the monitoring of RTO operations and transmits real-time data to a remote server, analyzes the channel data received through the IoT to build a database, and visualizes the characteristics of database (DB) analysis.IoT architecture implementation for fault diagnosis and maintenance of RTO designs IoT circuits on PLC control panels that control monitoring. Compatibility and information security are considered to facilitate remote maintenance. The received data is segmented by each channel and analyzed by a visualization algorithm to detect anomalies in the segmented data. At this time, the visualized data is judged to be normal, insufficient, or warning, depending on the threshold.
|
| ICACT20250064 Slide.04
[Big Slide]
|
Chrome Click!! |
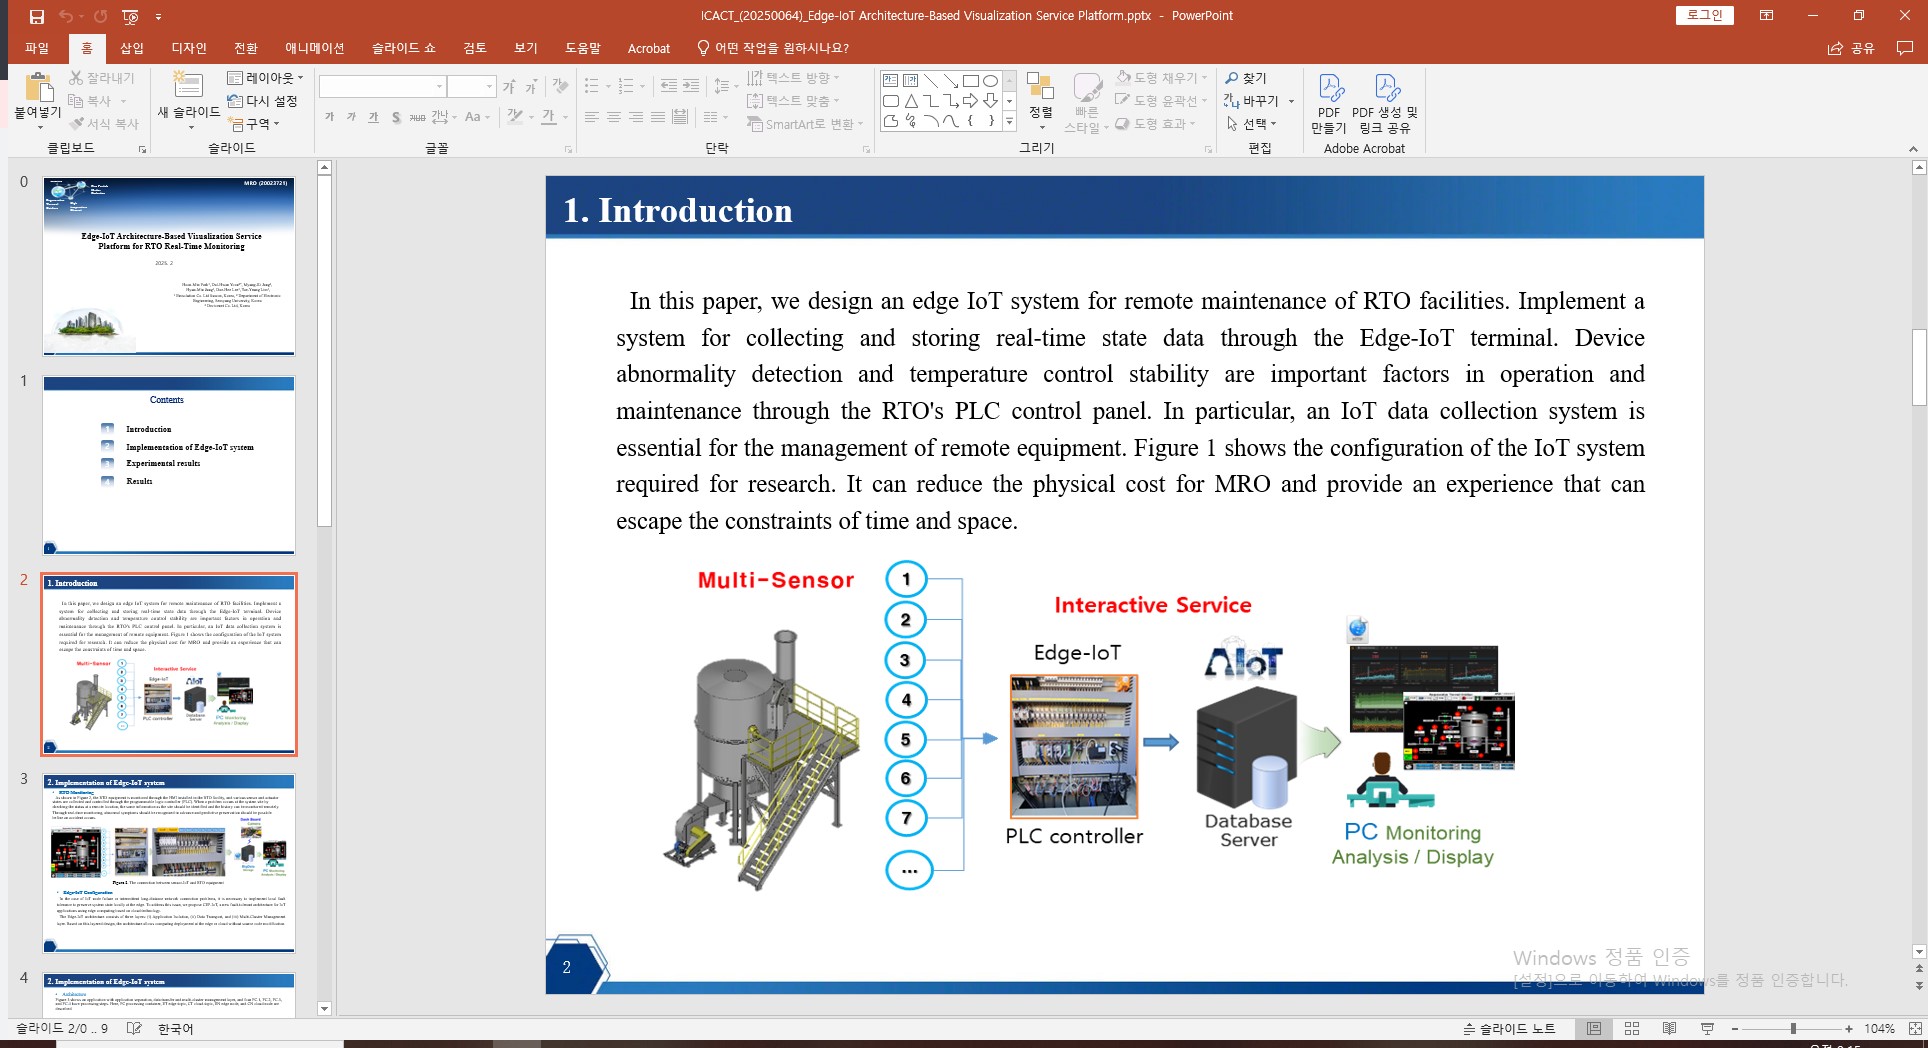 |
In this paper, we design an edge IoT system for remote maintenance of RTO facilities. Implement a system for collecting and storing real-time state data through the Edge-IoT terminal. Device abnormality detection and temperature control stability are important factors in operation and maintenance through the RTO's PLC control panel. In particular, an IoT data collection system is essential for the management of remote equipment. Figure 1 shows the configuration of the IoT system required for research. It can reduce the physical cost for MRO and provide an experience that can escape the constraints of time and space.
|
| ICACT20250064 Slide.05
[Big Slide]
|
Chrome Click!! |
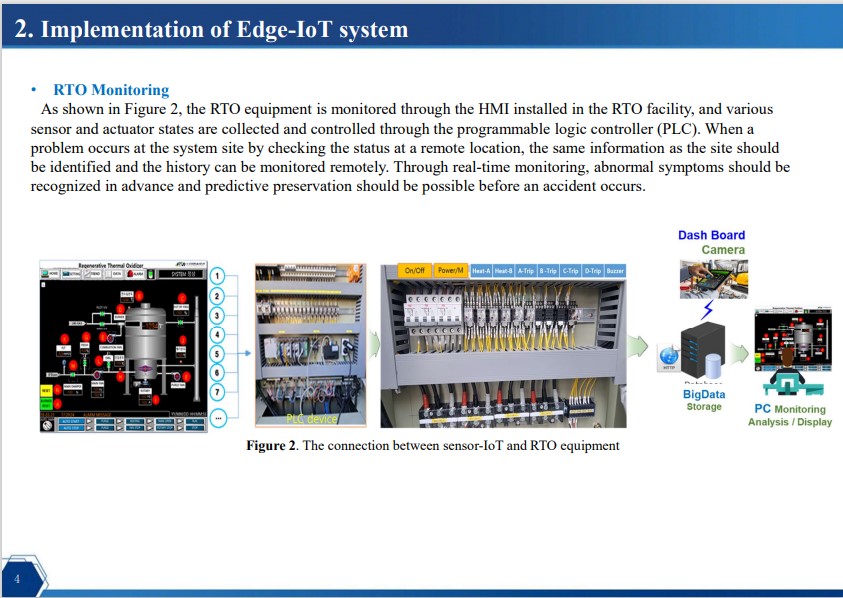 |
As shown in Figure 2, the RTO equipment is monitored through the HMI installed in the RTO facility, and various sensor and actuator states are collected and controlled through the programmable logic controller (PLC). When a problem occurs at the system site by checking the status at a remote location, the same information as the site should be identified and the history can be monitored remotely. Through real-time monitoring, abnormal symptoms should be recognized in advance and predictive preservation should be possible before an accident occurs.
|
| ICACT20250064 Slide.06
[Big Slide]
|
Chrome Click!! |
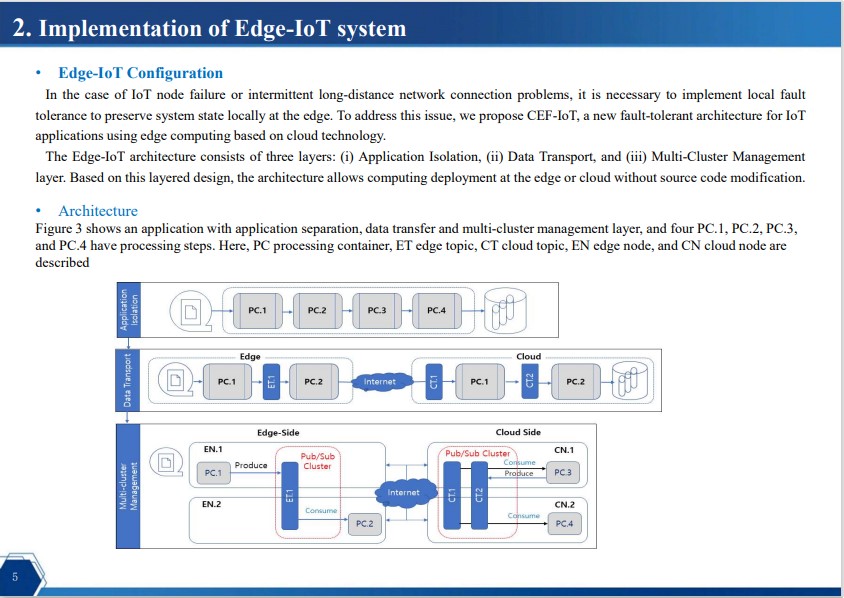 |
In the case of IoT node failure or intermittent long-distance network connection problems, it is necessary to implement local fault tolerance to preserve system state locally at the edge. To address this issue, we propose CEF-IoT, a new fault-tolerant architecture for IoT applications using edge computing based on cloud technology. The Edge-IoT architecture consists of three layers: (i) Application Isolation, (ii) Data Transport, and (iii) Multi-Cluster Management layer. Based on this layered design, the architecture allows computing deployment at the edge or cloud without source code modification. Figure 3 shows an application with application separation, data transfer and multi-cluster management layer, and four PC.1, PC.2, PC.3, and PC.4 have processing steps. Here, PC processing container, ET edge topic, CT cloud topic, EN edge node, and CN cloud node are described
|
| ICACT20250064 Slide.07
[Big Slide]
|
Chrome Click!! |
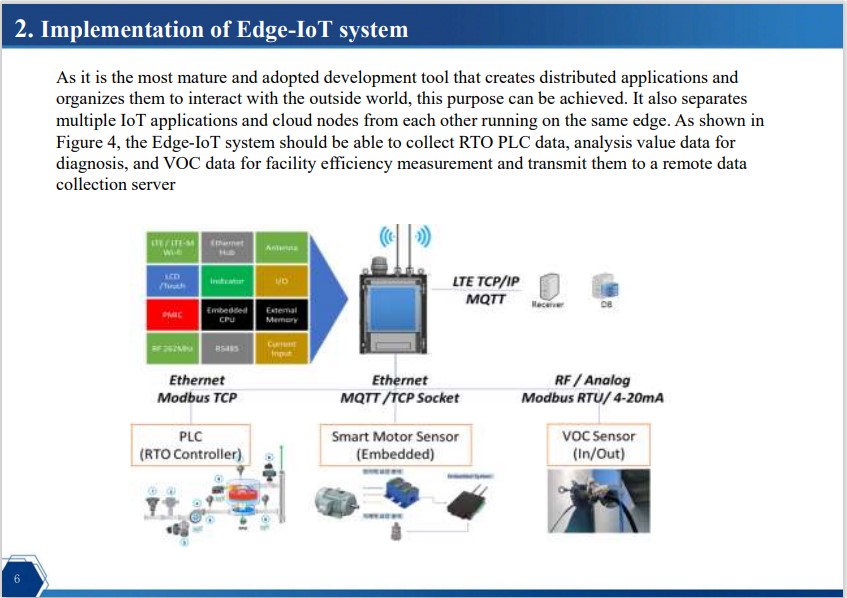 |
As it is the most mature and adopted development tool that creates distributed applications and organizes them to interact with the outside world, this purpose can be achieved. It also separates multiple IoT applications and cloud nodes from each other running on the same edge. As shown in Figure 4, the Edge-IoT system should be able to collect RTO PLC data, analysis value data for diagnosis, and VOC data for facility efficiency measurement and transmit them to a remote data collection server
|
| ICACT20250064 Slide.08
[Big Slide]
|
Chrome Click!! |
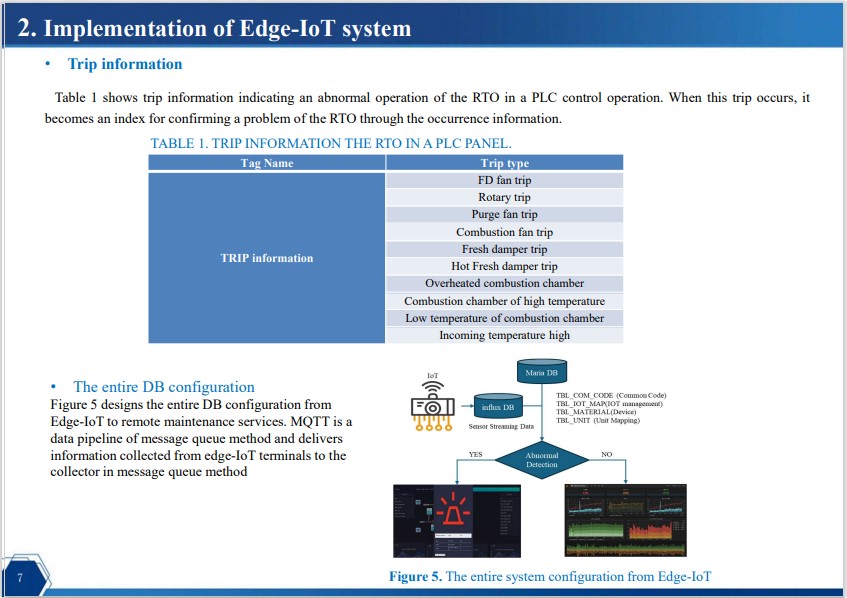 |
Figure 6 shows the data dashboard collected from the edge IoT. It shows visualization information for providing analyzed data to field workers or managers. When a menu bar is selected at the top of the figure, heat, amount of gas, temperature change, etc. appear according to the selection items, and printing and mail transmission are made to provide the analyzed data[6].
|
| ICACT20250064 Slide.09
[Big Slide]
|
Chrome Click!! |
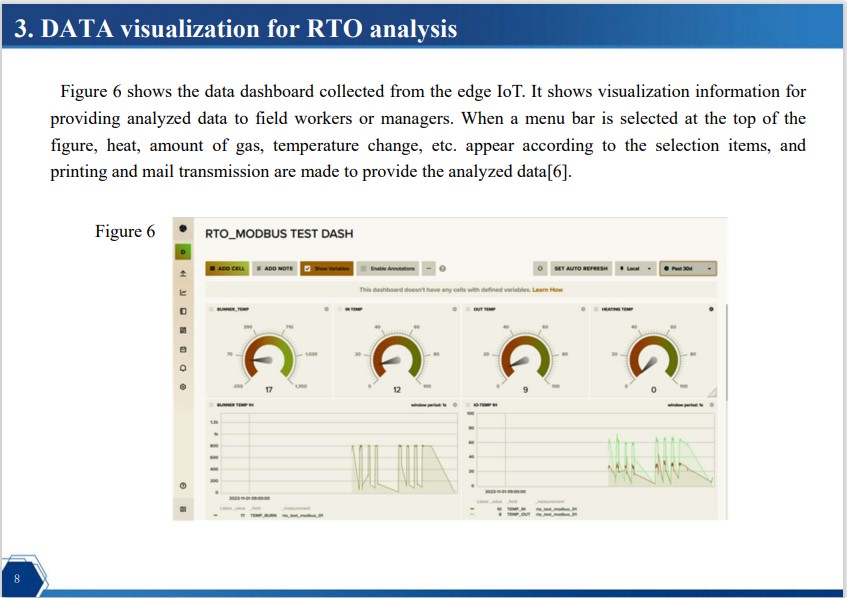 |
Figure 6 shows the data dashboard collected from the edge IoT. It shows visualization information for providing analyzed data to field workers or managers. When a menu bar is selected at the top of the figure, heat, amount of gas, temperature change, etc. appear according to the selection items, and printing and mail transmission are made to provide the analyzed data[6].
|
| ICACT20250064 Slide.10
[Big Slide]
|
Chrome Click!! |
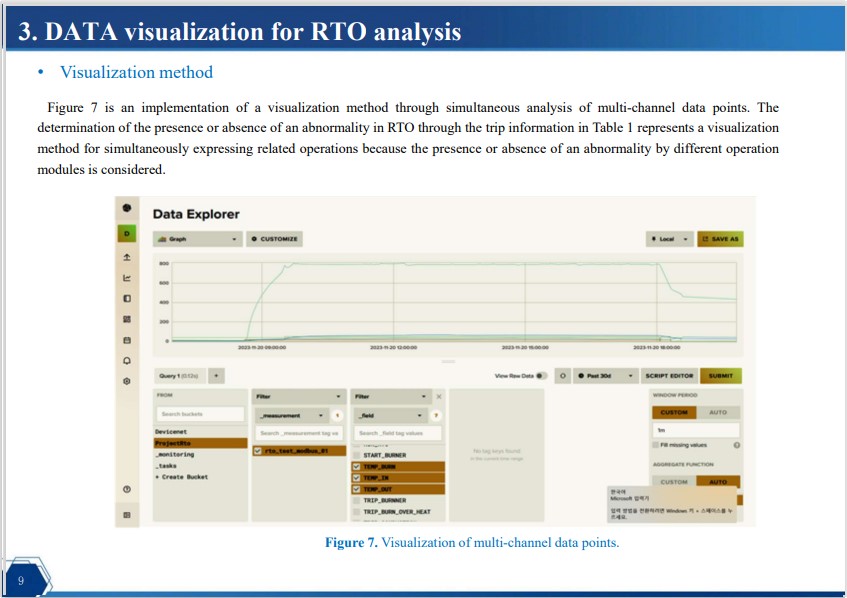 |
Figure 7 is an implementation of a visualization method through simultaneous analysis of multi-channel data points. The determination of the presence or absence of an abnormality in RTO through the trip information in Table 1 represents a visualization method for simultaneously expressing related operations because the presence or absence of an abnormality by different operation modules is considered.
|
| ICACT20250064 Slide.11
[Big Slide]
|
Chrome Click!! |
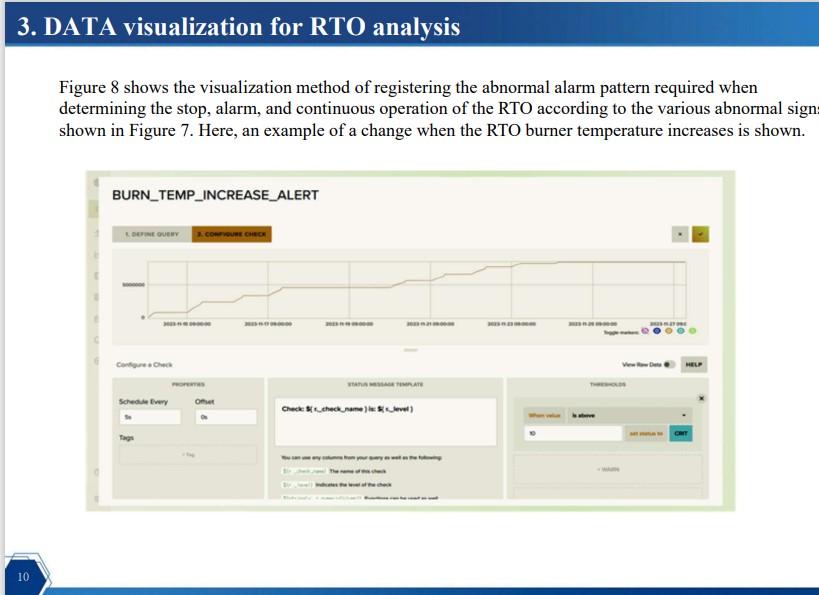 |
Figure 8 shows the visualization method of registering the abnormal alarm pattern required when determining the stop, alarm, and continuous operation of the RTO according to the various abnormal signs shown in Figure 7. Here, an example of a change when the RTO burner temperature increases is shown.
|
| ICACT20250064 Slide.12
[Big Slide]
|
Chrome Click!! |
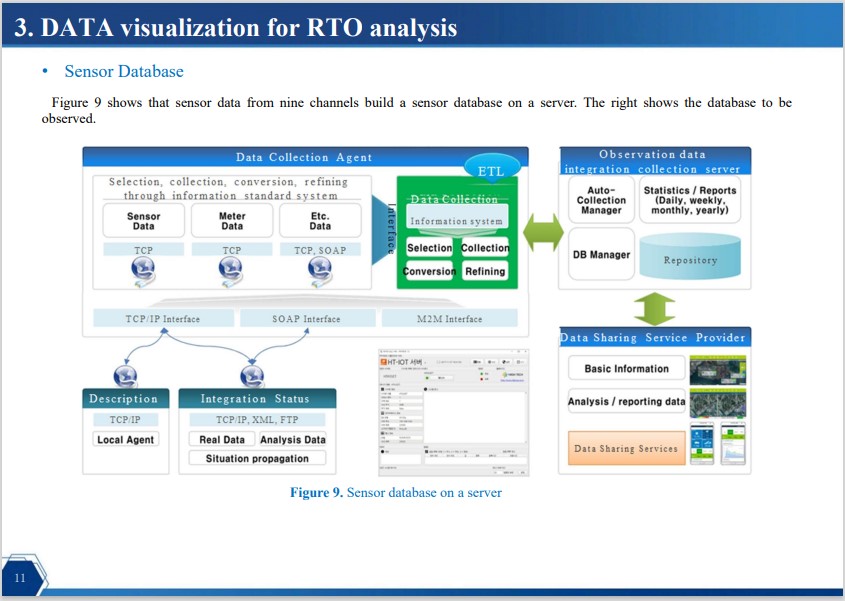 |
Figure 9 shows that sensor data from nine channels build a sensor database on a server. The right shows the database to be observed.
|
| ICACT20250064 Slide.13
[Big Slide]
|
Chrome Click!! |
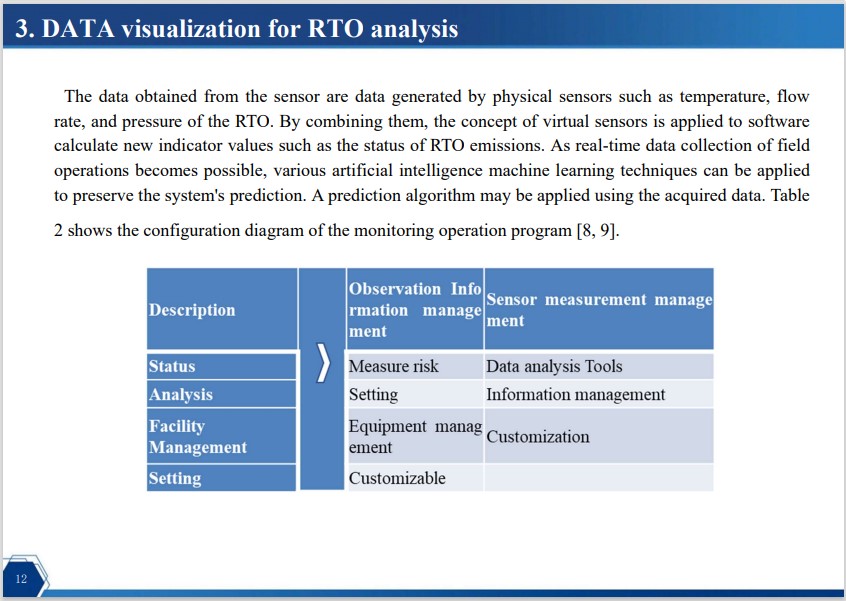 |
The data obtained from the sensor are data generated by physical sensors such as temperature, flow rate, and pressure of the RTO. By combining them, the concept of virtual sensors is applied to software calculate new indicator values such as the status of RTO emissions. As real-time data collection of field operations becomes possible, various artificial intelligence machine learning techniques can be applied to preserve the system's prediction. A prediction algorithm may be applied using the acquired data. Table 2 shows the configuration diagram of the monitoring operation program [8, 9].
|
| ICACT20250064 Slide.14
[Big Slide]
|
Chrome Click!! |
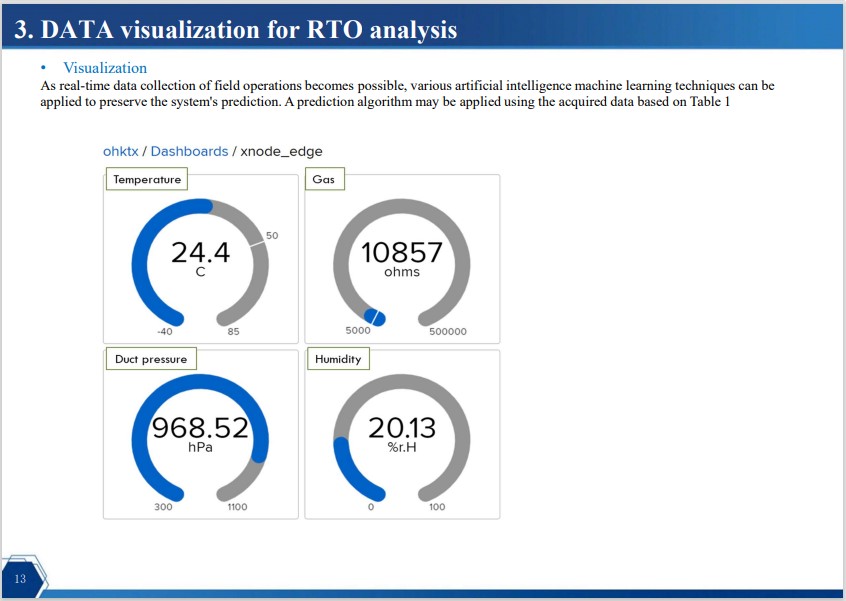 |
As real-time data collection of field operations becomes possible, various artificial intelligence machine learning techniques can be applied to preserve the system's prediction. A prediction algorithm may be applied using the acquired data based on Table 1
|
| ICACT20250064 Slide.15
[Big Slide]
|
Chrome Click!! |
 |
In this study, an Edge-IoT architecture (Architecture) for collecting and determining real-time state information for remote maintenance of heat storage combustion arsenic acid devices (RTOs) was presented and visualization methods were implemented.
The Edge-IoT architecture system interfaces with the PLC that controls RTO operation monitoring and transmits real-time data to a remote server, and the channel data received through IoT is analyzed to establish a database and visualize the characteristics of the RTO device.
Dataset collection was performed three times per second to collect real-time data from a remote server. In the case of high-speed data at the Edge and Smart Sensor Corps, it was configured to enable remote transmission of the result after signal processing, which reduced the load on the Edge-IoT side and the Cloud side network, which enabled efficient operation of the system.
|















