Now 5074 visitors
Today:0 Yesterday:0
Total: 147082
212S 50P 4R
2026-10-20, Week 43 |
| Member Login |
| TACT Journal Homepage |
| Call for Paper |
| Committee |
| Find My Paper |
| Author Homepage |
| Statistics & History |
| Welcome Message |
| Paper Procedure |
| FAQ |
| Paper Archives |
| Outstanding Papers |
| Author Homepage |
| - Paper Procedure |
| - Journal Procedure |
| - Presentation Tips |
|
| Program & Proceedings |
| Program with Papers |
| Plenary Session |
| Tutorial Session |
|
| Presentation Platform |
| Hotel & Travel Info |
| About Korea |
| Accommodation |
| Transportation |
| VISA |
| Other Infomation |
|
| Photo Gallery |
| Scheduler Login |
| Seminar |
| Archives Login |
|
| Sponsors |

|

|

|

|

|

|

|

|

|

|
|
|
|
|
 ICACT20260055 Slide.01
[Big Slide] |
Chrome  Click!! |
 |
This "An Interpretable Hybrid Model for PDF Malware Detection Using CNN and Vision Transformer" is presented by Emmanuel Kwesi Baah on behalf of the other co-authors (Dominic Asamoah, Frederick Ledi, Anthony Kingsley Sackey, Eric Agyekum Nana Boamah, Richard Kofi Doh). . |
| ICACT20260055 Slide.02
[Big Slide]
|
Chrome Click!! |
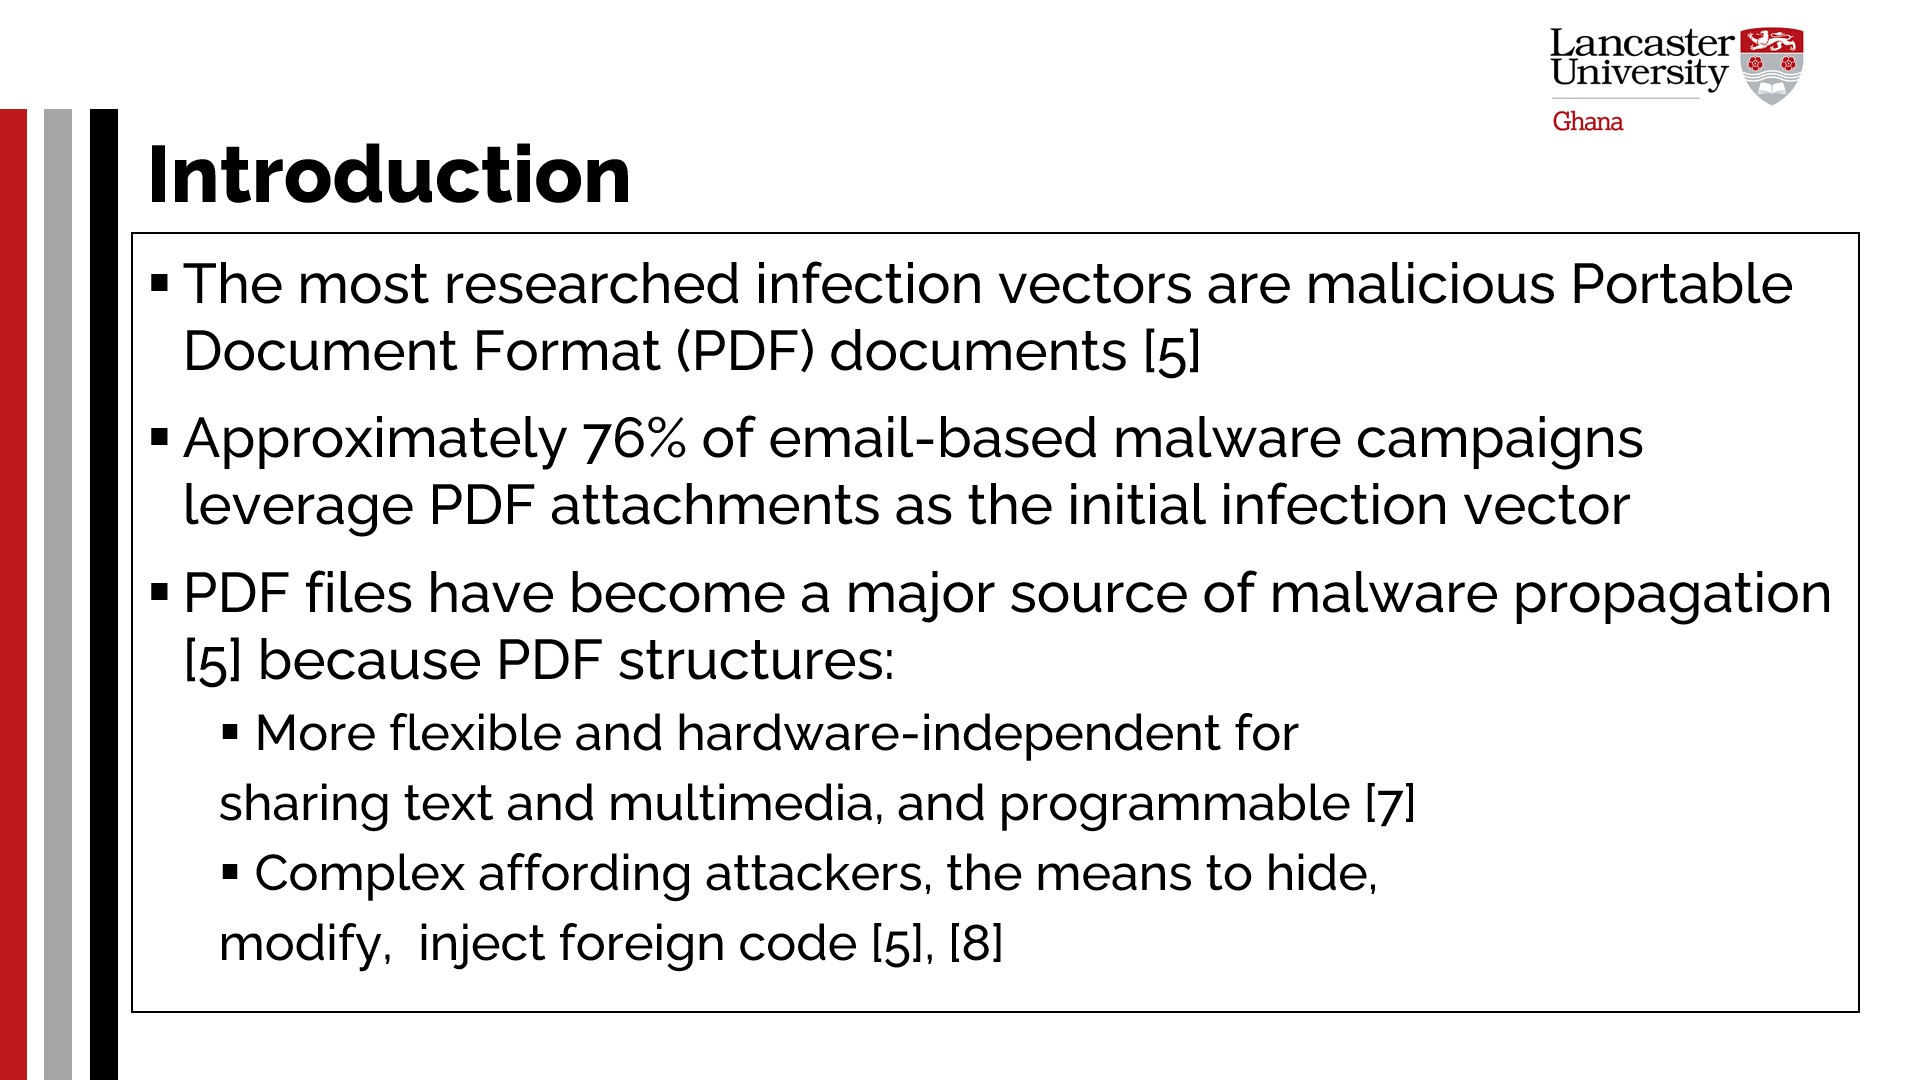 |
PDF malware is the practice of inserting malicious code into PDF documents to exploit flaws in software readers or lure users into performing destructive actions [6], [7]. PDF files are the primary conduits for document sharing due to their adaptability and consistent formatting across platforms [7]. Unfortunately, PDF files have become a major source of malware propagation [5]. This is because, in an effort to make PDF files more flexible and hardware-independent for sharing text and multimedia, Adobe incorporated programmable elements into its structure [7]. Thus, its structure and complexity afford attackers, to a certain degree, the means to hide, modify, or inject foreign code [5], [8]. Additionally, due to the growing number of unwary users and the limitations of contemporary antivirus software in identifying these injected foreign codes, attackers can potentially exploit victims through social engineering. Attackers have also exploited vulnerabilities in third-party applications used to access and read PDF documents. |
| ICACT20260055 Slide.03
[Big Slide]
|
Chrome Click!! |
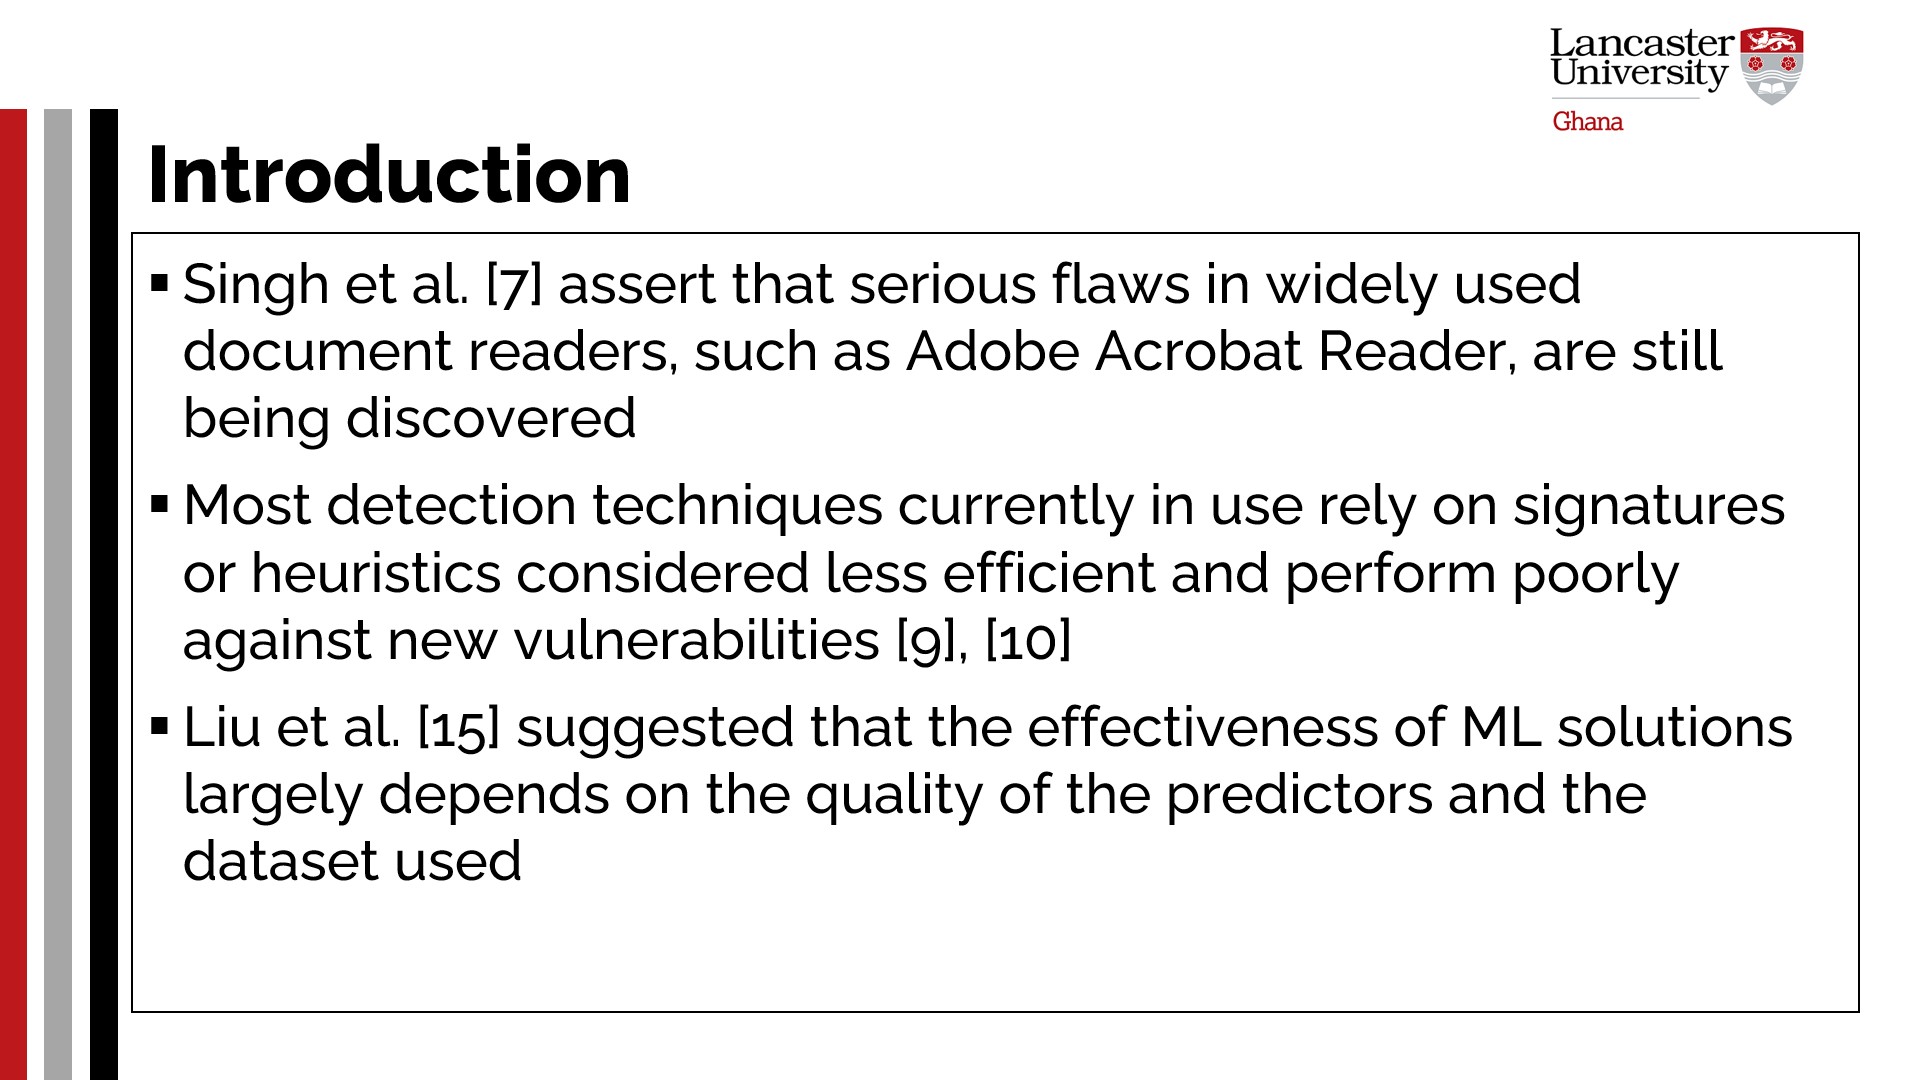 |
Singh et al. [7] assert that serious flaws in widely used document readers, such as Adobe Acrobat Reader, are still being discovered. Ultimately, it is well known that most detection techniques currently in use rely on signatures or heuristics, which are considered less efficient and perform
poorly against new vulnerabilities [9], [10]. As attackers continue to refine their methods and make them more complex, efficient, and proactive solutions to protect PDF files against these evolving threats and breaches are necessary.
Liu et al. [15] suggested that the effectiveness of ML solutions in such contexts largely depend on the quality of the predictors and the dataset used. In this light, this study proposes to leverage ML to introduce a novel, efficient, and informative solution against PDF malware.
|
| ICACT20260055 Slide.04
[Big Slide]
|
Chrome Click!! |
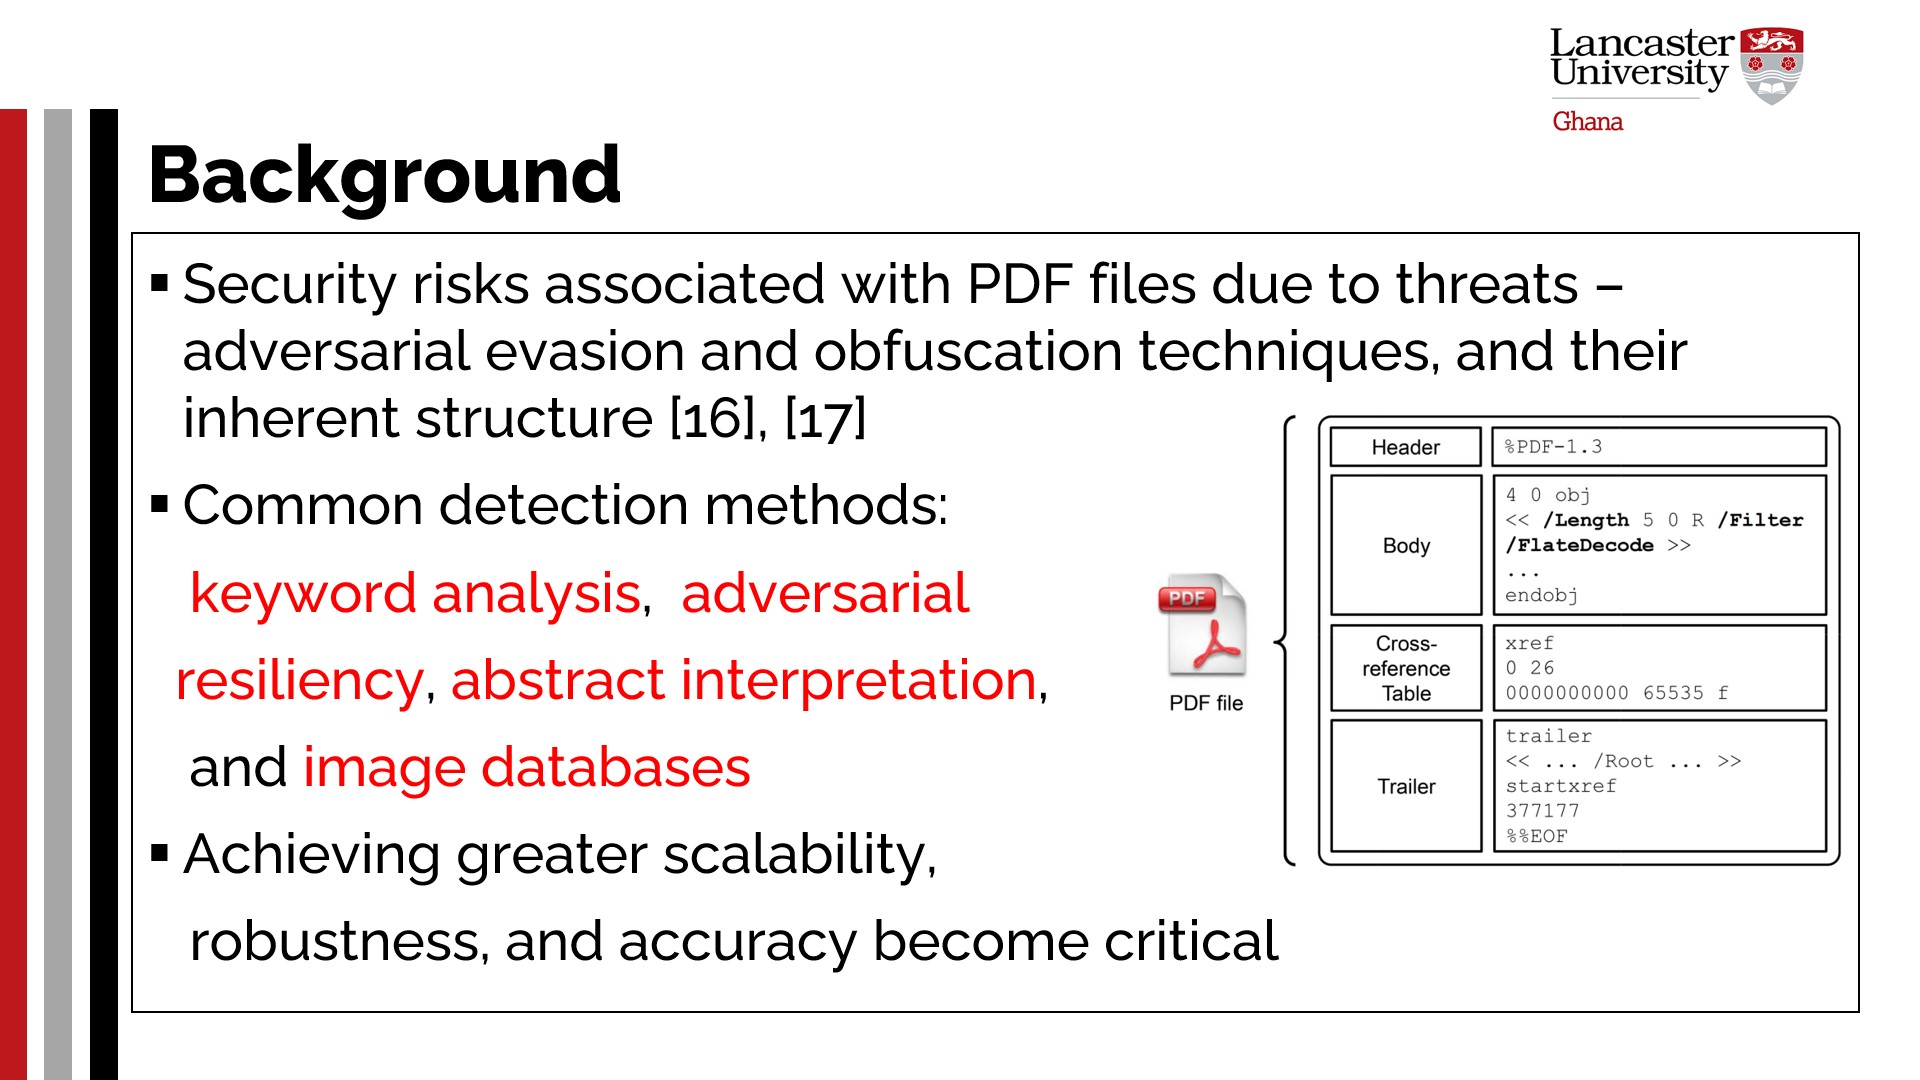 |
There is a growing demand for improving detection models, as cyberattacks have become increasingly sophisticated
and PDF files have become a common target. Previous research has demonstrated the security risks associated with
PDF files due to threats such as adversarial evasion and obfuscation techniques, as well as their inherent nature [16],
[17]. Several studies have addressed this issue using keyword analysis, adversarial resiliency, abstract interpretation, and
image databases. There is still a need for greater scalability, robustness, and accuracy, especially when faced with evolving
obfuscation techniques and adversarial counterattacks.
|
| ICACT20260055 Slide.05
[Big Slide]
|
Chrome Click!! |
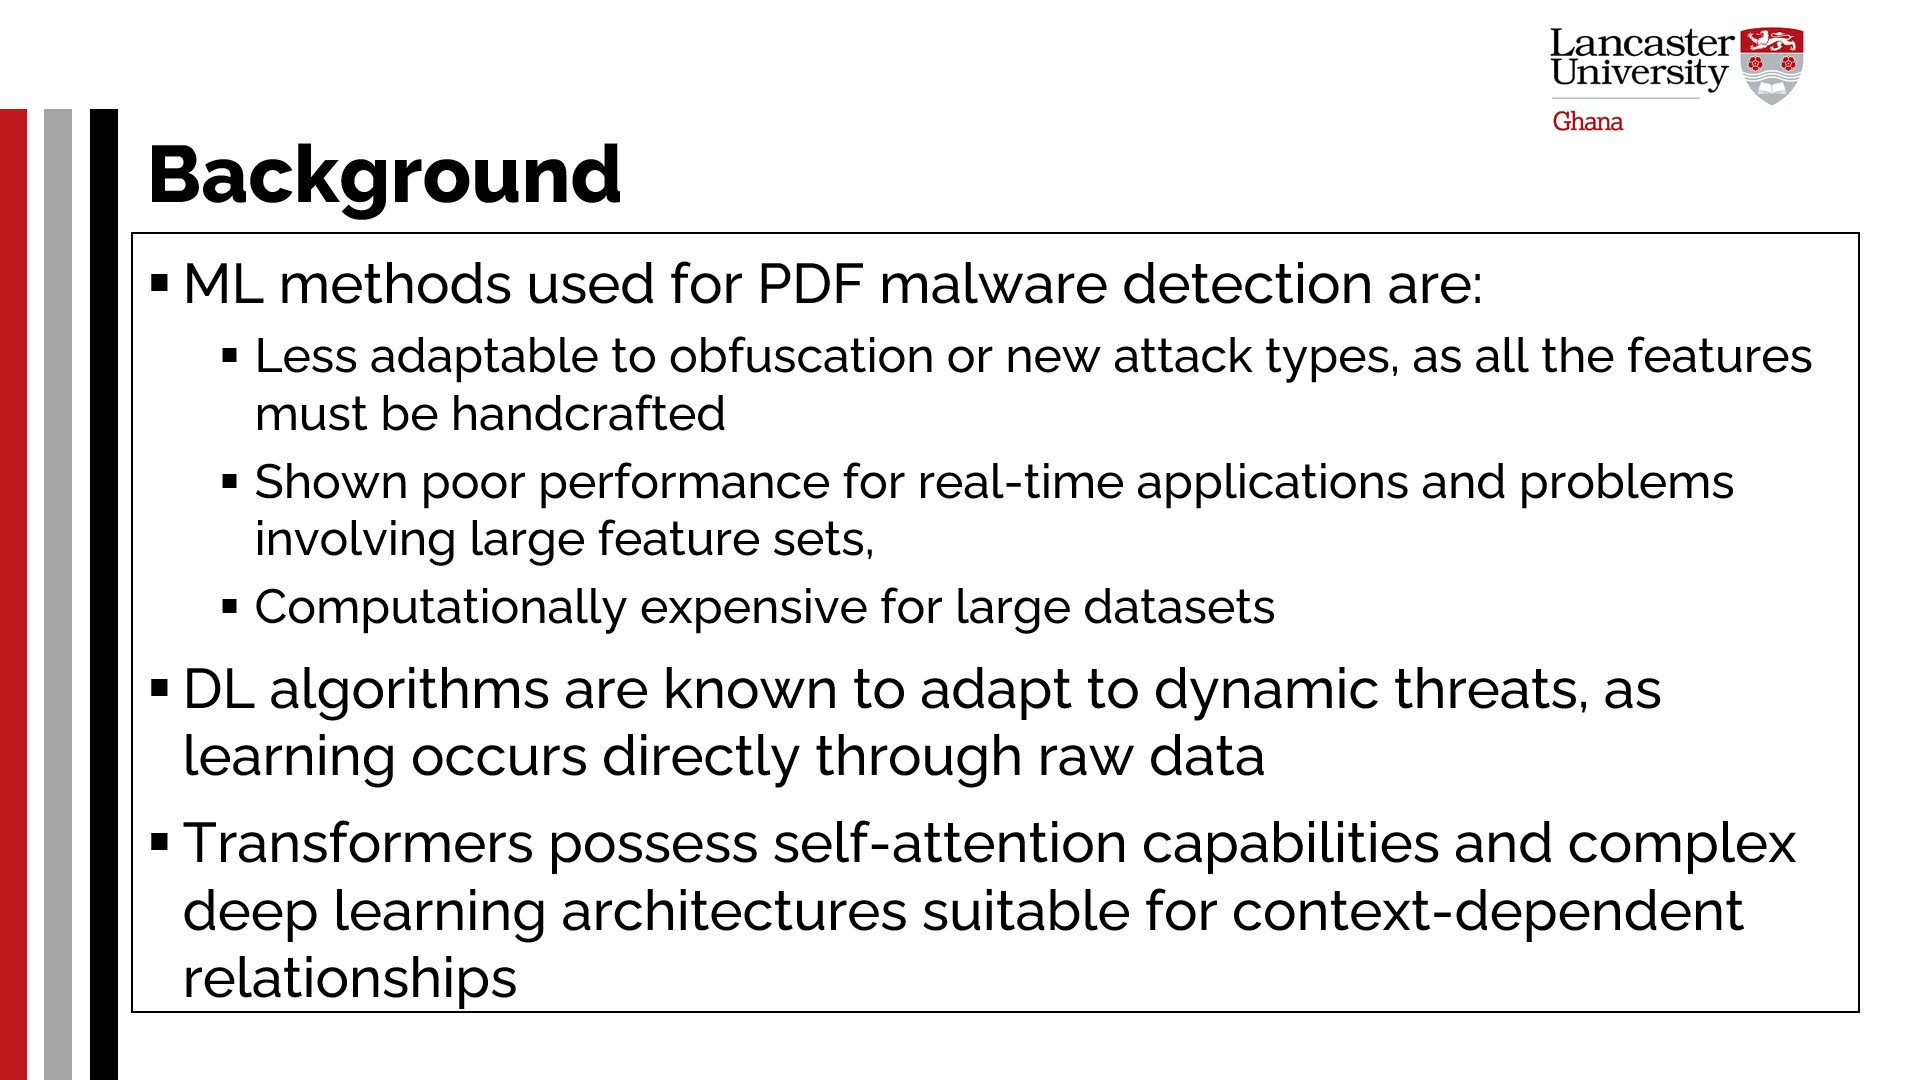 |
Advanced machine learning (ML) and hybrid techniques have been applied to improve the accuracy, scalability, and robustness of detection. ML methods are typically evaluated based on the type of features they are engineered to detect, particularly meaningful attributes in the PDF structure metadata, embedded JavaScript properties, or file content patterns. They are strong in identifying patterns using statistical modeling and work well under known threats. However, they are less adaptable to obfuscation or new attack types, as all the features must be handcrafted. ML algorithms have shown poor performance for real-time applications and problems involving large feature sets, as they are computationally expensive for large datasets. It is also known that ML algorithms tend to fail in cases where some features are correlated, thus limiting the utility of this classifier in scenarios where PDF parts dynamically interact with each other. On the other hand, deep learning (DL) algorithms are known to adapt to dynamic threats, as learning occurs directly through raw data. DL models, such as Convolutional Neural Networks (CNN), also yield good performance by processing high-dimensional inputs. Transformers also possess self-attention capabilities and complex deep learning architectures, making them particularly suitable for context-dependent relationships. Therefore, from each part of the input features, like the interdependencies between PDF objects, it can efficiently compute while maintaining a certain level of relevance.
|
| ICACT20260055 Slide.06
[Big Slide]
|
Chrome Click!! |
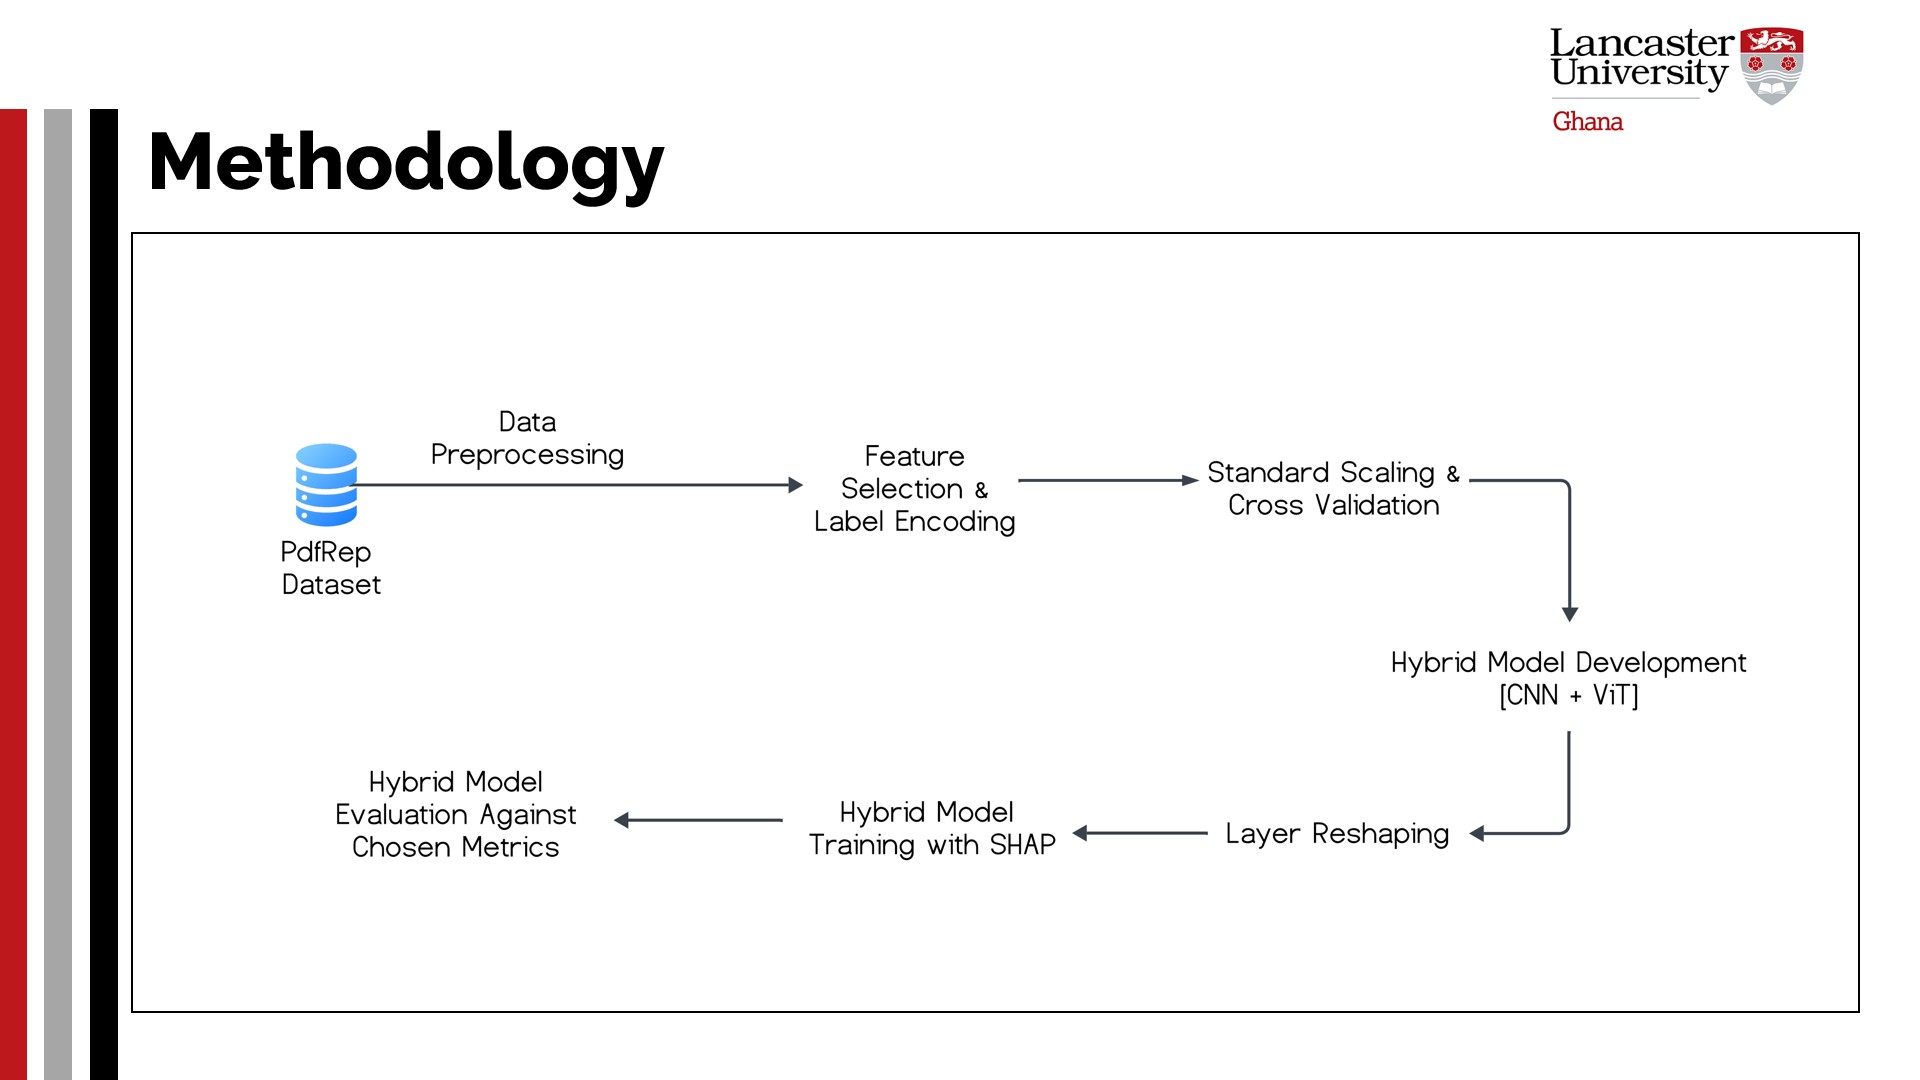 |
This study considers a hybrid of the CNN and Vision Transformer (ViT) architectures to significantly and positively impact the detection of PDF malware. We achieve this by employing the explainability framework SHAP to unveil key insights from the proposed detection solution. The figure summarizes the steps for this study.
The PDFRep Dataset
The PDFRep dataset was employed to train and evaluate the hybrid model proposed in this study. In agreement with its creators, Liu et al. [15], the effectiveness of models largely depends on the data employed to train and test the model. The dataset for this study is suitable for the study as it is recent, extensive, and entails a comprehensive collection of malware samples and PDF files from the Contagio (18,210), CIC (28,791), and VirusShare (290,670). It further includes 155,583 benign samples from Govdocs. Overall, the study utilized a total of 322,761 and 170,477 adverse and benign PDF samples.
Feature Selection and Label Encoding
The study began by separating the features from the target variables and setting them as input and output data, respectively, for model training. Irrelevant columns were dropped. The LabelEncoder utility was used to convert categorical data into integers and map them accordingly.
Standard Scaling and Cross-validation
The features were normalized and scaled to prevent the dominance of certain features and mitigate biases. A cross-validation pipeline is set up, where the number of splits or folds is determined, shuffling is enabled, and the random number generator is also defined. This technique is employed to adequately and fairly resample the data by splitting it into defined subsets, also known as k-folds. For a repeated k-fold amount of time, the model is trained on the previous fold (k-1) and is tested on the remaining folds.
Hybrid Model Development
The study proceeded to define the hybrid solution, which consisted of the CNN and ViT architectures. With CNN’s ability to extract features and ViT’s strength in capturing contextual relationships, a combination of both holds great potential in combating PDF malware.
|
| ICACT20260055 Slide.07
[Big Slide]
|
Chrome Click!! |
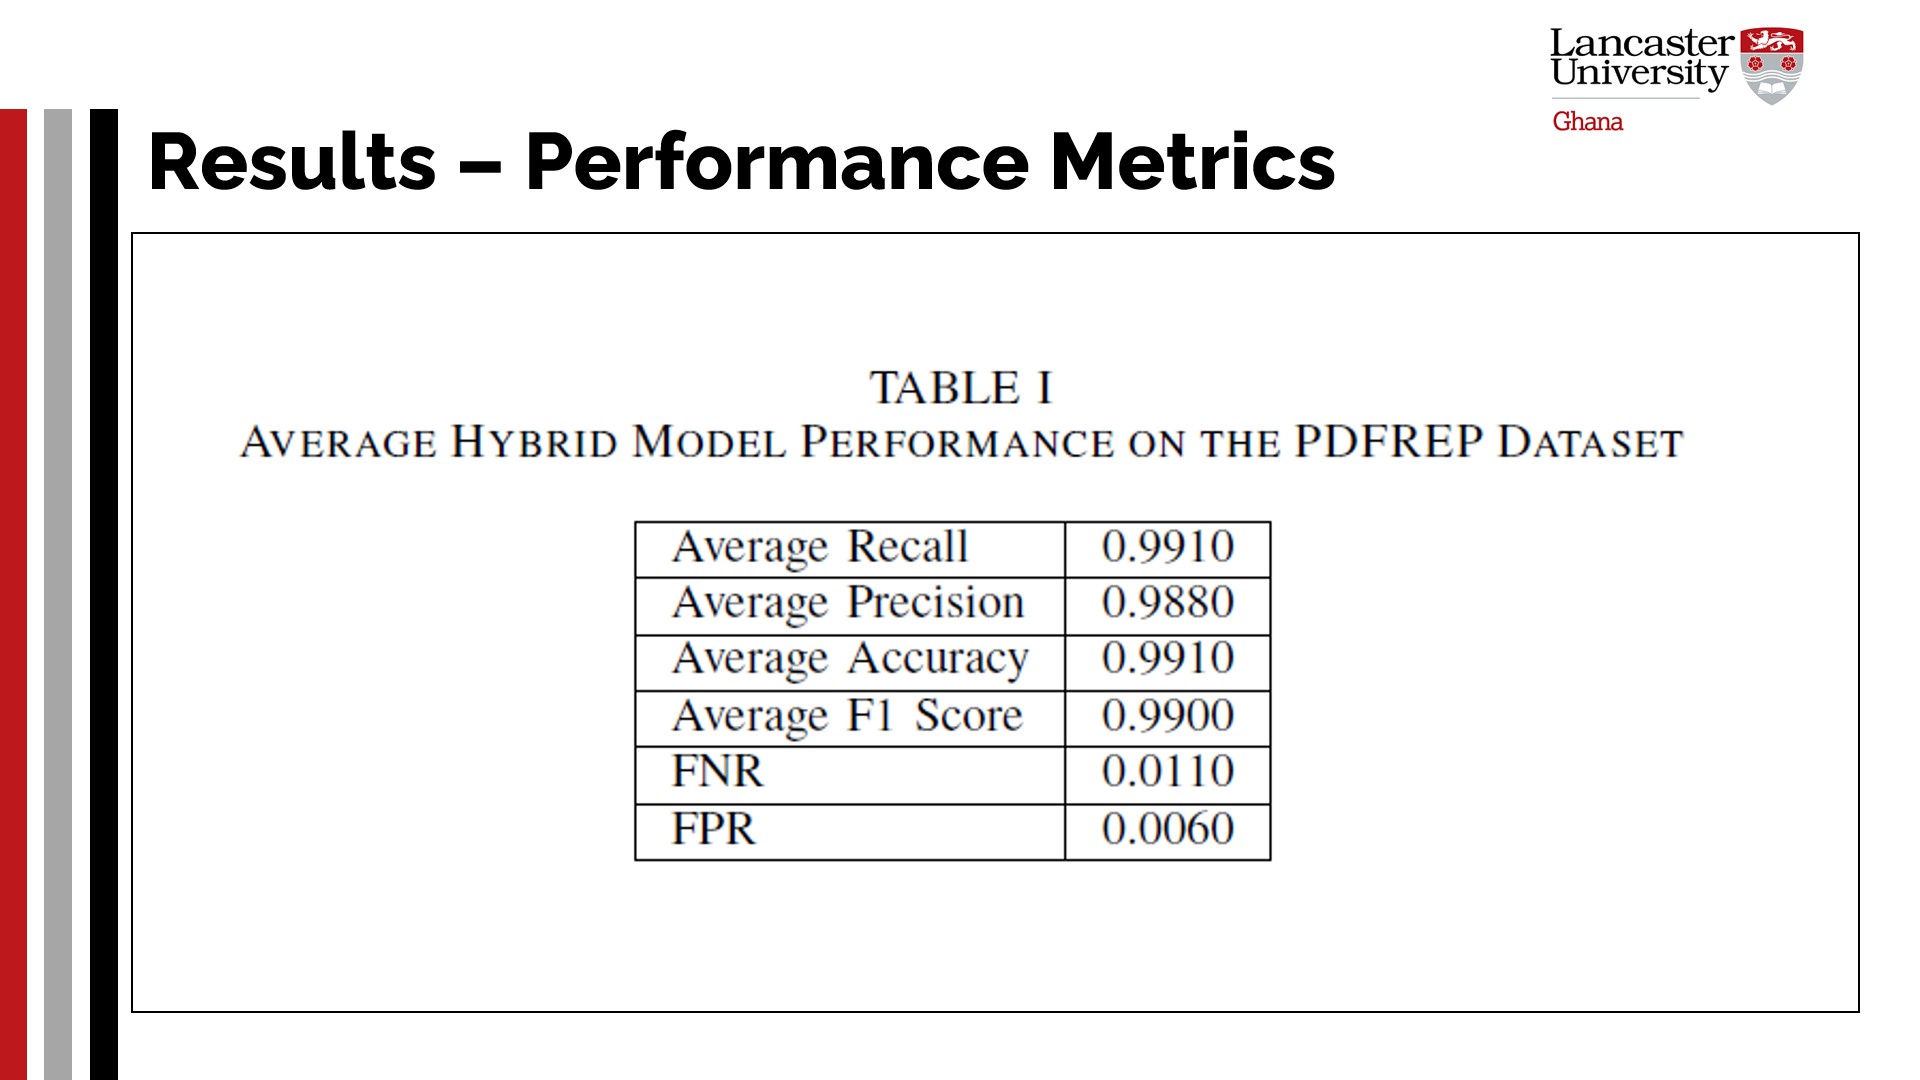 |
According to Table 1.0, the hybrid model consistently yielded high scores across all metrics. We observed that the model was, on average, highly accurate in its predictions, as revealed by its recall, F1-score, and accuracy scores, despite a slight dip in precision. Additionally, the model proved reliable and reassuring because of its scores in FNR and FPR. Such low scores for both indicators proved that it could tell between the classes and avoid misclassifying them. According to the results, the model is well-suited for practical integration with real-world systems and applications.
|
| ICACT20260055 Slide.08
[Big Slide]
|
Chrome Click!! |
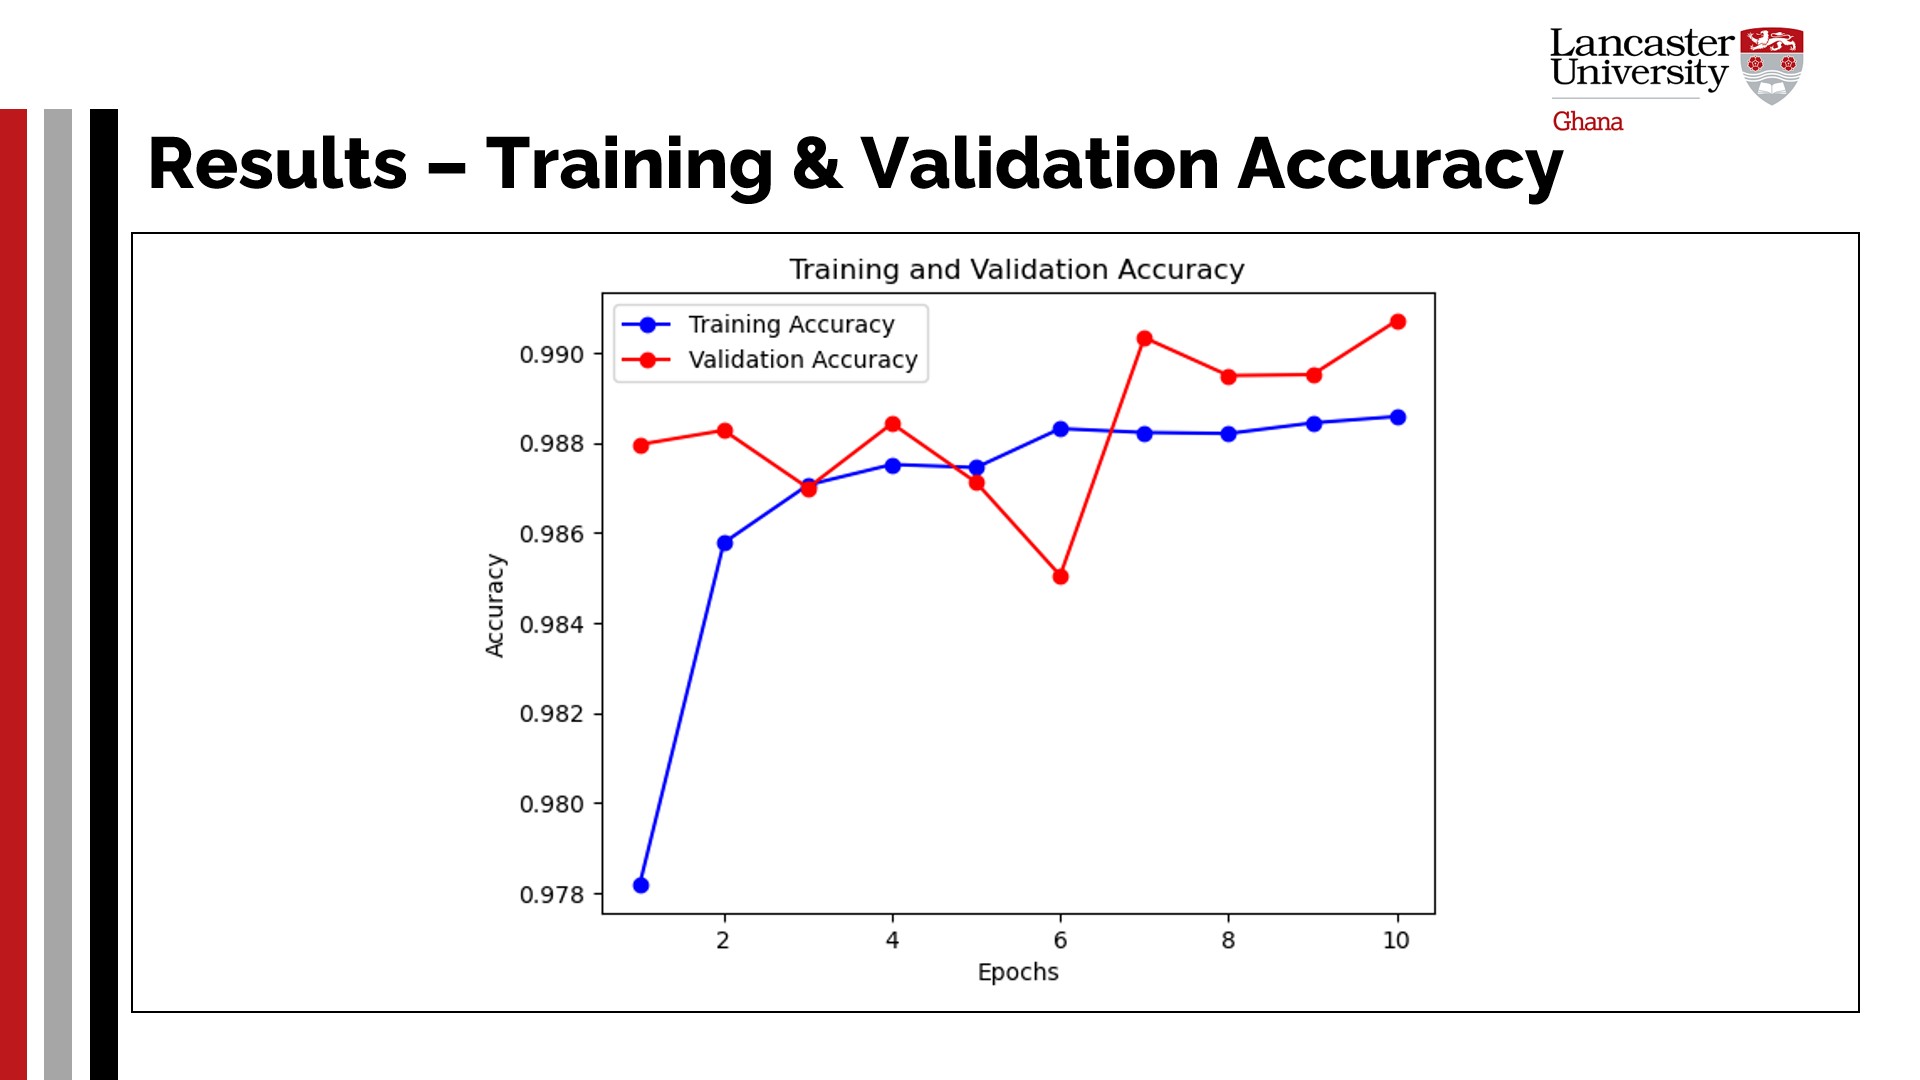 |
The model exhibited a sharp rise in accuracy during training and maintained it throughout the last epoch. Yet, it is seen to have struggled in between the epochs, which goes to prove its learning process. The figure illustrates the accuracy of the model during the validation phase. With short rises and falls during the beginning epochs and a drop at the sixth, the model was seen to struggle in applying what it had learned to new data. However, there was a sharp rise after the sixth epoch, which is maintained or even bettered at the tenth epoch. It can be concluded that the hybrid model, throughout the epochs, learned to classify new instances in the validation split at a higher accuracy. For the losses in training, the model did quite well. It drastically reduced losses from the first epoch and consistently maintained a steady decrease to the last.
|
| ICACT20260055 Slide.09
[Big Slide]
|
Chrome Click!! |
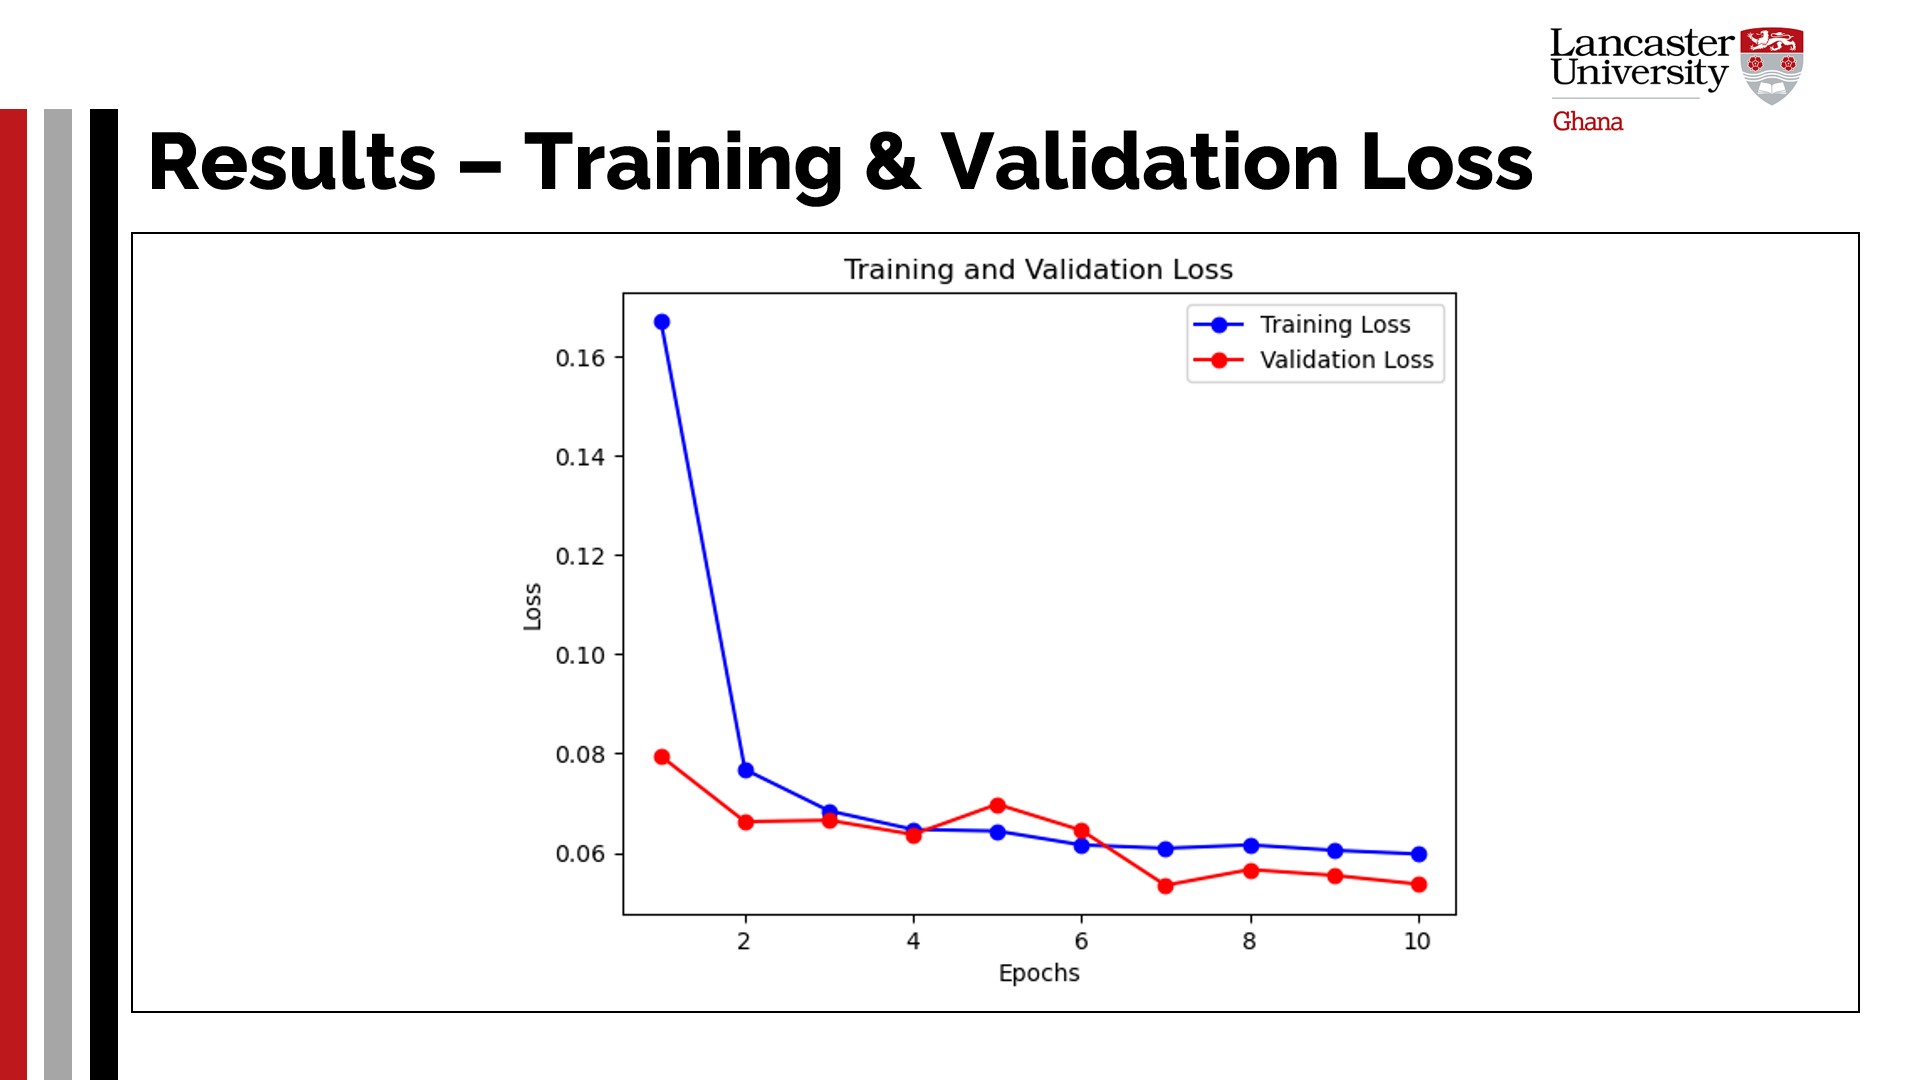 |
The figure illustrates that the model effectively reduced losses during the validation process. Overall, it is observed that the model struggled between the fourth and sixth epochs but subsequently made the correct predictions, resulting in minimal losses afterwards.
|
| ICACT20260055 Slide.10
[Big Slide]
|
Chrome Click!! |
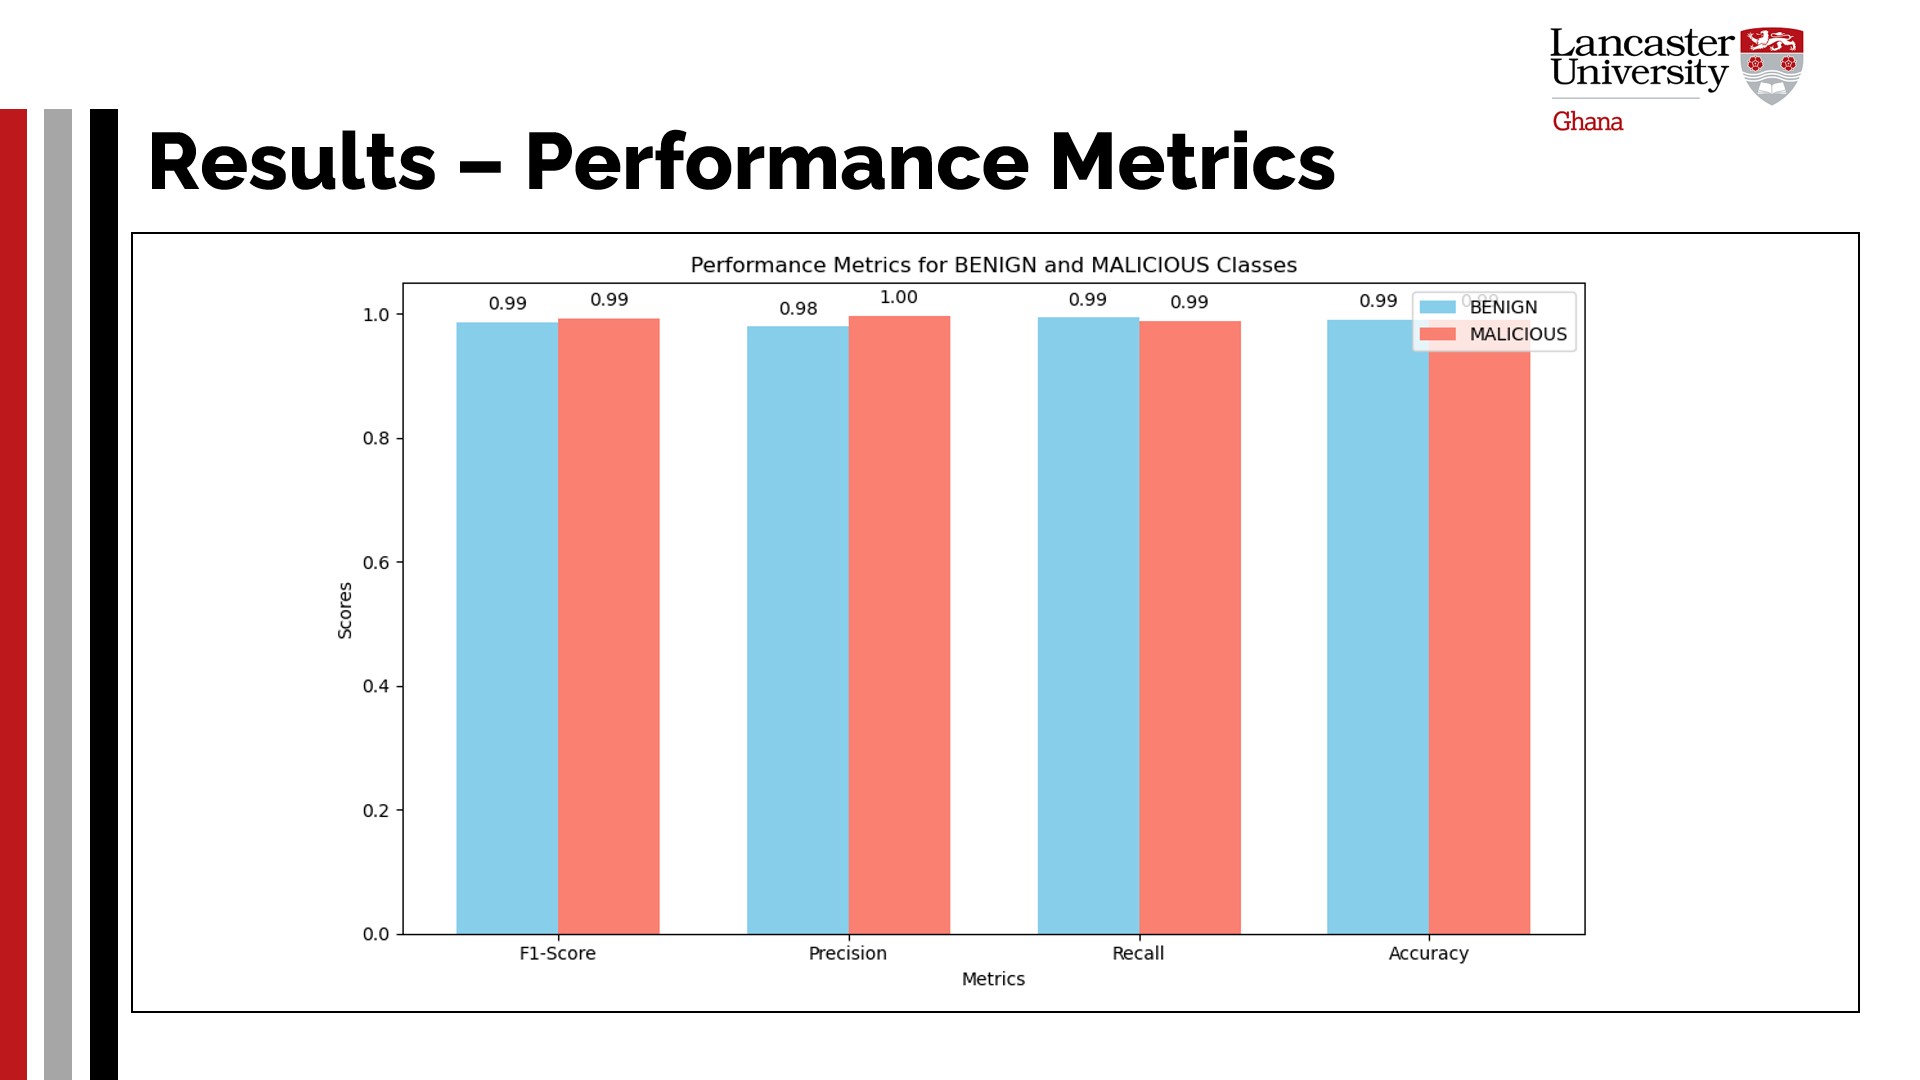 |
Further projections of the strength of the model are presented in the figure. The figure reveal that the model is highly accurate in detecting data instances of the malicious class due to the well-learned patterns in features and a deep understanding of the context. The figure shows the hybrid model had peak levels of performance across recall, precision, accuracy, and F1 in both malicious and benign classes.
|
| ICACT20260055 Slide.11
[Big Slide]
|
Chrome Click!! |
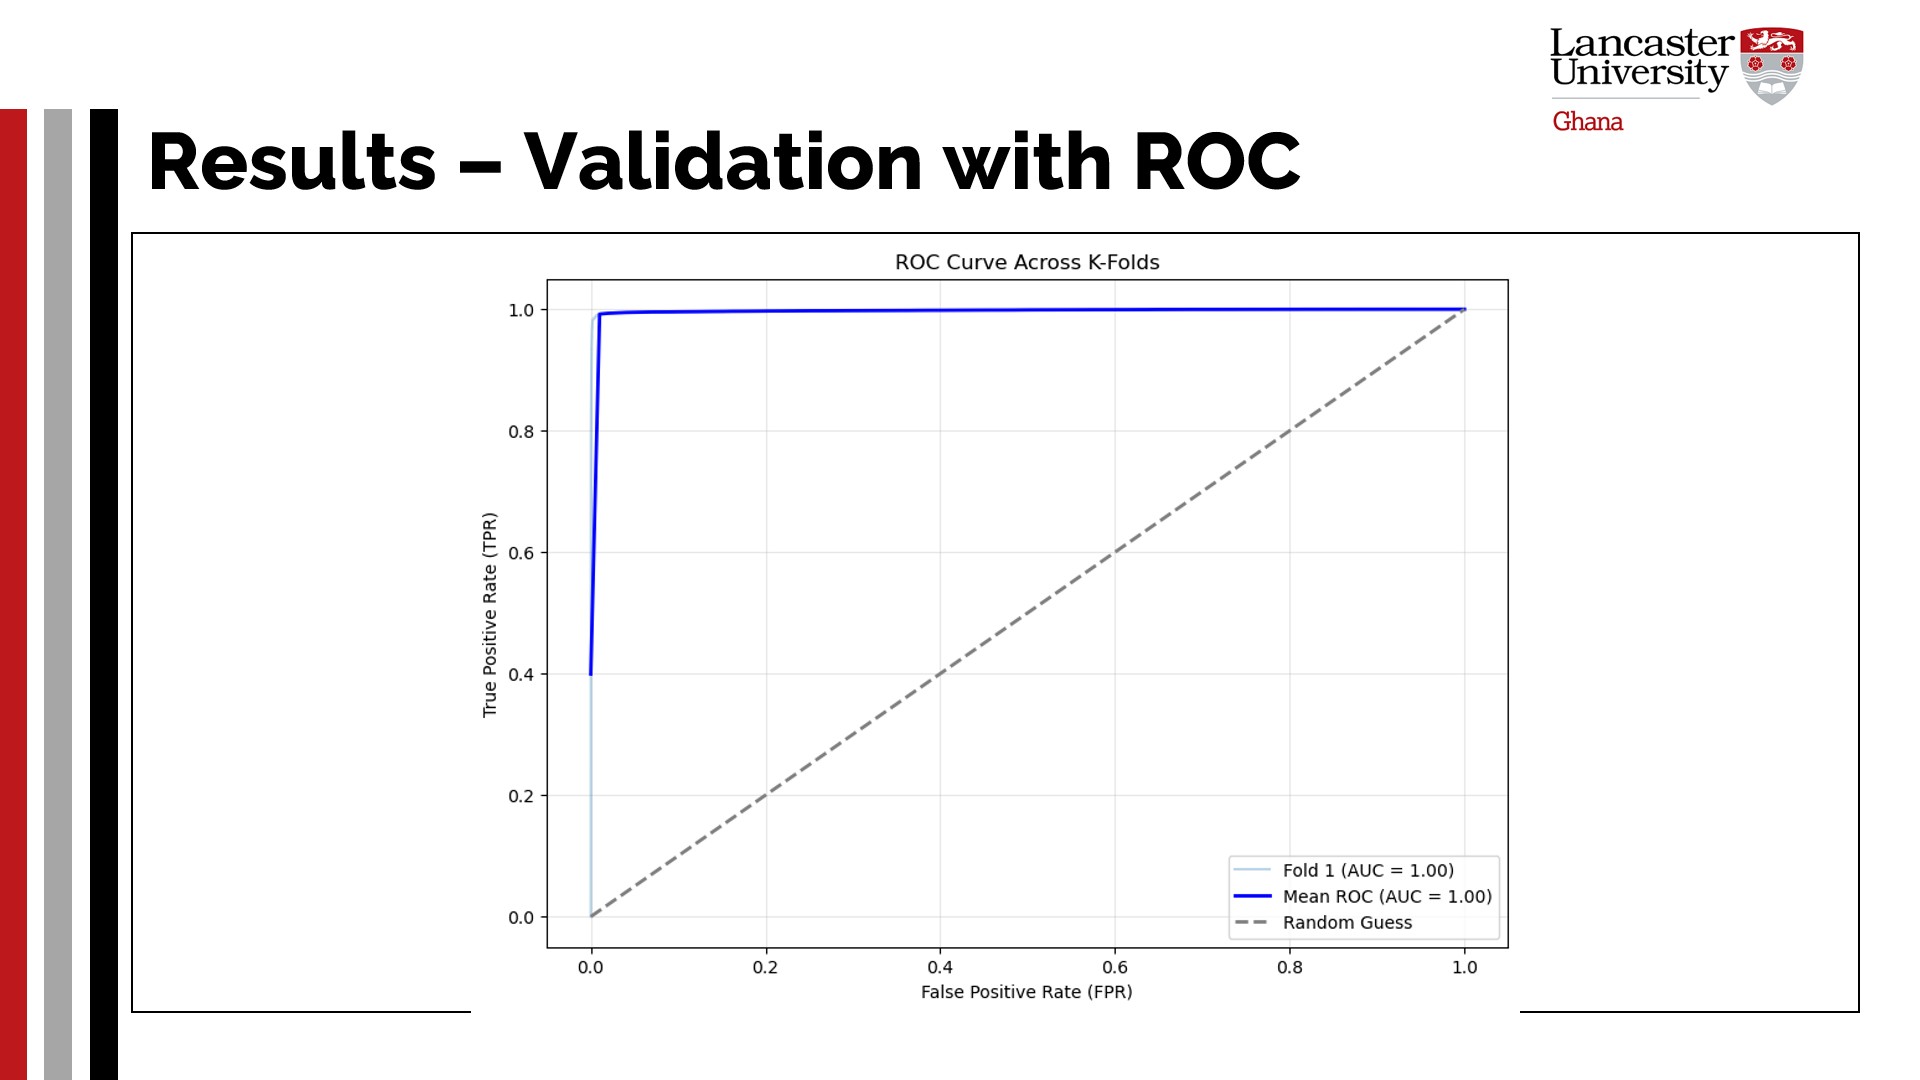 |
The hybrid solution obtained a perfect mean ROC with an area of 1. This reveals more about the overall performance of the model. The figure defines the trade-off between the TPR and FPR along defined thresholds. Should the model have obtained an area less than 0.5 (random guessing), it would have signified that it was inverted and unreliable.
|
| ICACT20260055 Slide.12
[Big Slide]
|
Chrome Click!! |
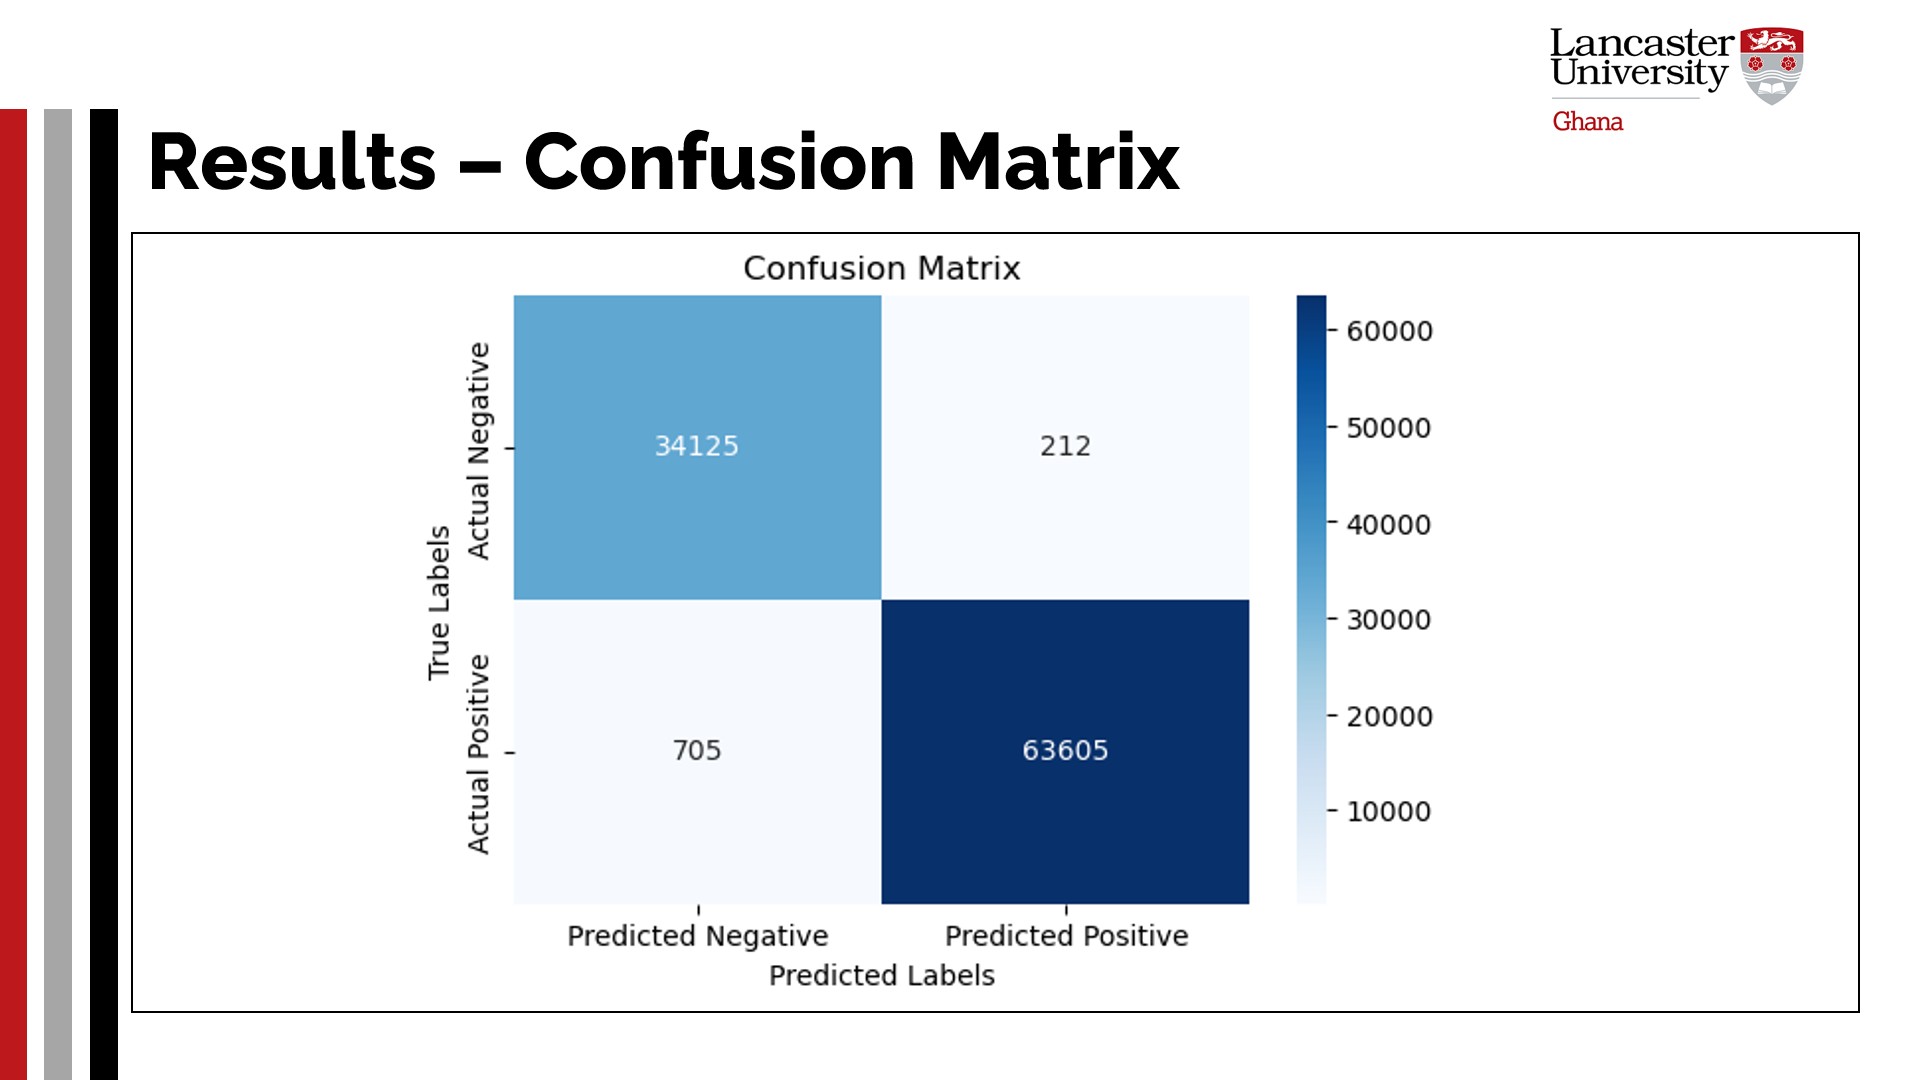 |
The illustration in the figure presents the confusion matrix score of the introduced CNN + ViT model. This is a key metric to further view the performance of the model. The figure shows that the model correctly predicted the most negative (34125) and positive (63605) data instances. Yet, a relatively small set of these instances was misclassified and should be improved.
|
| ICACT20260055 Slide.13
[Big Slide]
|
Chrome Click!! |
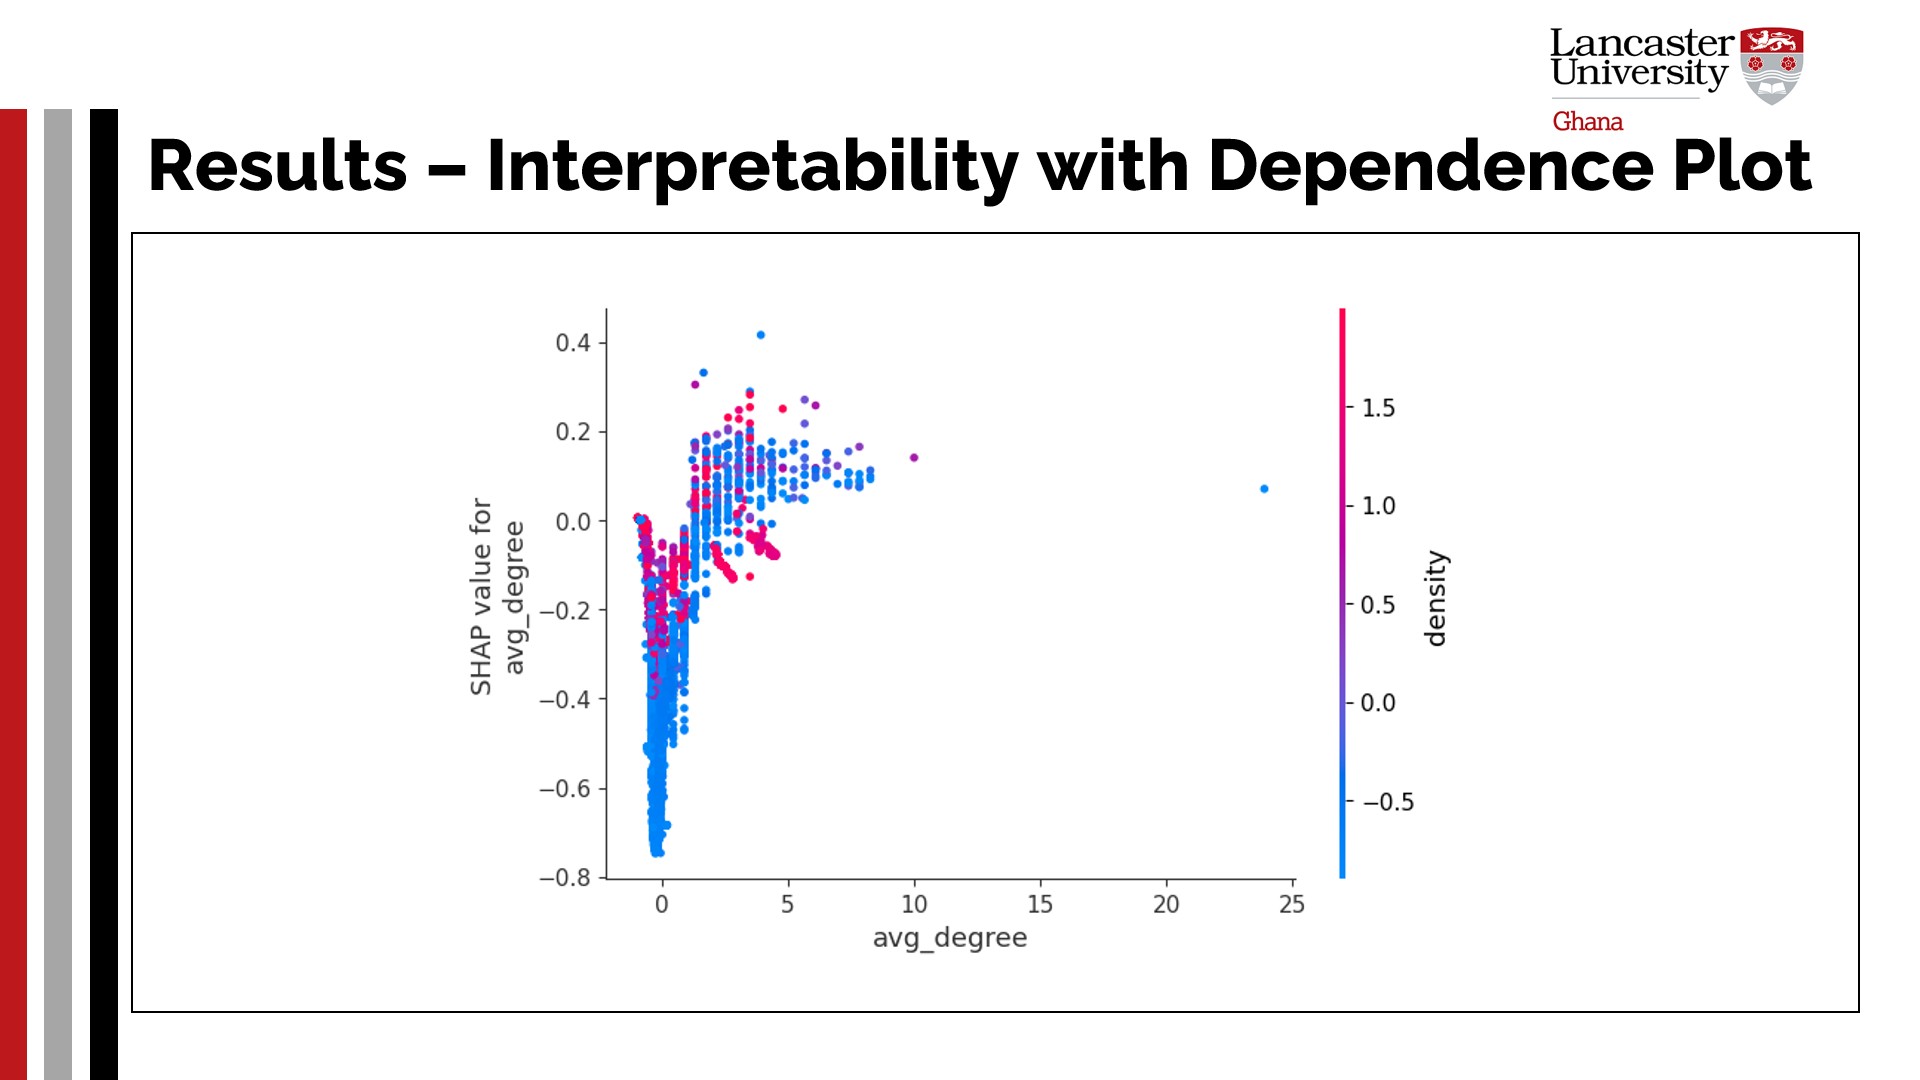 |
From the plot, density, avg_shortest_path, and avg_children proved to be dominant red or negative contributors. However, the avg_degree was strong enough with the base value to predict in favour of Class 1. This study further visualises the highest-ranked feature to understand its relationship with its SHAP value, as shown in the figure. This SHAP dependence plot provides insights into the avg_degree feature and its relationship with the output of the model, as well as its interaction with density. The horizontal axis in the figure represents the actual values of this feature across the dataset, while the vertical axis represents its impact (SHAP values) on predictions. Each dot in the plot represents an individual observation from the dataset. A colour bar is included to measure the density value concerning the chosen feature. Deducing from the figure, most low SHAP values (negative or close to zero) of avg_degree have little or no positive impact on the prediction. Additionally, a lower density further reduces the SHAP value. As the SHAP values of avg_degree increase, it indicates that this has a positive impact on the prediction. Again, with higher density, these values increase more. Yet, there exists an outlier where a high avg_degree value corresponds to a low SHAP value. Overall, it can be inferred that the avg_degree feature, on average, has a positive impact on the prediction as its SHAP value increases. The avg_degree feature was found to have a greater positive influence at higher densities, but its effect was diminished, and SHAP values declined at lower densities. Finally, the SHAP values of avg_degree rose and remained continuously positive, indicating that the model primarily relied on it to make decisions.
|
| ICACT20260055 Slide.14
[Big Slide]
|
Chrome Click!! |
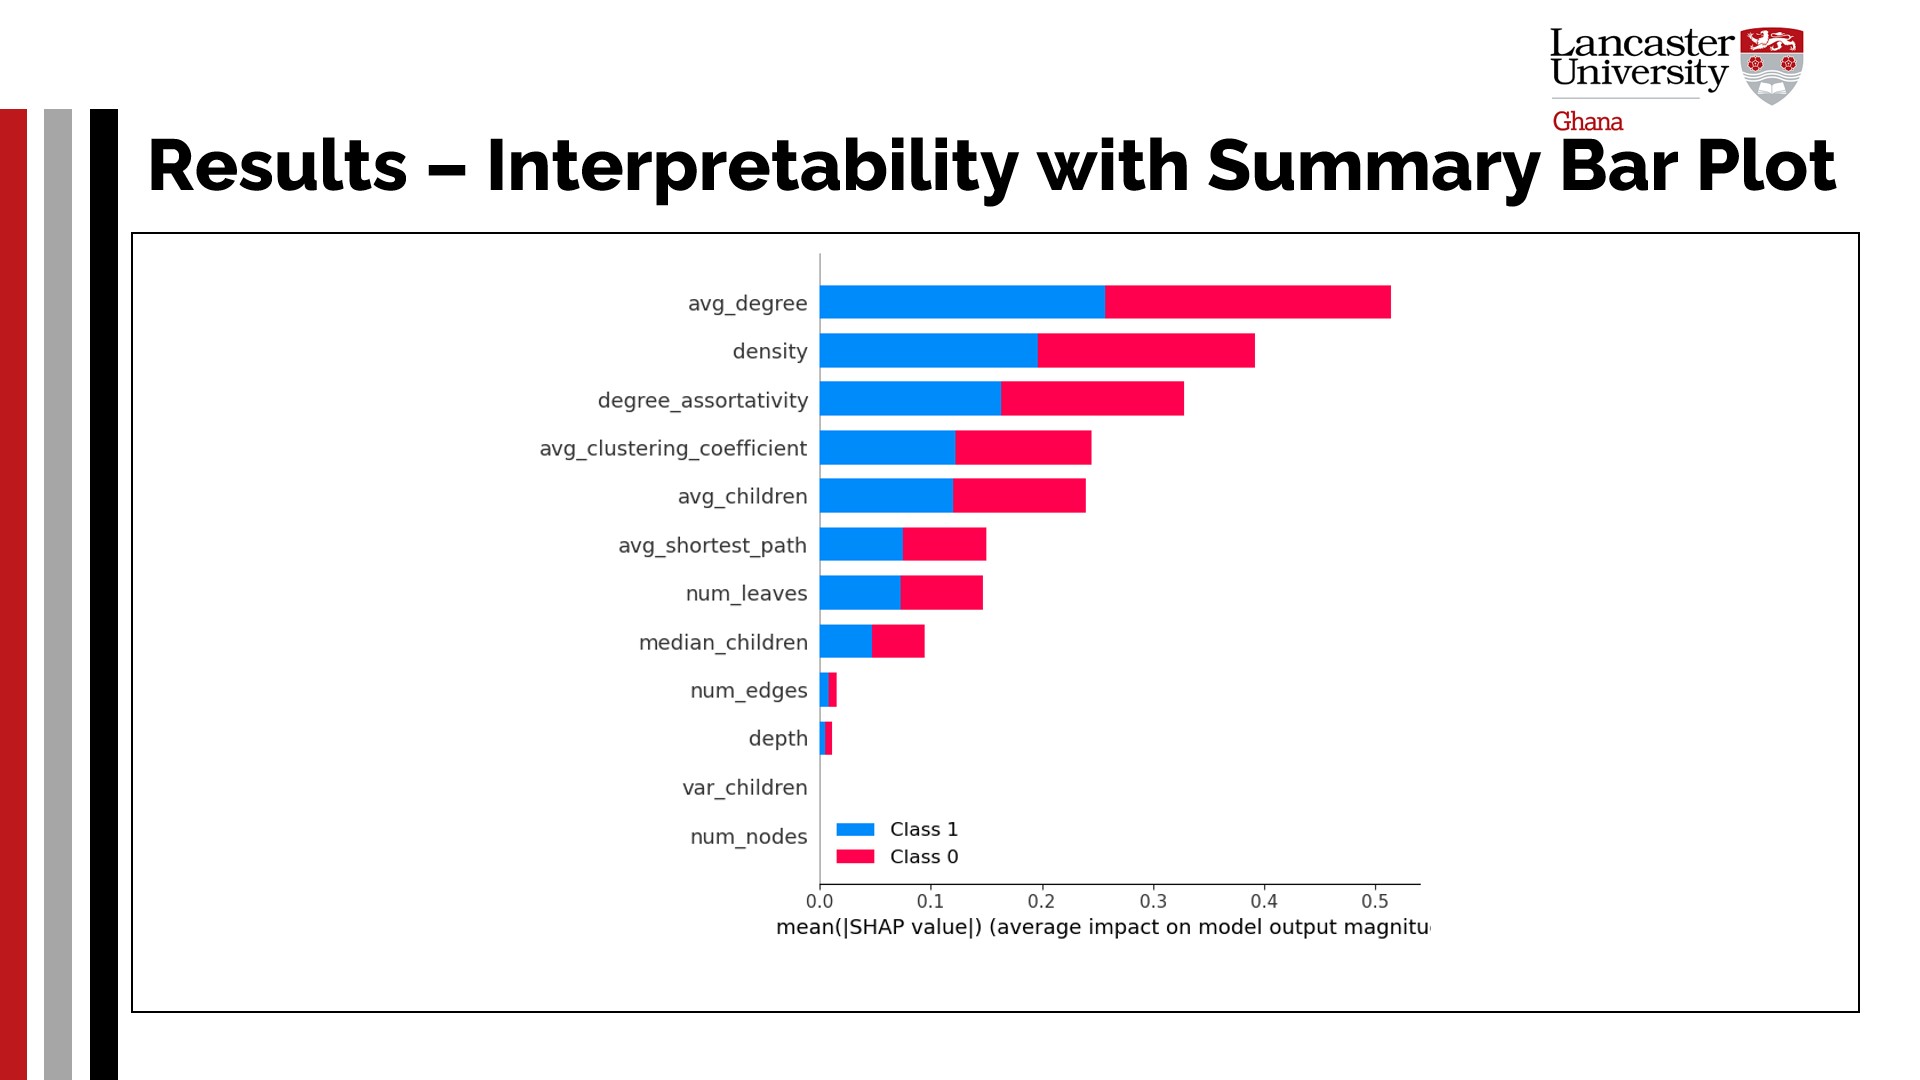 |
The figure presents a summary plot, where features are listed vertically, and the average magnitude of the SHAP values is plotted horizontally. These features are ranked in descending order of importance (which is defined by the mean SHAP values) in driving predictions. The blue and red bars represent the average SHAP values when classes 1 and 0 are predicted, respectively. It can be concluded that the first three factors from the top significantly influence the prediction of both classes, with avg_degree being the most crucial feature. According to the relative lengths of the bars, class 1 is significantly more affected by the avg_degree. At the same time, the other is somewhat more affected by the “density” variable, although it also has an impact on both class predictions. The degree_assortativity feature is influential in model predictions, but has a more balanced effect on both classes. Additionally, the avg_clustering_coefficient, avg_children, and avg_shortest_path provide a noticeable impact on predictions but are not as significant as the top-ranked features. The num_edges, depth, var_children, and num_nodes variables, however, make little to no contribution to the model decisions.
|
| ICACT20260055 Slide.15
[Big Slide]
|
Chrome Click!! |
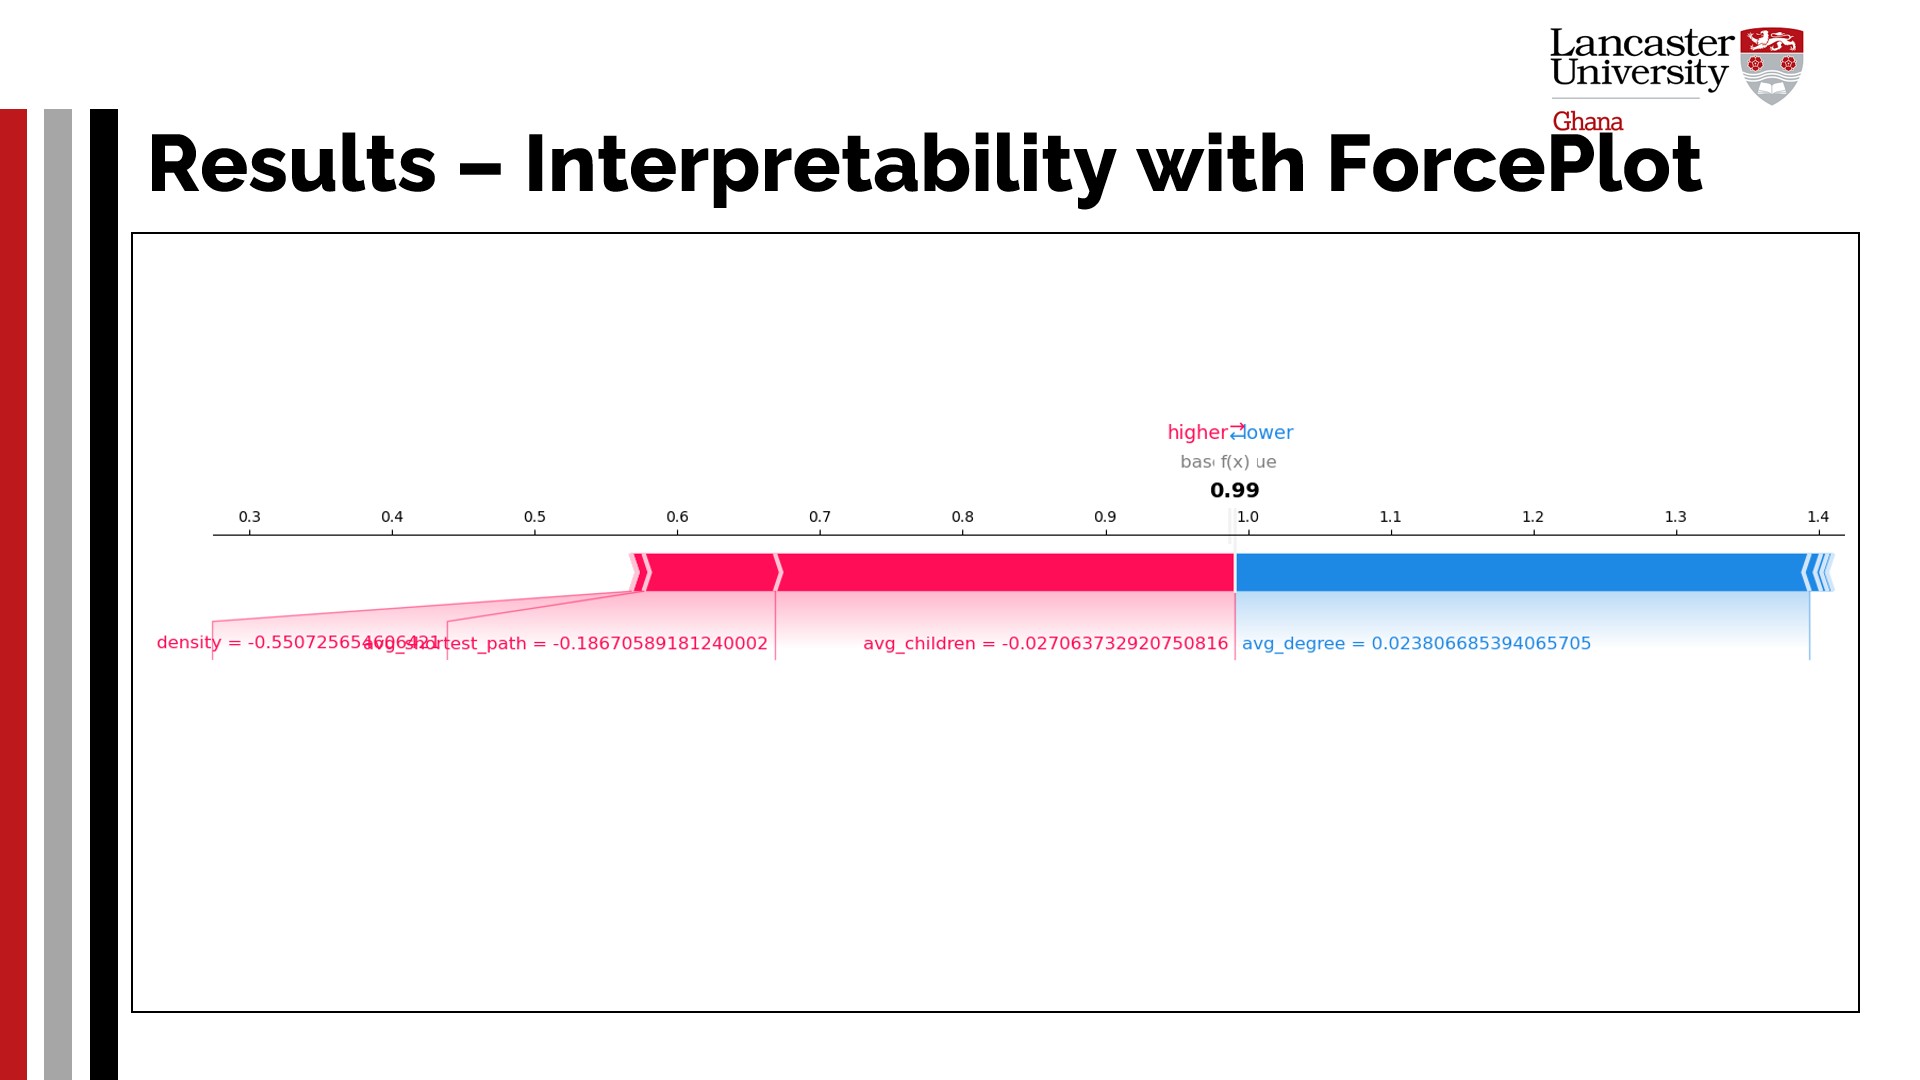 |
Furthermore, this study utilises the SHAP force plot, as shown in the figure, to visualise and explain how the hybrid model arrives at a specific prediction for an instance. This combines SHAP values to illustrate how each feature contributes to pushing the prediction of the model toward one class or the other. Firstly, the base value, which denotes the model’s average prediction across the dataset without any features, was defined. Then, the SHAP values quantify the contribution of each feature, assigning positive and negative values that push the prediction toward the necessary classes. Essentially, the prediction begins at the base value, with contributors in red pushing the prediction downward (toward Class 0) and those in blue pushing it upward (toward Class 1), as shown in the figure
|
| ICACT20260055 Slide.16
[Big Slide]
|
Chrome Click!! |
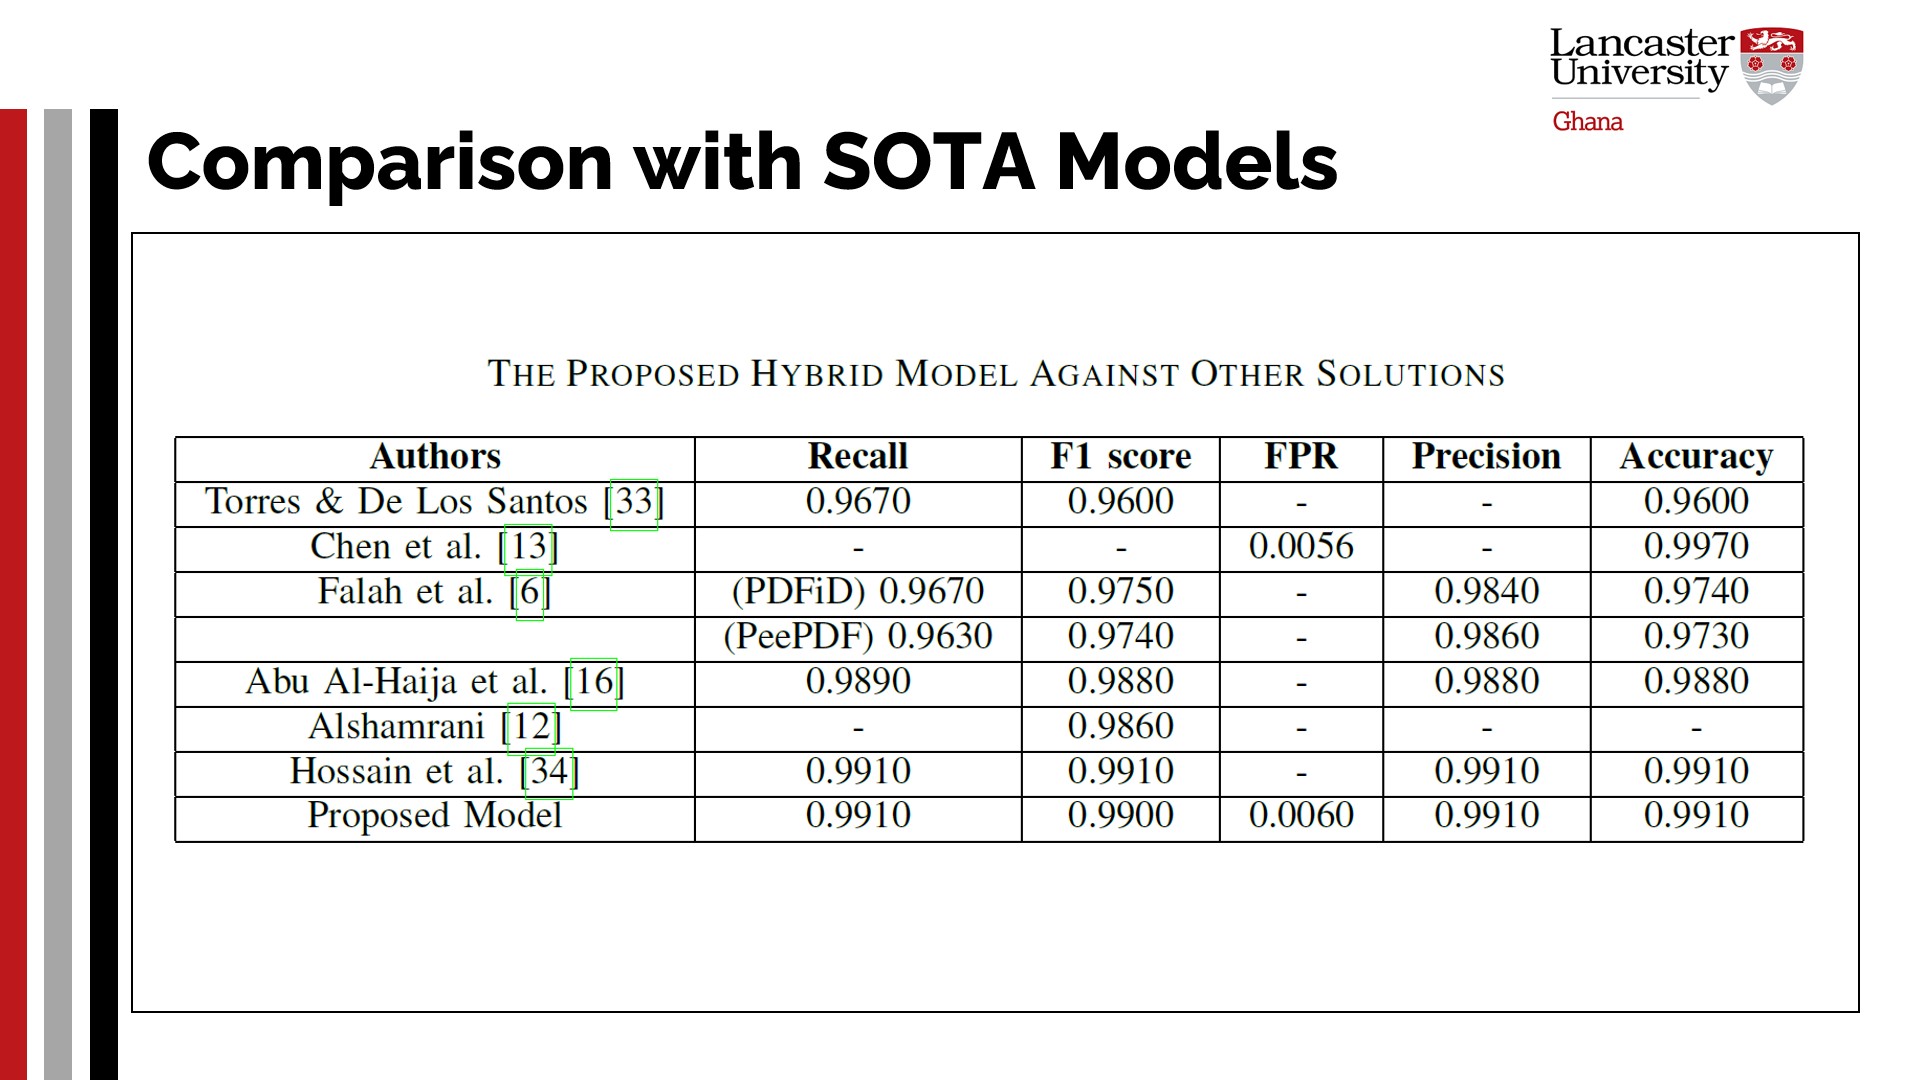 |
Torres and De Los Santos [33] developed a privacy-enforced framework based on machine learning for detecting malicious PDF documents, with a focus on those containing embedded JavaScript code. The dataset consisted of 1,712 PDF samples collected from various sources. The table demonstrates that the proposed hybrid solution outperformed theirs across all metrics, including the ROC (0.98).
Chen et al. [13] employed a novel distance metric for PDF tree structures and state-of-the-art verifiably robust training methods. However, Chen et al. [13] only addressed simple robustness properties and ignored more complex ones that could have led to stronger security guarantees. Additionally, their most optimal solution, Robust A+B, is seen to have performed negligibly better than the proposed one, despite using a few metrics for its evaluation.
Falah et al. [6] enhanced feature engineering and data-driven mechanisms to combine features from PDFiD and PeePDF analysis tools, along with derived complementary features. With samples from VirusTotal, they evaluated their approach, with RF standing as the most efficient. However, the proposed CNN+ViT architecture steadily outperformed it. The same can be said for the works of Abu Al-Haija et al. [16] and Alshamrani [12], even though Alshamrani [12] barely had enough metrics to compare with. The dataset employed by Abu Al-Haija et al. [13] is relatively older, thus providing the proposed solution with an additional edge.
Hossain et al. [34] developed a dataset comprising 15,958 PDF samples from which features were extracted for training ML algorithms. The random forest(RF) classifier performed very well on the combined feature set, as seen in the table. However, because it was trained and assessed using a larger and more recent dataset as well as a greater variety of metrics, the suggested approach is objectively superior. Yet the proposed study has led to the discovery of even fewer sets of features that can yield even better results across the necessary metrics.
|
| ICACT20260055 Slide.17
[Big Slide]
|
Chrome Click!! |
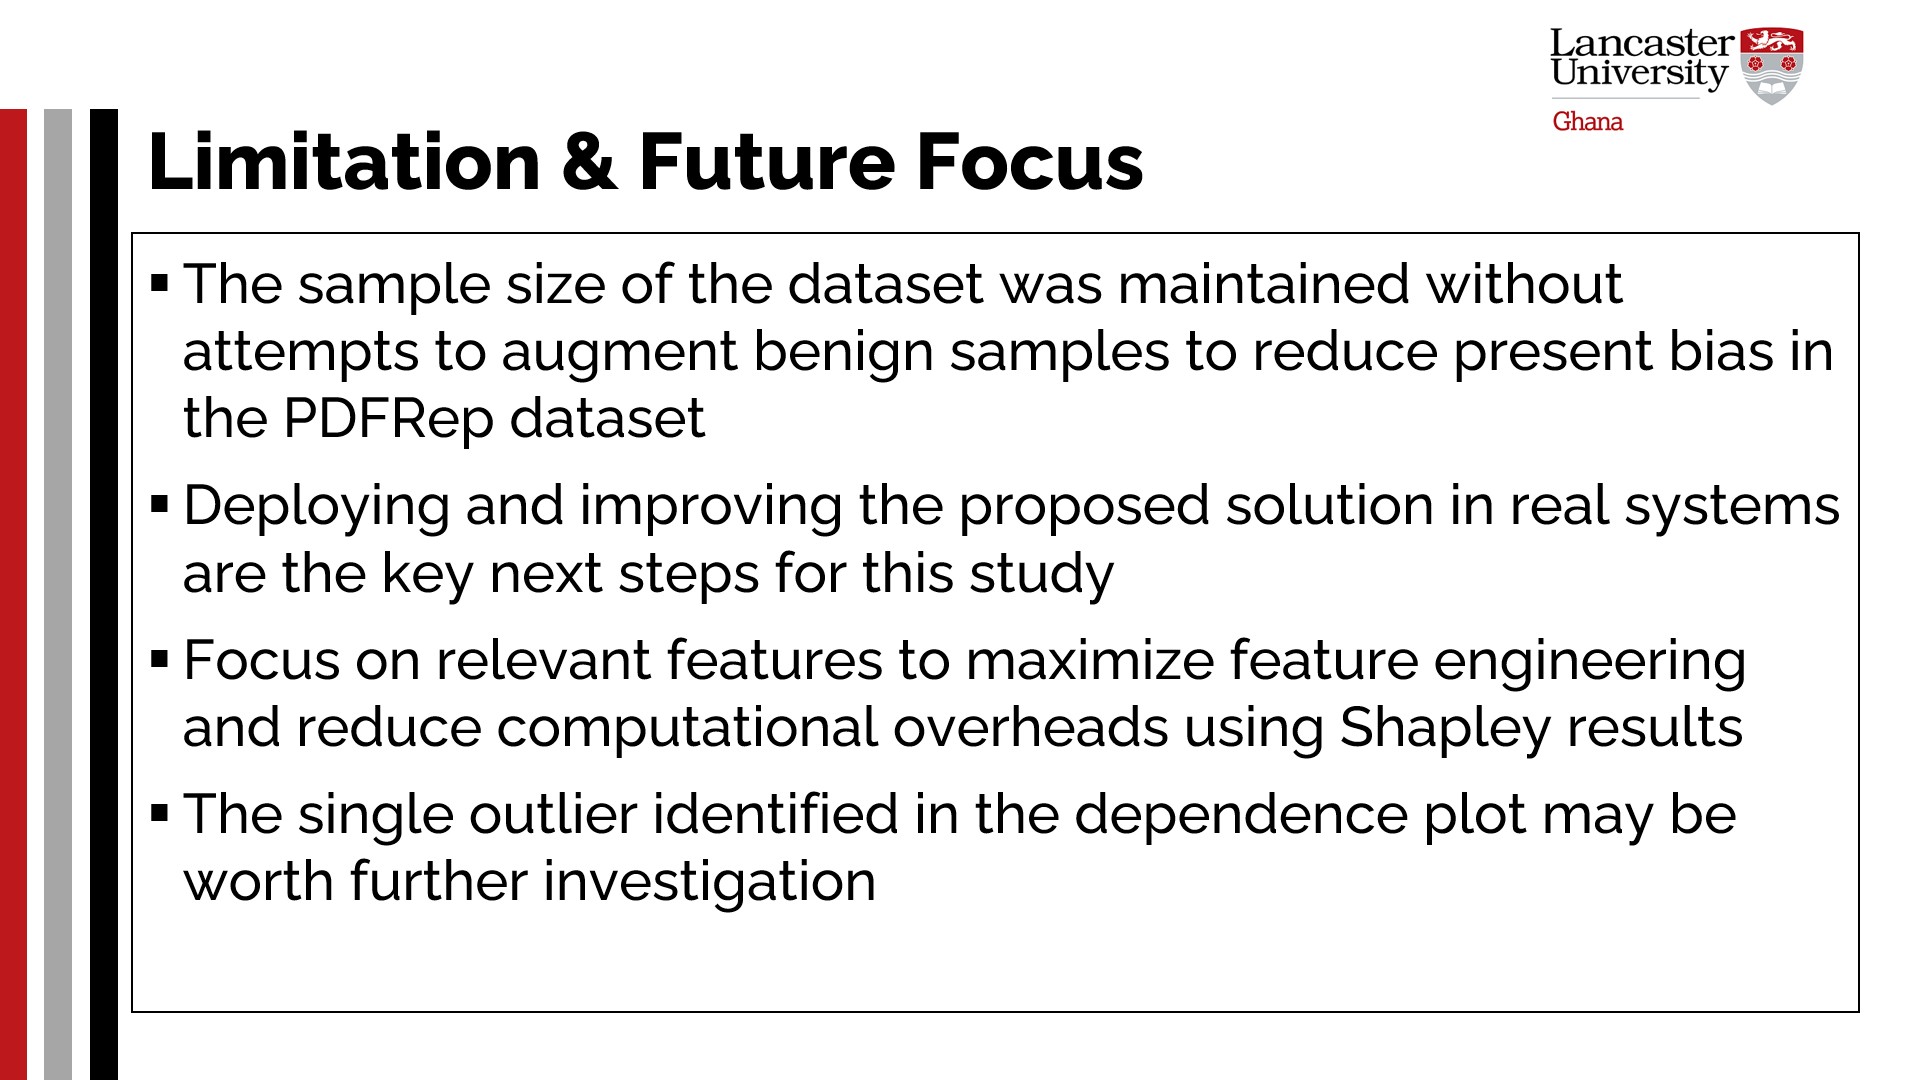 |
This study utilized only the PDFRep dataset for both model training and evaluation phases. Although various mechanisms against model overfitting were employed, the sample size of the dataset was maintained without attempts to augment benign samples to reduce present bias. Also, deploying and improving the proposed solution in real systems are the key next steps for this study. With the insights on predictor contributions streamlined, focus will be given to the most influential ones to maximize feature engineering and reduce computational overheads. Finally, the single outlier identified in the dependence plot may be worth further investigation.
|
| ICACT20260055 Slide.18
[Big Slide]
|
Chrome Click!! |
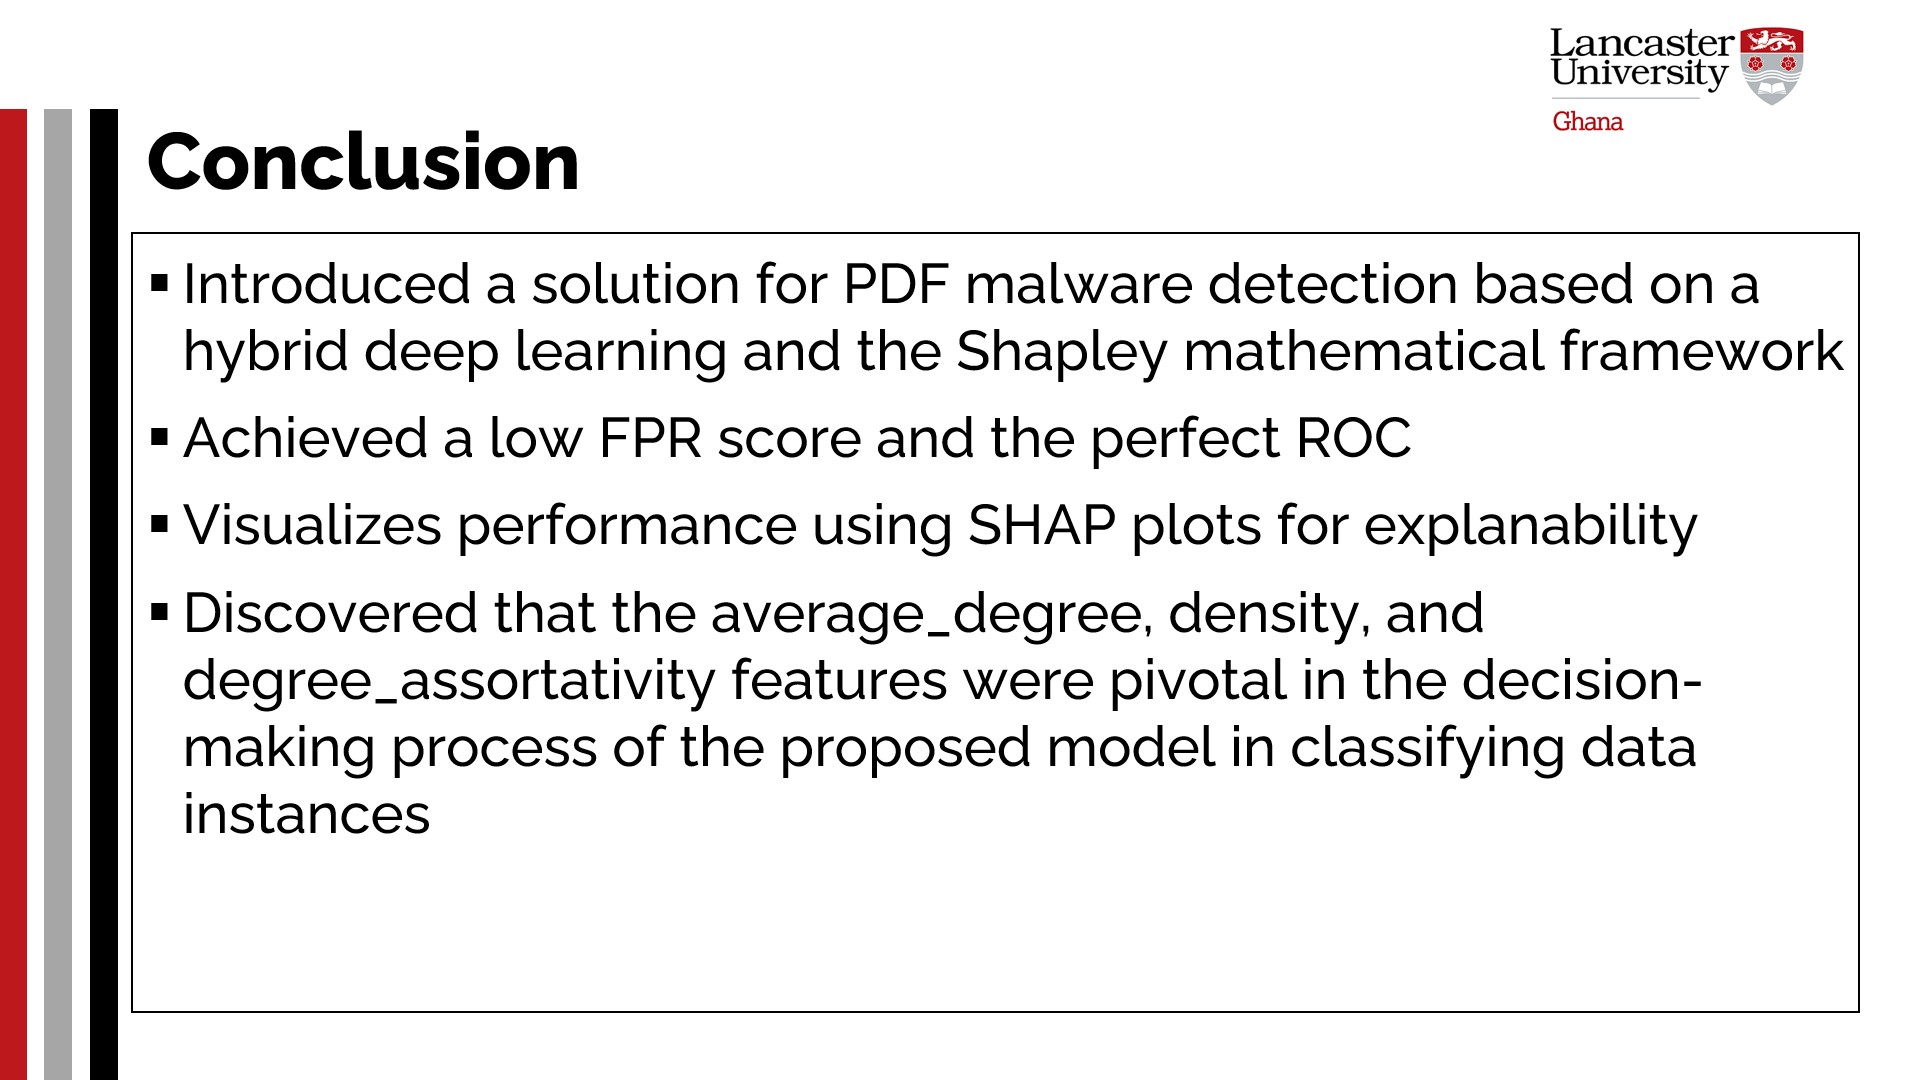 |
The study introduced a solution against PDF malware, which proved to be reliable and consistent in making accurate predictions. This is assured by the low FPR score and the perfect ROC area score it recorded. Several SHAP plots were employed to visualize and help explain how the proposed hybrid model arrived at its predictions. It was revealed that the avg_degree, density, and degree_assortativity features were very potent in the model’s decision-making process in classifying data instances. Some other features, such as num_edges} and depth, were found to make only a minor contribution. Additionally, it was found that each feature had a greater impact on one class than on the other. The study also proved the relationship between specific features and how the rise in one made the other more positively influential. This further demonstrates that the model primarily relied on specific predictors to make decisions.
|
| ICACT20260055 Slide.19
[Big Slide]
|
Chrome Click!! |
 |
Some key references used in this presentation.
|
| ICACT20260055 Slide.20
[Big Slide]
|
Chrome Click!! |
 |
Some key references used in this presentation.
|
| ICACT20260055 Slide.21
[Big Slide]
|
Chrome Click!! |
 |
Any questions for me? |
| ICACT20260055 Slide.22
[Big Slide]
|
Chrome Click!! |
 |
Thank you for your time. |
| |





