Now 5071 visitors
Today:0 Yesterday:0
Total: 147068
212S 50P 4R
2026-10-20, Week 43 |
| Member Login |
| TACT Journal Homepage |
| Call for Paper |
| Committee |
| Find My Paper |
| Author Homepage |
| Statistics & History |
| Welcome Message |
| Paper Procedure |
| FAQ |
| Paper Archives |
| Outstanding Papers |
| Author Homepage |
| - Paper Procedure |
| - Journal Procedure |
| - Presentation Tips |
|
| Program & Proceedings |
| Program with Papers |
| Plenary Session |
| Tutorial Session |
|
| Presentation Platform |
| Hotel & Travel Info |
| About Korea |
| Accommodation |
| Transportation |
| VISA |
| Other Infomation |
|
| Photo Gallery |
| Scheduler Login |
| Seminar |
| Archives Login |
|
| Sponsors |

|

|

|

|

|

|

|

|

|

|
|
|
|
|
 ICACT20260091 Slide.01
[Big Slide] |
Chrome  Click!! |
 |
Good morning everyone. Our team of authors is from the 5G Network Research Group at Viettel. I am Vinh Tran, representing the authors of the paper "NWDAF Implementation: Addressing Ping-Pong Issues in 5G Networks for Abnormal Behavior Analytics". Today, I will be presenting the contents of our paper in this conference session. |
| ICACT20260091 Slide.02
[Big Slide]
|
Chrome Click!! |
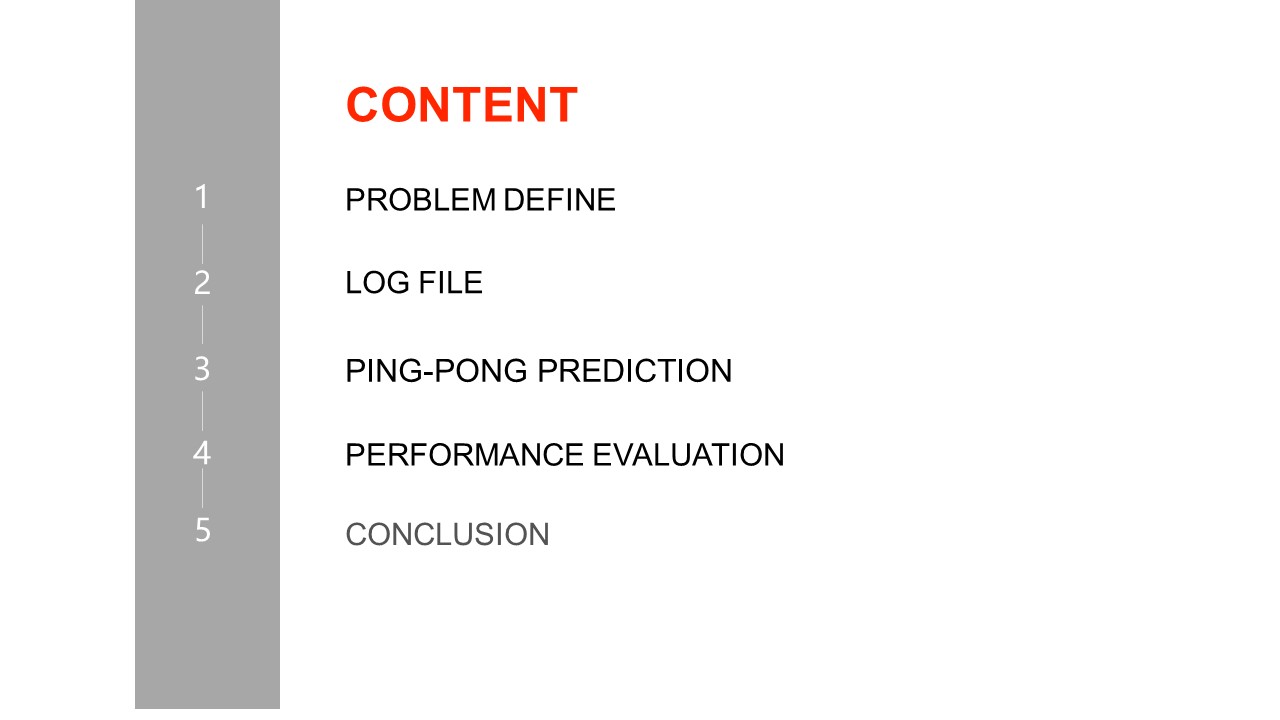 |
This slide outlines the structure of my presentation. First, I will briefly introduce the problem background and motivation. Second, I will present the theoretical foundation of the proposed approach. Then, I will describe the model design and training process in detail. After that, I will explain how the model is applied to anomaly detection in practice. Finally, I will conclude with the main contributions and future directions.
|
| ICACT20260091 Slide.03
[Big Slide]
|
Chrome Click!! |
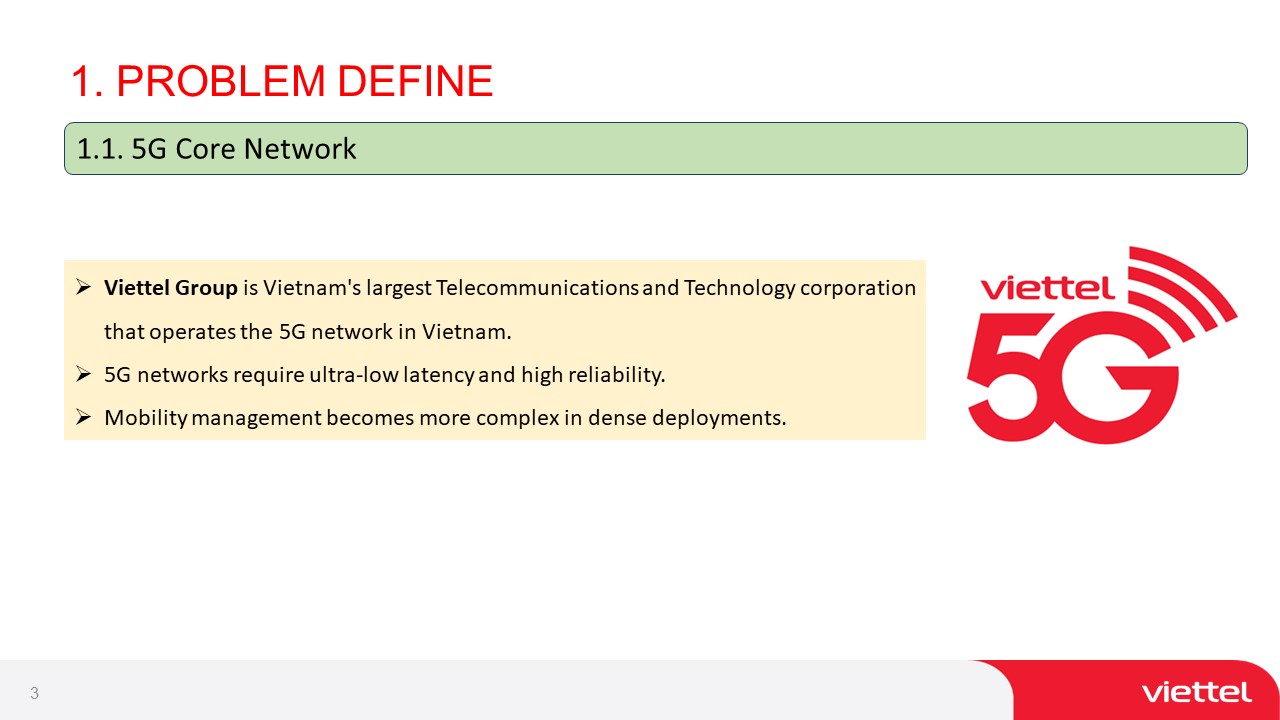 |
First, its important to note that Viettel Group is Vietnams largest telecommunications and technology corporation operating the 5G network nationally. As 5G rolls out more extensively, the demands on the network are increasing.
5G networks require ultra-low latency and high reliability to support advanced applications. However, mobility management becomes more complex in these dense 5G deployments with frequent handovers.
This sets the stage for why analyzing abnormal behavior is critical - to ensure 5G performance is not degraded by issues like excessive ping-pongs between cells. Our research aims to tackle this challenge head-on through intelligent analytics in the NWDAF.
|
| ICACT20260091 Slide.04
[Big Slide]
|
Chrome Click!! |
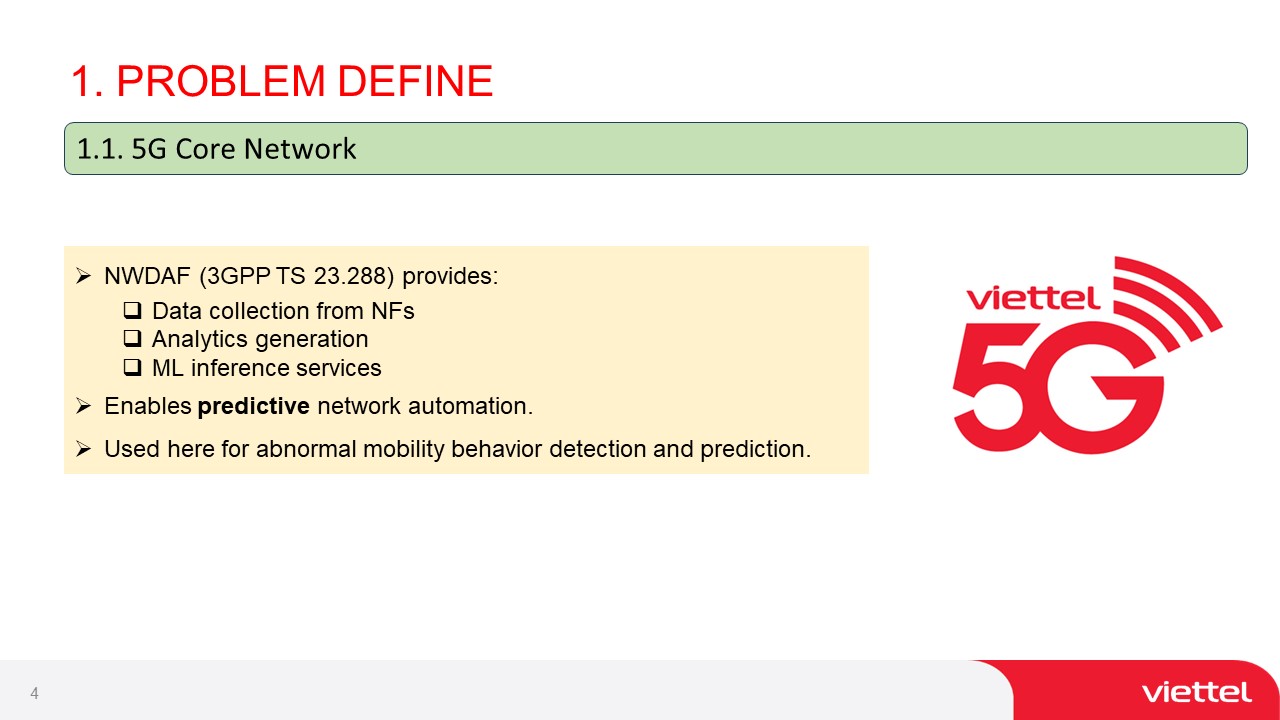 |
For addressing abnormal mobility behavior in 5G networks - the Network Data Analytics Function, or NWDAF, as defined in 3GPP TS 23.288.
The NWDAF provides critical capabilities:
First, it collects data from various network functions.
Second, it generates analytics based on this data.
Third, it offers machine learning inference services.
Taken together, these NWDAF capabilities enable predictive network automation. This is precisely what we leverage in our research to detect and predict abnormal mobility behavior like excessive ping-pongs between cells.
By using the NWDAF as the central brain for analyzing network data with ML models, we can intelligently optimize the 5G network in real-time, ensuring seamless mobility and high performance.
|
| ICACT20260091 Slide.05
[Big Slide]
|
Chrome Click!! |
 |
Now lets dive into the specific problem we are tackling - the ping-pong issue in 5G networks.
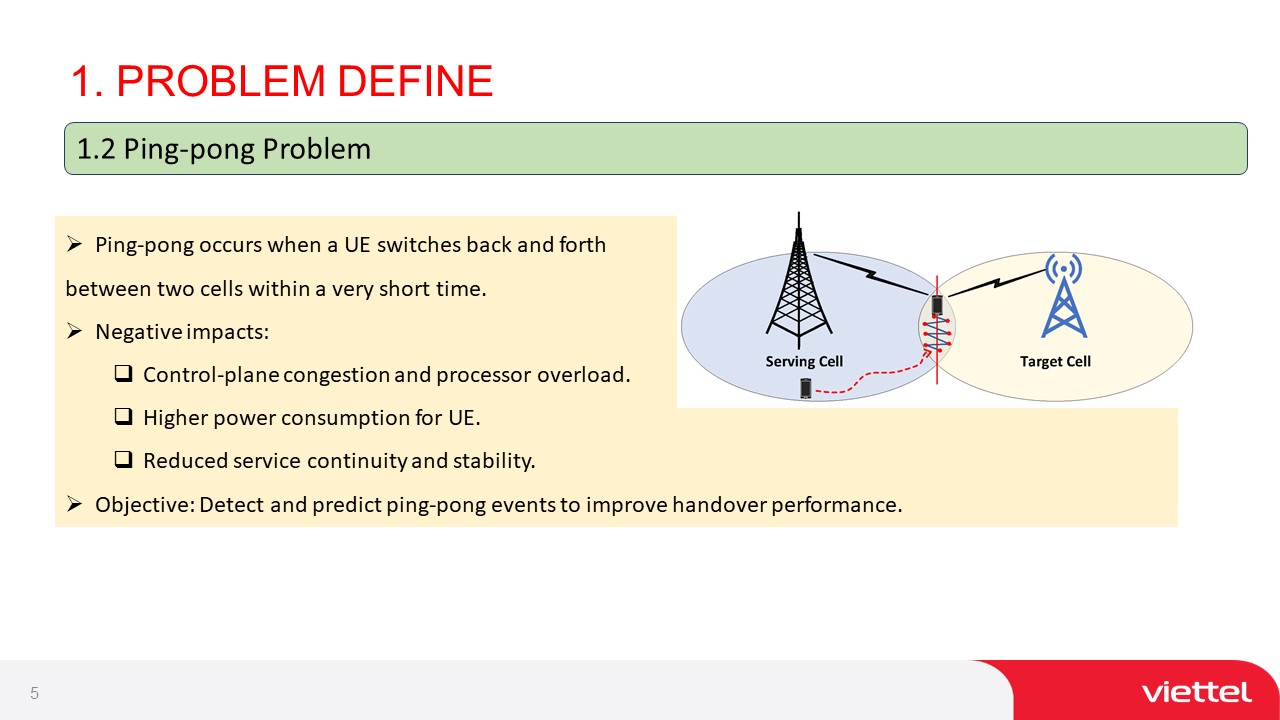
Ping-pong occurs when a User Equipment, or UE, switches back and forth between two cells within a very short time, as shown in the diagram. The UE bounces between the serving cell and target cell rapidly, like a ping-pong ball.
This ping-ponging has several negative impacts on network performance and user experience:
First, it causes control-plane congestion and processor overload, straining the network. Second, the constant handovers lead to higher power consumption for the UE, draining battery faster. Third, ping-ponging reduces service continuity and stability, leading to dropped connections.
Our objective is to detect and predict these ping-pong events using NWDAF analytics, so we can take proactive steps to improve handover performance. By minimizing unnecessary ping-pongs, we can ensure a smoother, more seamless 5G experience for users.
|
| ICACT20260091 Slide.06
[Big Slide]
|
Chrome Click!! |
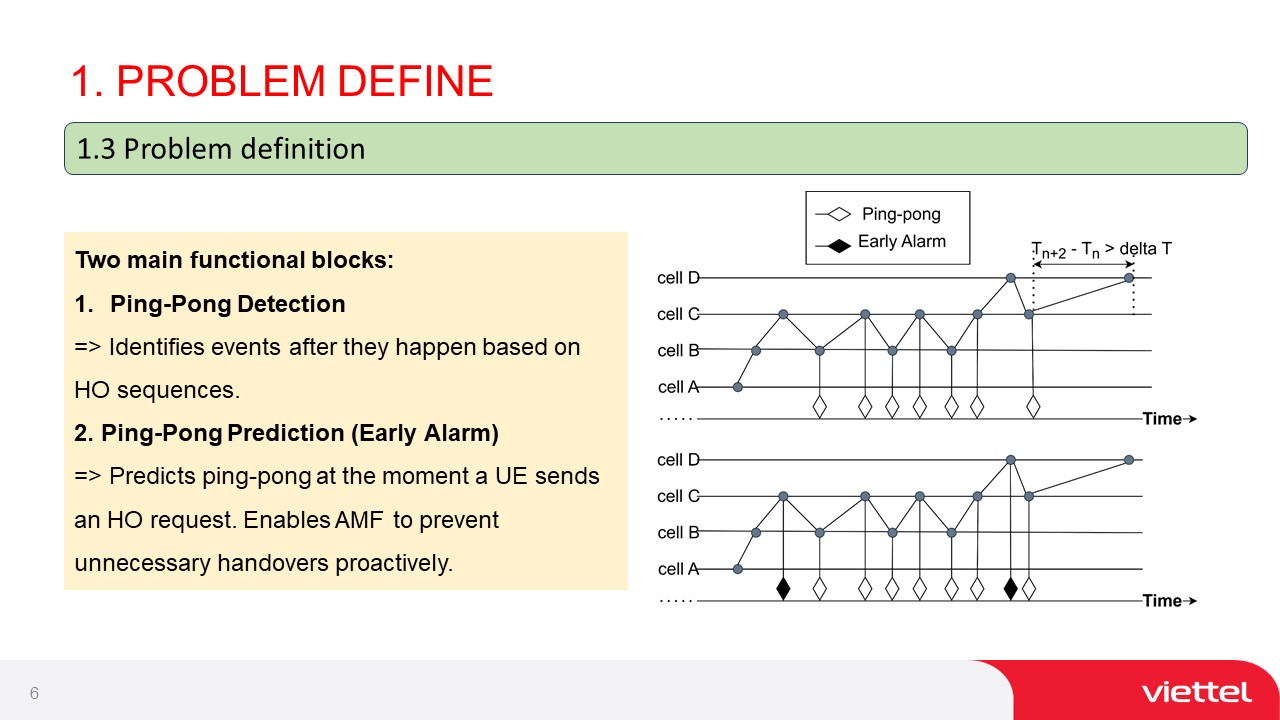 |
Slide 6, provides a clear problem definition for our ping-pong research. It highlights the two main functional blocks we developed:
Ping-Pong Detection: This block identifies ping-pong events after they happen based on handover sequences. The graph on the right shows an example of a ping-pong pattern, where the UE rapidly switches between cells A, B, C, and D within a short time window. Our detection algorithm captures these patterns.
Ping-Pong Prediction (Early Alarm): The second block is about predicting ping-pongs at the moment a UE sends a handover request. The bottom graph illustrates this - just as the UE is about to ping-pong, our algorithm raises an early alarm. This enables the Access and Mobility Management Function (AMF) to prevent unnecessary handovers proactively.
By breaking down the problem into these two distinct phases - reactive detection and proactive prediction, our approach provides a comprehensive solution for mitigating ping-pong events and their negative impacts on 5G network performance and user experience.
|
| ICACT20260091 Slide.07
[Big Slide]
|
Chrome Click!! |
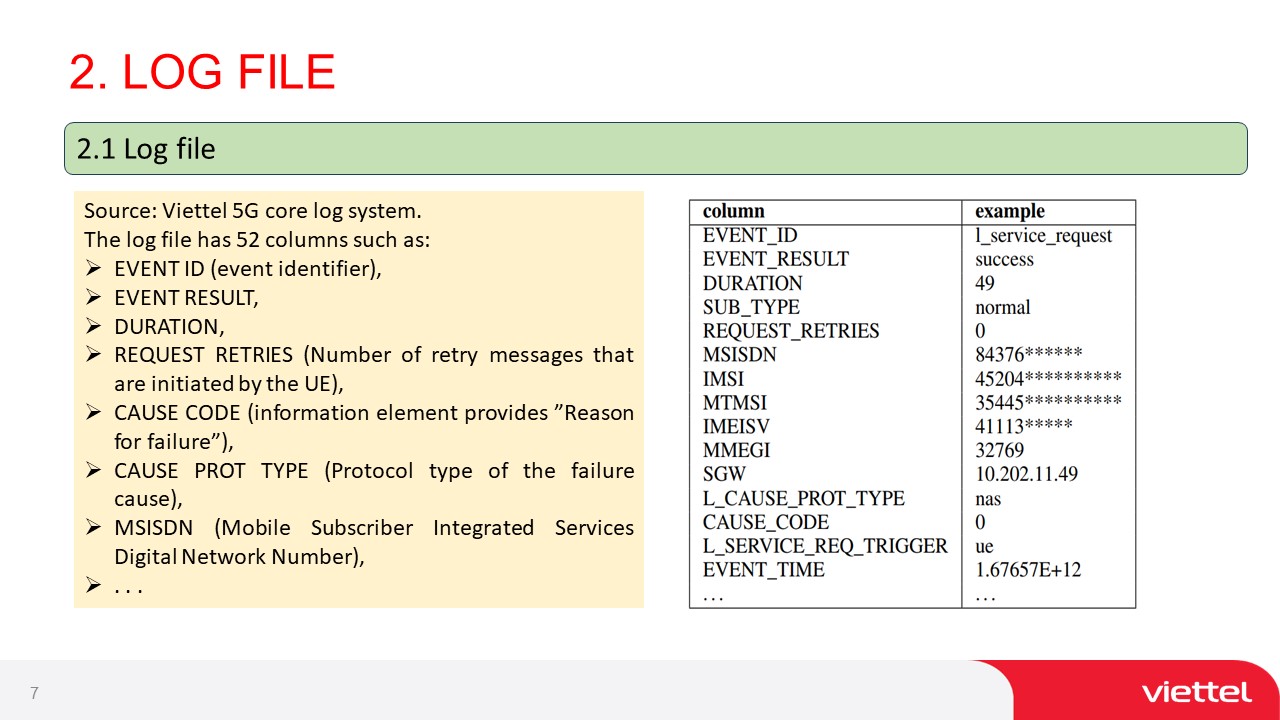 |
These logs, sourced from Viettels 5G core system, contain rich information about network events and performance. Key fields include the event identifier, result, duration, number of retry messages, cause codes, and more.
By mining these detailed logs, we were able to extract the critical data needed to develop our ping-pong detection and prediction algorithms. The comprehensive event records provided the foundation for our data-driven approach to optimizing 5G mobility management.
|
| ICACT20260091 Slide.08
[Big Slide]
|
Chrome Click!! |
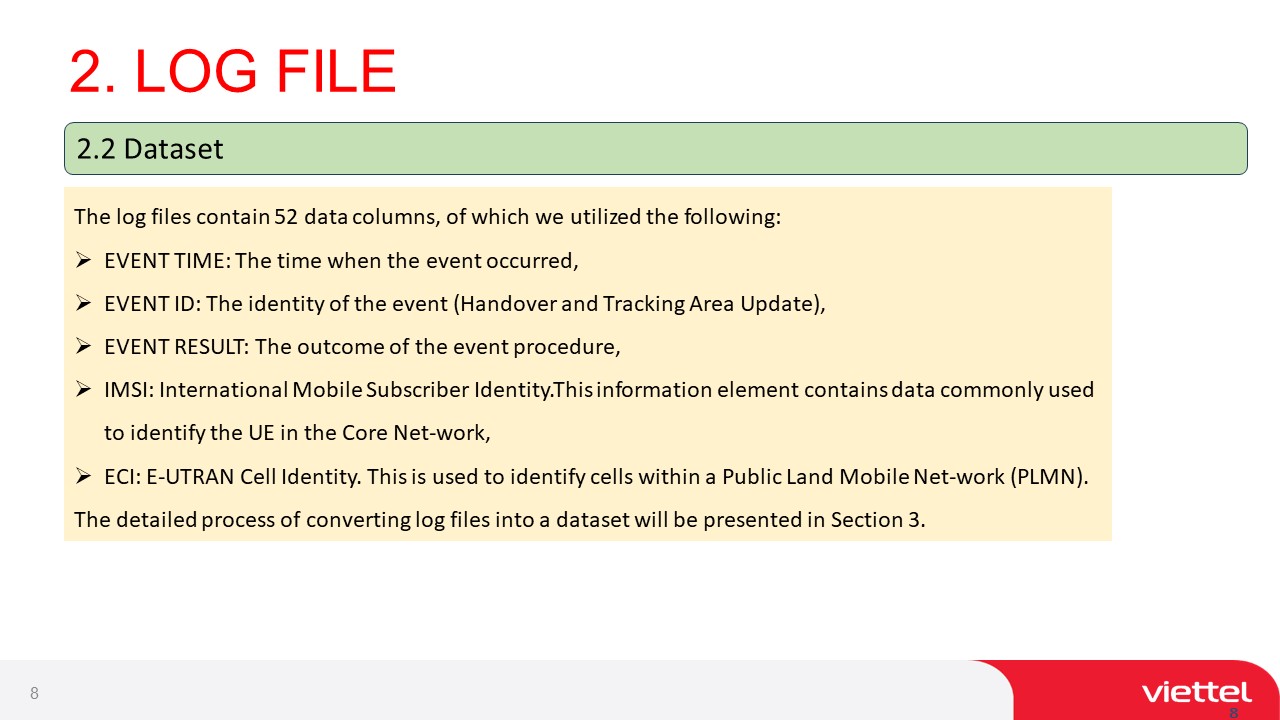 |
From the 52 available data columns, we utilized the following key fields:
EVENT TIME: Capturing when each event occurred
EVENT ID: Identifying the specific handover or tracking area update event
EVENT RESULT: Recording the outcome, such as success or failure
IMSI: The unique subscriber identifier, crucial for tracking UE mobility
ECI: The E-UTRAN Cell Identity, used to pinpoint the cells involved in each event
By honing in on these essential data points, we were able to construct a targeted dataset optimized for detecting and predicting ping-pong behavior.
The process of transforming the raw logs into this curated dataset will be detailed in the next section, where well dive into our data preprocessing pipeline.
|
| ICACT20260091 Slide.09
[Big Slide]
|
Chrome Click!! |
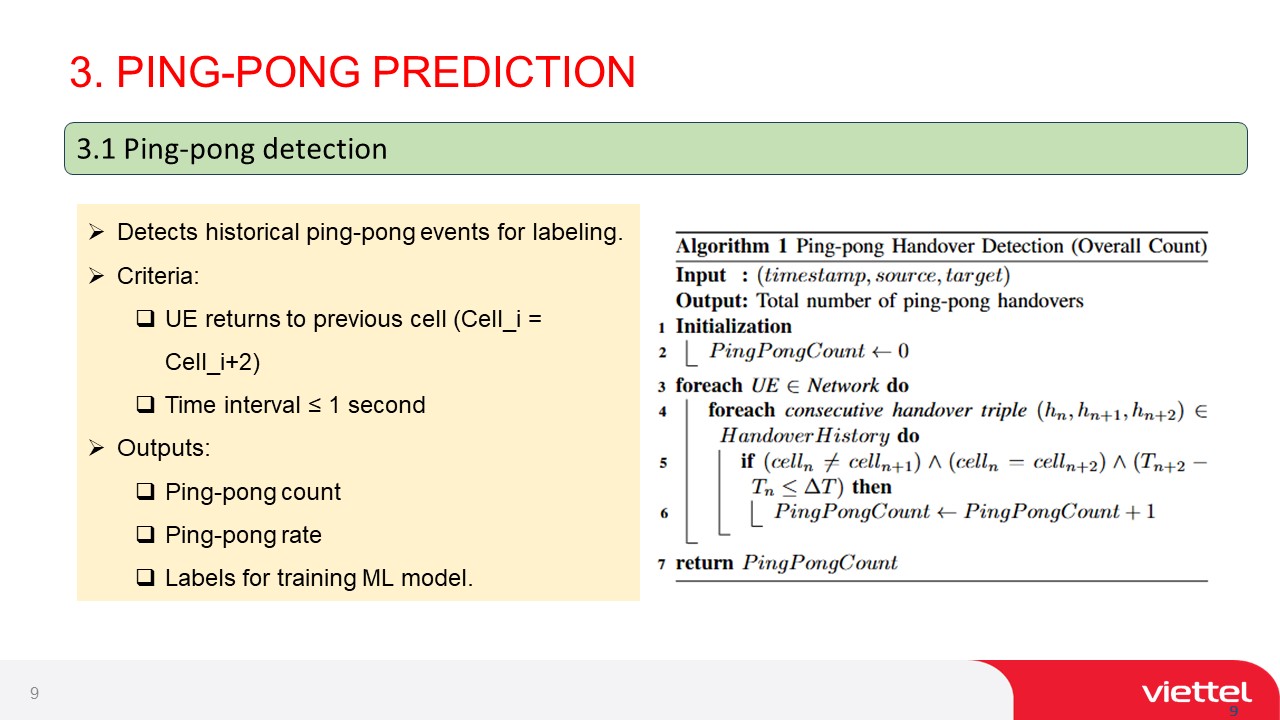 |
Moving on to slide 9, we dive into the details of our ping-pong detection algorithm. This algorithm is designed to identify historical ping-pong events for labeling our dataset.
The key criteria for detecting a ping-pong are:
The UE returns to the previous cell within a short time interval, which we set as 1 second.
The cell identifier pattern is Cell_i, followed by Cell_i+2, then back to Cell_i.
The algorithm takes in a timestamp, source cell, and target cell for each handover event. It then scans through the handover history for each UE, looking for the specific pattern of cell changes that indicate a ping-pong.
The outputs of the algorithm include the ping-pong count, ping-pong rate, and labels for training our machine learning model. By running this detection algorithm on our historical data, we can generate a labeled dataset for building our predictive model.
|
| ICACT20260091 Slide.10
[Big Slide]
|
Chrome Click!! |
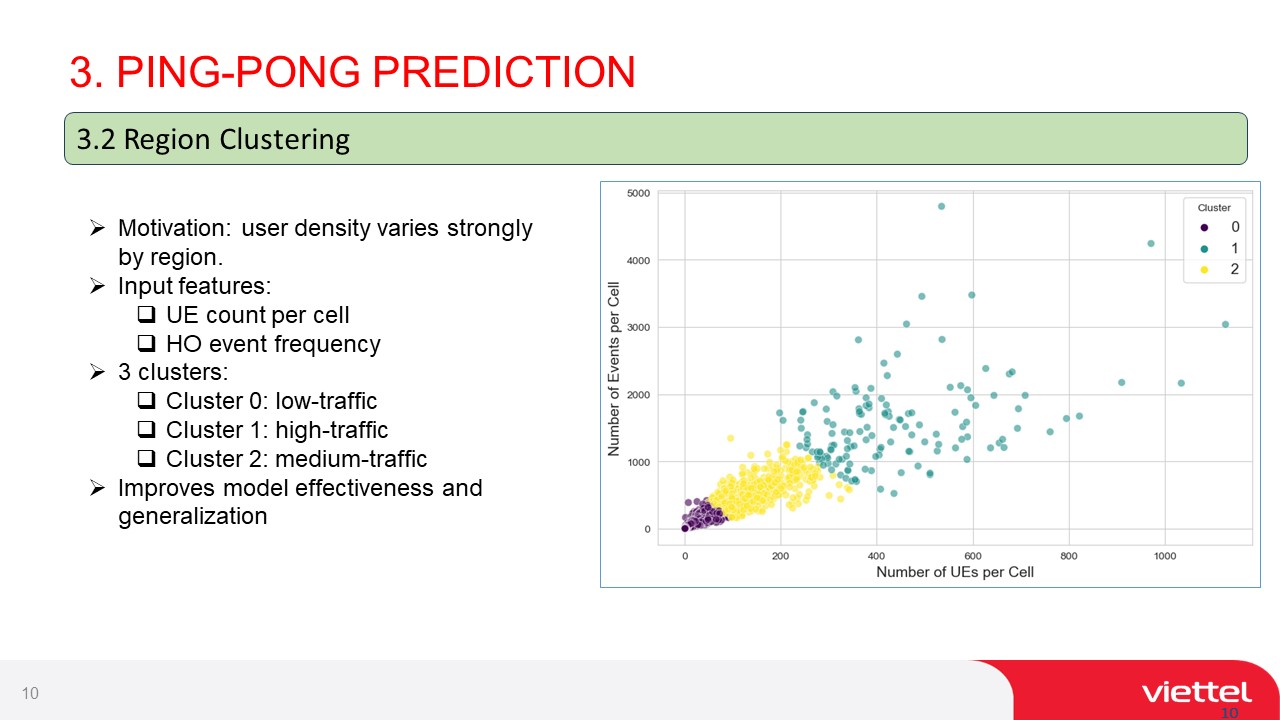 |
The motivation for region clustering stems from the fact that user density varies strongly by region. Some areas have high concentrations of users, while others are more sparsely populated.
To capture these regional characteristics, we use two input features:
The UE count per cell, which reflects the number of active users in each cells coverage area.
The handover event frequency, which indicates the mobility dynamics in each region.
Based on these features, we identify three distinct clusters:
Cluster 0 represents low-traffic regions with fewer UEs and lower handover frequency.
Cluster 1 contains high-traffic, dense urban areas with many UEs and frequent handovers.
Cluster 2 captures medium-traffic suburban regions.
By incorporating these region clusters into our model, we can improve its effectiveness and generalization. The model learns to adapt its predictions based on the regional context, making it more accurate across diverse network environments.
|
| ICACT20260091 Slide.11
[Big Slide]
|
Chrome Click!! |
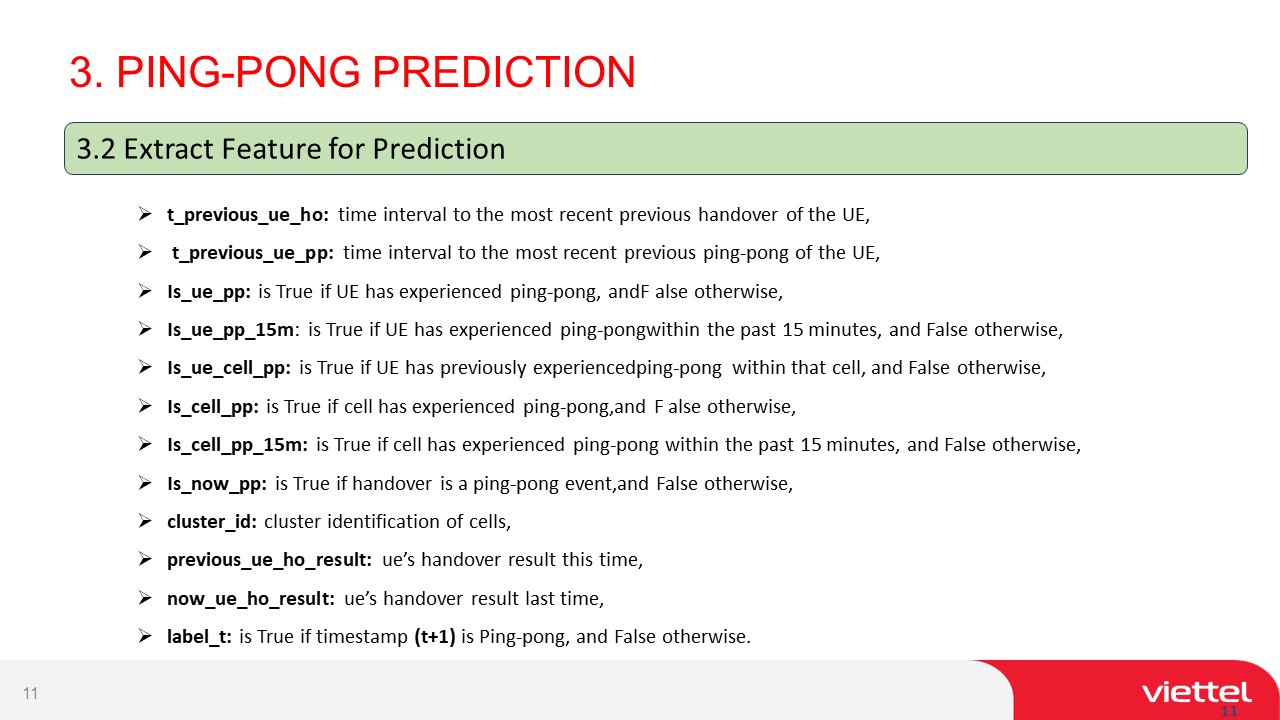 |
These features capture key temporal and spatial patterns that indicate a high likelihood of ping-pong events.
We engineer features based on the UEs handover history, such as the time intervals between previous handovers and ping-pongs. We also include boolean flags indicating if the UE has experienced ping-pong in the recent past, at various time scales.
Additionally, we incorporate cell-level features, such as cluster identification and previous ping-pong rates for the specific cells involved in the current handover.
By combining these rich historical and contextual signals, our model can learn complex patterns that presage ping-pong events. The next slide will show how we bring these features together into a cohesive prediction pipeline.
|
| ICACT20260091 Slide.12
[Big Slide]
|
Chrome Click!! |
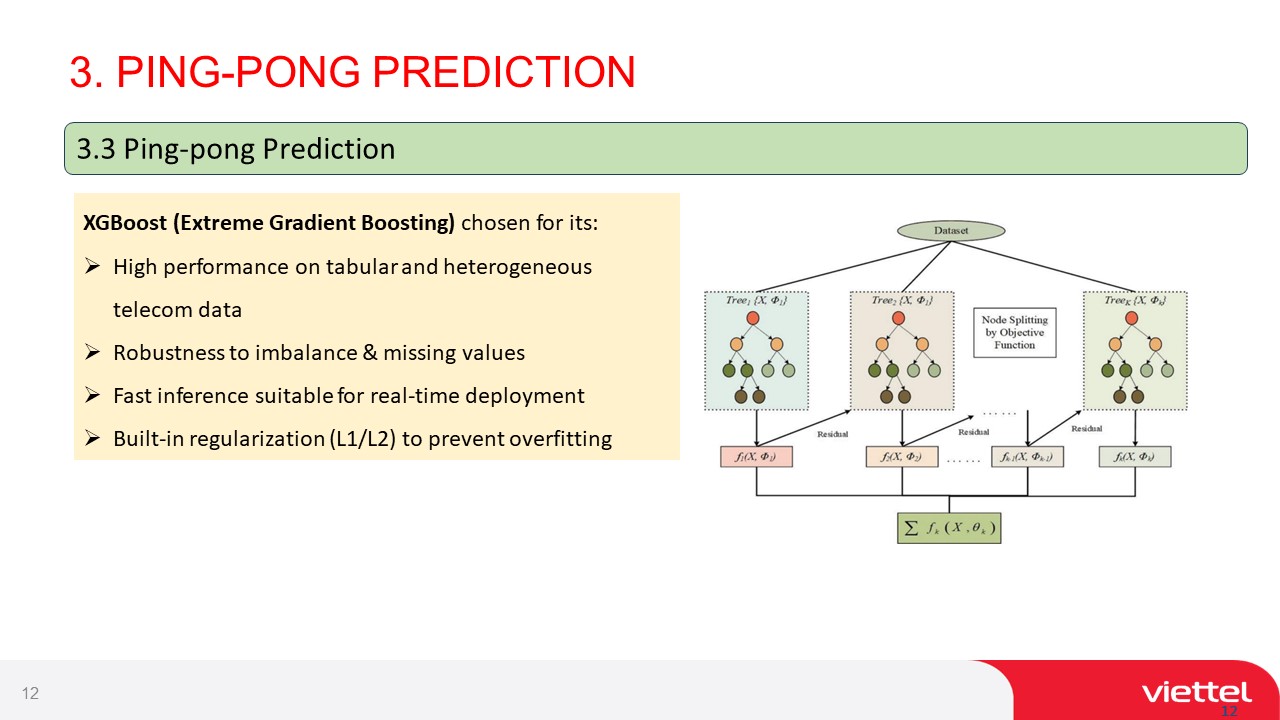 |
Slide 12 presents our chosen model for ping-pong prediction: XGBoost, or Extreme Gradient Boosting. We selected XGBoost for several key reasons:
First, it delivers high performance on tabular and heterogeneous telecom data. Our dataset includes a mix of numerical, categorical, and temporal features, which XGBoost handles effectively.
Second, XGBoost is robust to imbalance and missing values, common challenges in real-world data. It can learn from sparse datasets without extensive cleaning.
Third, the model enables fast inference, making it suitable for real-time deployment in the NWDAF. We need to generate predictions quickly as handover requests arrive.
Finally, XGBoost has built-in regularization with the L1/L2 parameters to prevent overfitting. This helps the model generalize well to new data.
The diagram illustrates the tree-based ensemble structure of XGBoost. The final prediction is the sum of outputs from a set of decision trees, each trained on the residuals of the previous trees. This gradient boosting approach allows the model to progressively refine its estimates and capture complex non-linear patterns.
With this robust and efficient prediction engine at the core of our NWDAF pipeline, we can provide timely intelligence to optimize handover decisions and mitigate ping-pong events proactively.
|
| ICACT20260091 Slide.13
[Big Slide]
|
Chrome Click!! |
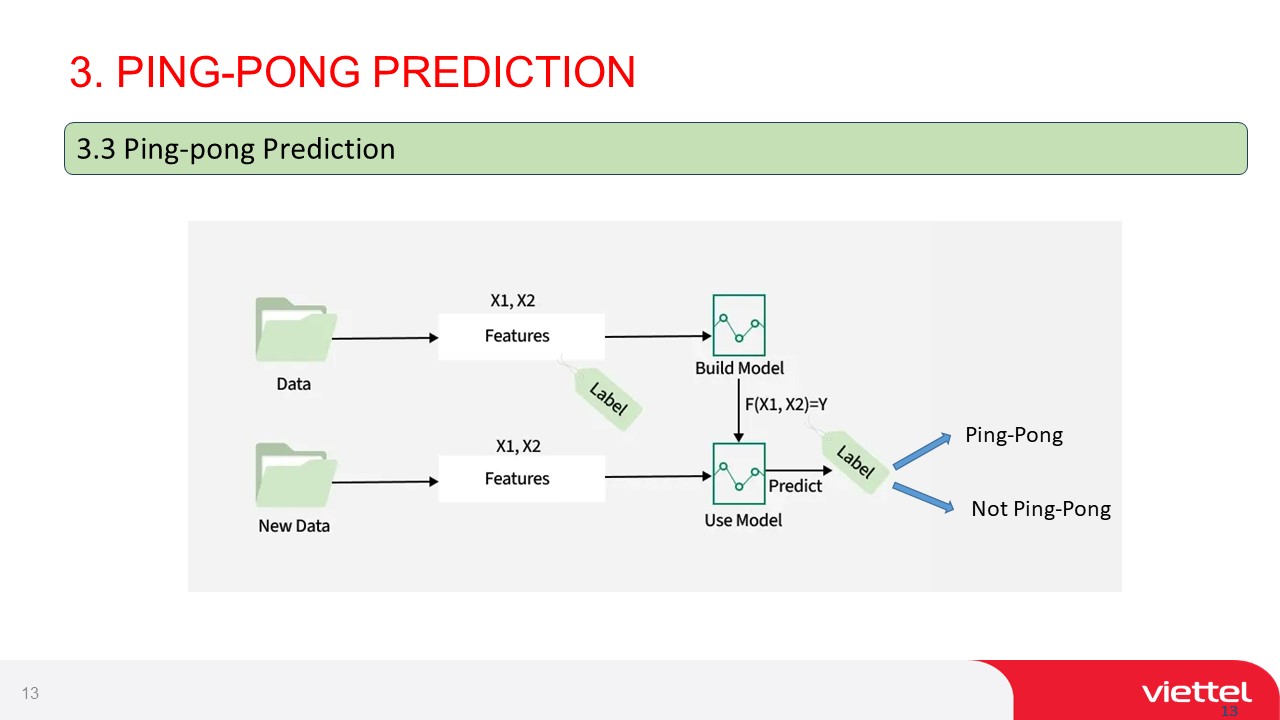 |
Slide 13 illustrates the end-to-end pipeline for our ping-pong prediction system. Lets walk through the key steps:
First, we have the data flow. Historical data is used to train the XGBoost model, while new incoming data is fed into the trained model for real-time prediction.
The feature engineering process is applied to both the historical and new data. This includes extracting the temporal, spatial, and contextual features we discussed earlier, such as handover intervals, cell identifiers, and cluster information.
Next, the XGBoost model is built using the historical data and corresponding ping-pong labels. The model learns the complex patterns and relationships between the input features and the likelihood of ping-pong events.
Finally, when a new handover request comes in, the trained model takes in the engineered features and outputs a prediction: either ping-pong or not ping-pong. This real-time prediction can then be used by the NWDAF to proactively optimize the handover process and prevent unnecessary ping-pongs.
By integrating this ML-driven prediction pipeline into the 5G network architecture, we enable a more intelligent and adaptive approach to mobility management. The NWDAF becomes a key enabler for delivering seamless, high-performance connectivity in dense, dynamic environments.
|
| ICACT20260091 Slide.14
[Big Slide]
|
Chrome Click!! |
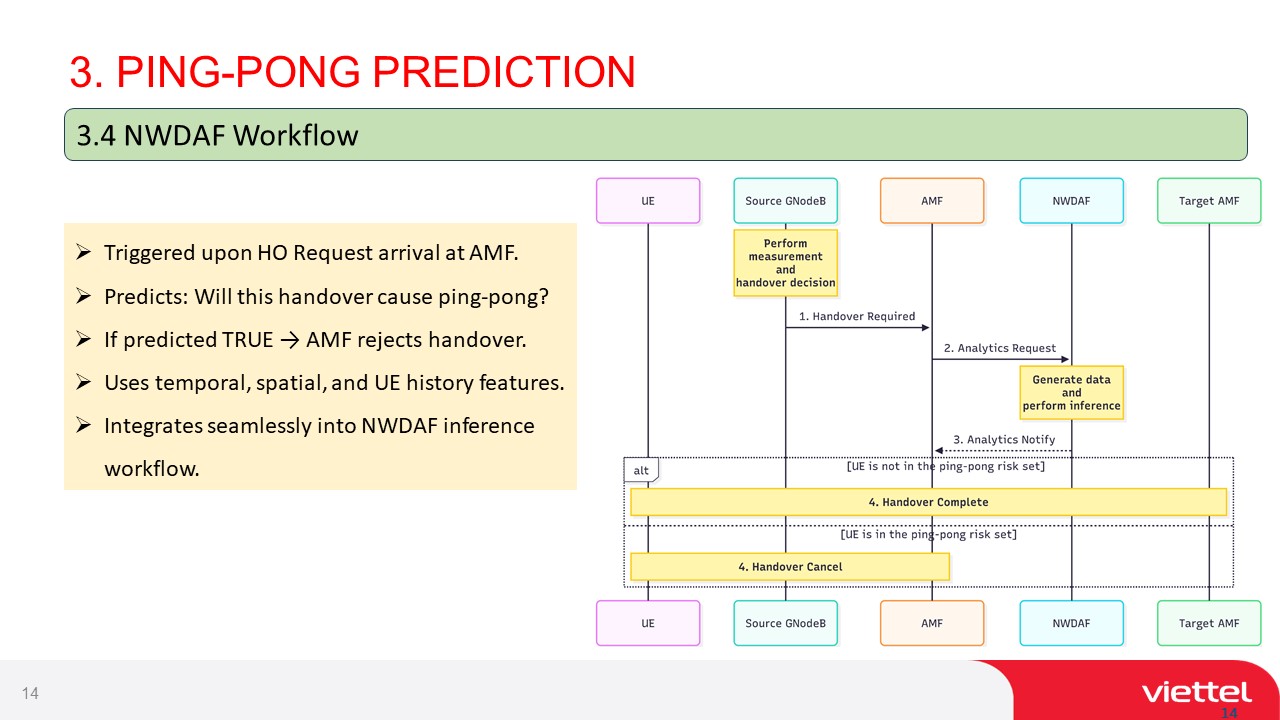 |
Slide 14 provides an overview of how our ping-pong prediction system integrates into the overall NWDAF workflow. Lets step through the process:
The workflow is triggered upon a handover request arrival at the AMF. The UE initiates the handover, which is then forwarded to the NWDAF for analysis.
The NWDAF performs measurement and handover decision tasks. It collects necessary data from the Source gNodeB and runs the prediction model.
Based on the models output, the NWDAF takes one of two actions:
If ping-pong is predicted, the NWDAF notifies the AMF, which then rejects the handover. This proactive rejection prevents unnecessary signaling and resource consumption.
If no ping-pong is predicted, the NWDAF allows the handover to proceed. It generates the relevant data and performs inference to optimize the handover process.
Once the handover is complete (or rejected), the NWDAF logs the outcome and updates its models for continuous learning and improvement.
This integrated workflow showcases the power of embedding ML intelligence into the 5G control plane. By leveraging the NWDAFs predictive insights, the network can make smarter, faster decisions about mobility management.
The end result is a more efficient, resilient, and adaptive network that proactively mitigates ping-pong effects and ensures seamless connectivity for end-users, even in challenging conditions. |
| ICACT20260091 Slide.15
[Big Slide]
|
Chrome Click!! |
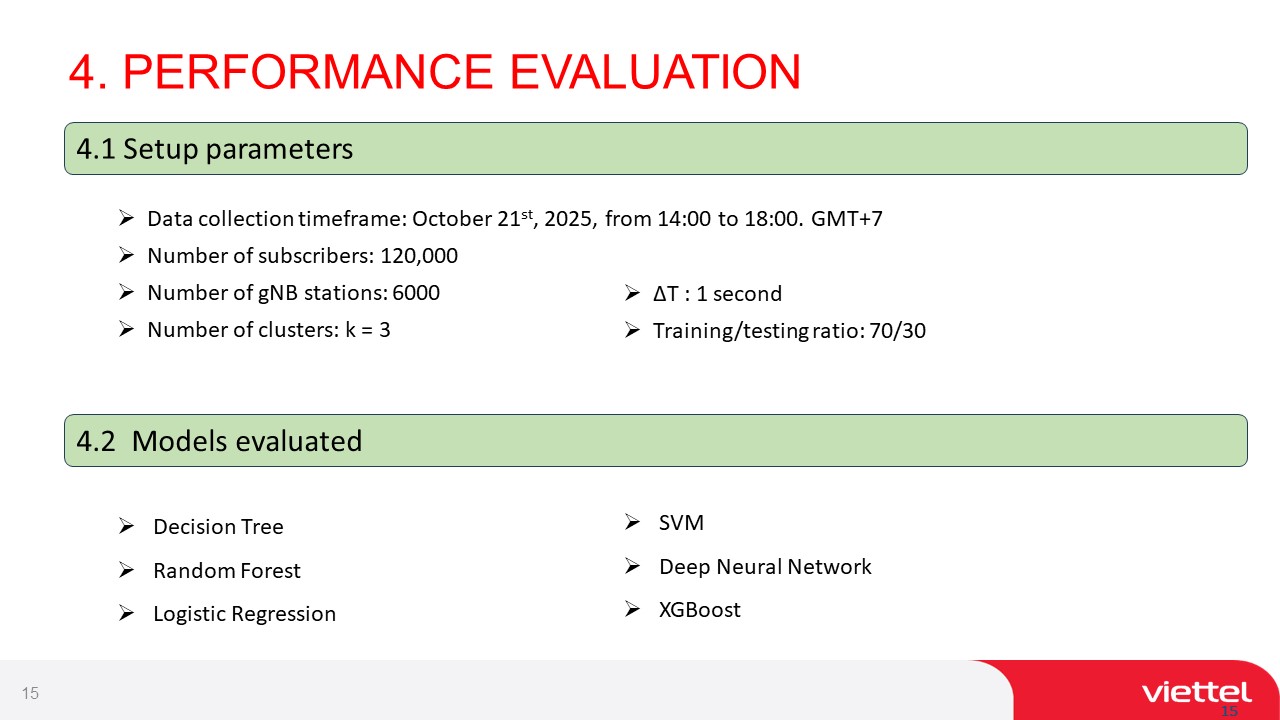 |
Slide 15 outlines the setup parameters and models used for evaluating our ping-pong prediction system. We collected data from 120,000 subscribers across 6000 gNB stations, clustered into 3 regions based on traffic patterns. Our models achieved strong performance, with XGBoost emerging as the top approach compared to SVMs, Deep Neural Networks, Decision Trees and Logistic Regression. |
| ICACT20260091 Slide.16
[Big Slide]
|
Chrome Click!! |
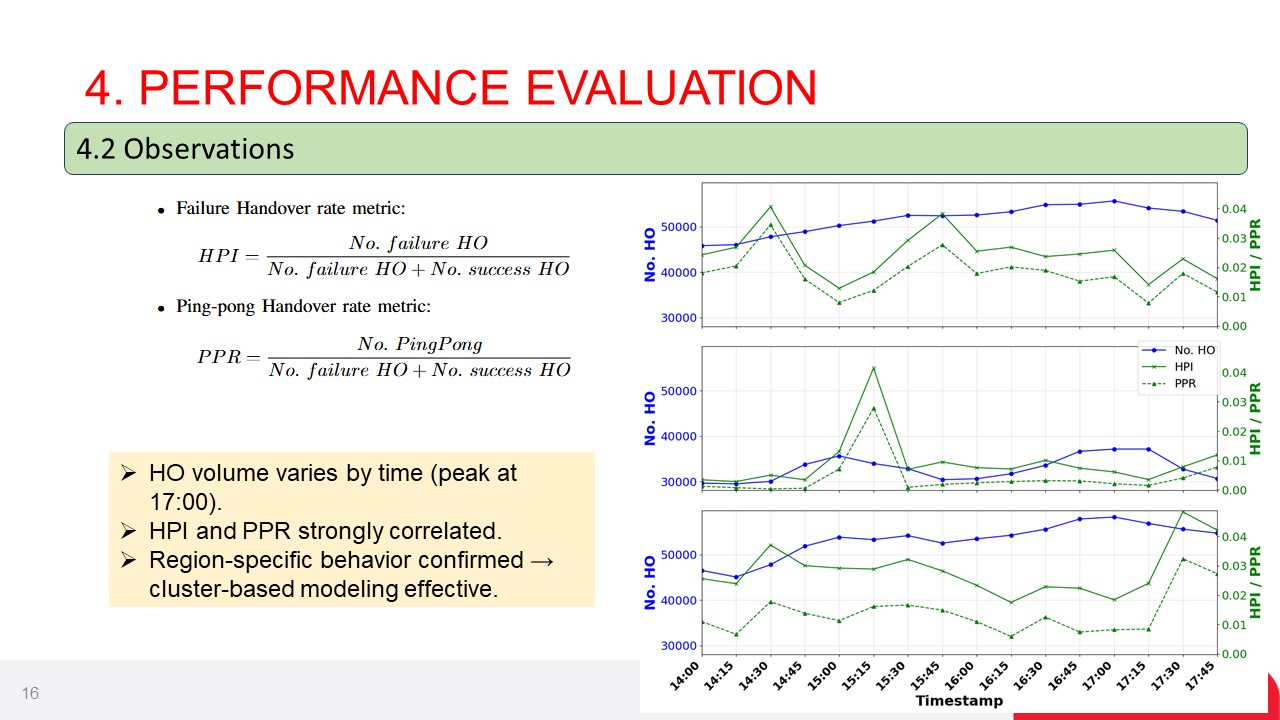 |
This slide focuses on exploratory data analysis, The key observations from slide 16 are:
Handover volume varies by time, peaking at 17:00. This likely aligns with typical commute patterns.
The Handover Failure rate (HFI) and Ping-Pong rate (PPR) metrics are strongly correlated across regions, suggesting that areas with higher ping-pong activity also tend to have more handover failures.
The region-specific patterns in the data confirm that mobility behavior varies by geographic context
|
| ICACT20260091 Slide.17
[Big Slide]
|
Chrome Click!! |
 |
Slide 17 presents the performance results for our ping-pong prediction models. The key findings are:
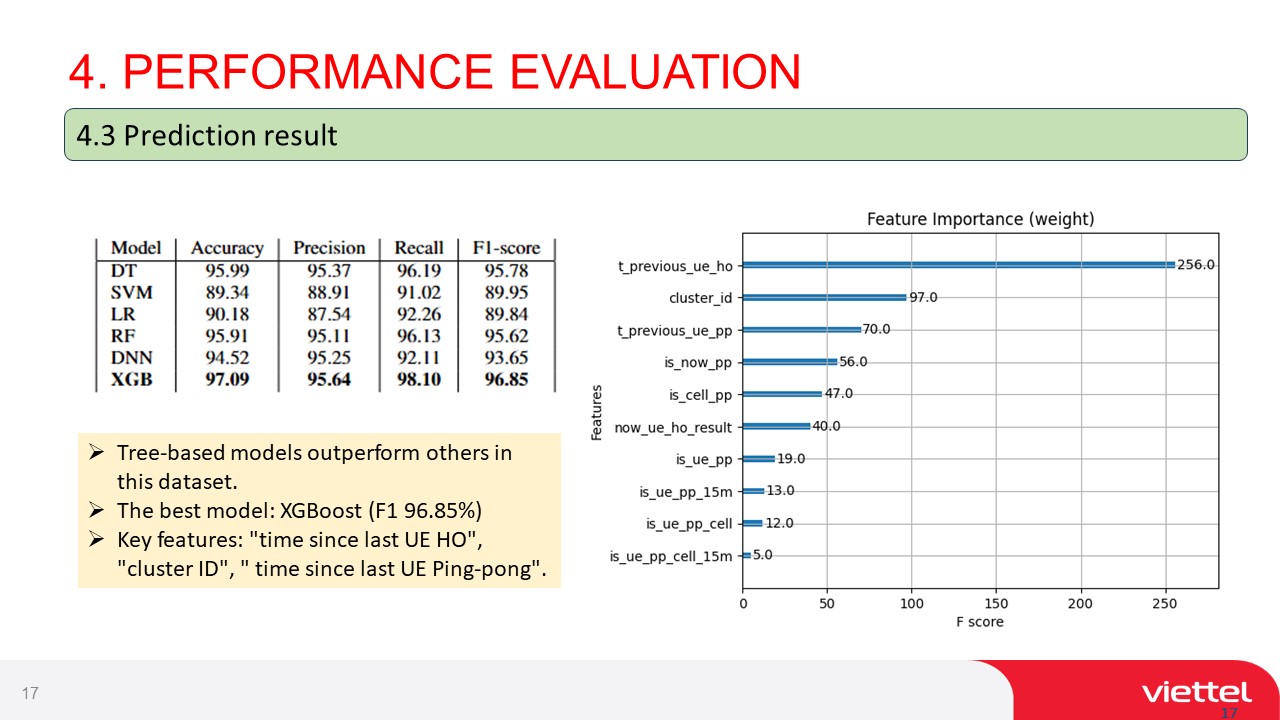
Tree-based models, particularly XGBoost, outperform other approaches like SVM, Logistic Regression, and Deep Neural Networks on this dataset. XGBoost achieves the highest F1 score of 96.85%.
The feature importance analysis reveals that temporal features like "time since last UE handover" and "time since last UE ping-pong" are among the most predictive variables.
Cluster-level features such as "cluster ID" also rank highly, confirming the value of region-specific modeling.
These results validate the effectiveness of our ML-driven approach to ping-pong prediction. By leveraging a diverse set of temporal, spatial, and contextual signals, the XGBoost model can accurately identify high-risk handovers and enable proactive mitigation.
The strong performance across key metrics like accuracy, precision, and recall demonstrates the systems readiness for real-world deployment in the NWDAF to optimize 5G mobility management at scale. |
| ICACT20260091 Slide.18
[Big Slide]
|
Chrome Click!! |
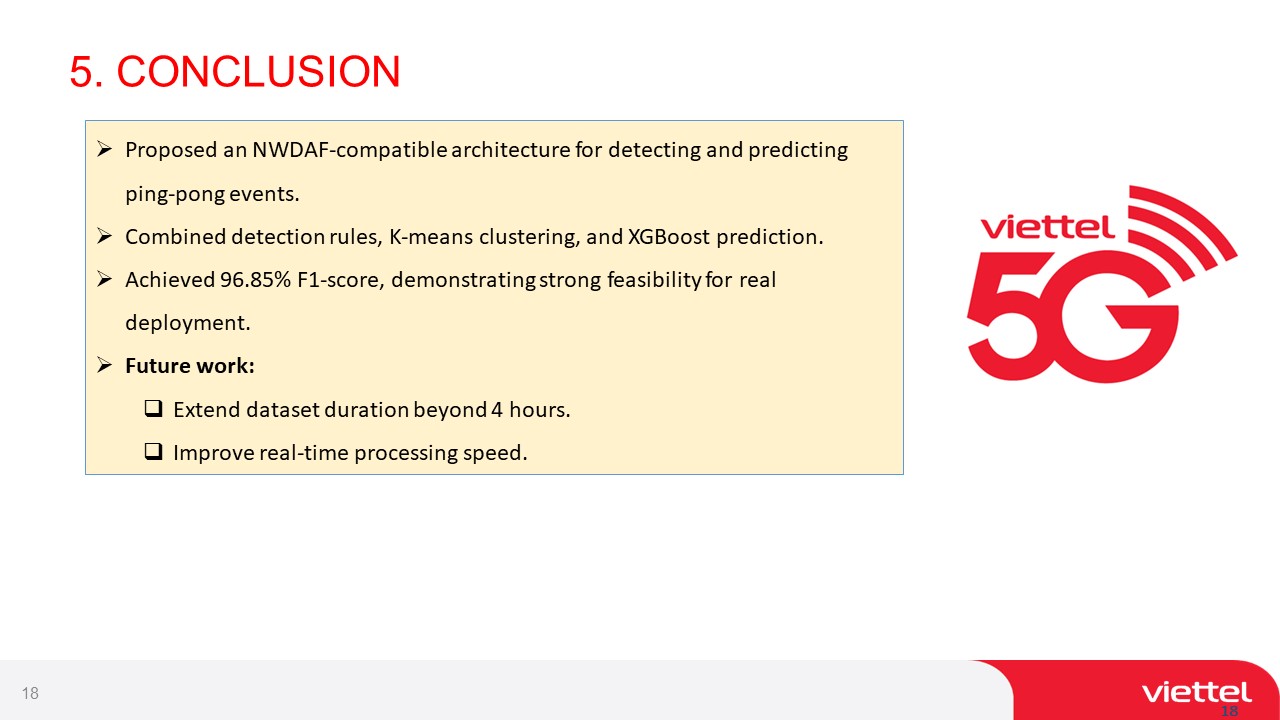 |
In conclusion, our research proposes an NWDAF-compatible architecture for detecting and predicting ping-pong events in 5G networks. The key takeaways are:
We combine detection rules, K-means clustering, and XGBoost prediction into a comprehensive solution. This multi-pronged approach leverages the strengths of each technique.
Our best model, XGBoost, achieves an impressive 96.85% F1-score on the test set. This demonstrates the feasibility and effectiveness of ML-driven ping-pong mitigation.
Critically, we show how this predictive system can integrate seamlessly into the 5G NWDAF workflow. By embedding intelligence into the handover process, we enable proactive optimization.
Looking ahead, we plan to extend the data collection duration beyond 4 hours to capture a wider range of network conditions. We also aim to improve real-time processing speed to ensure the system can keep pace with the millisecond-level demands of 5G.
Overall, this work represents a significant step towards self-optimizing, intelligent 5G networks. By harnessing the power of big data and machine learning, we can deliver a new level of service continuity and user experience. |
| ICACT20260091 Slide.19
[Big Slide]
|
Chrome Click!! |
 |
Thank you for your attention. Im happy to take any questions you may have about our research on detecting and predicting ping-pong events in 5G networks using the NWDAF. Please feel free to ask for clarifications or share your thoughts and feedback. I look forward to a productive discussion. |
| ICACT20260091 Slide.20
[Big Slide]
|
Chrome Click!! |
 |
Thank you for your attention. If you have any questions or would like to discuss our research on detecting and predicting ping-pong events in 5G networks further, please feel free to contact us via the emails provided below. We would be more than happy to have a deeper conversation. |
| |





