 ICACT20260100 Slide.01
[Big Slide] |
Chrome  Click!! |
 |
Good afternoon, my name is Hyunhee Kim. I am a master’s student of Public Safety and Big Data at Kyonggi University.
The title of the study we are presenting today is ‘A Relationship between Traffic Violation Types and Serious Traffic Accident Sites’.
|
| ICACT20260100 Slide.02
[Big Slide]
|
Chrome Click!! |
 |
To begin with, one of the major concerns for public safety today is traffic accidents. Data show that over 94% of traffic accidents are caused by human factors. Among human factors, Decision Errors(33%) are critical, as they involve intentional, and risky choices made while violating traffic laws.
Therefore, we need to identify the spatial patterns of these violations and their relationship to accidents to develop effective prevention strategies.
|
| ICACT20260100 Slide.03
[Big Slide]
|
Chrome Click!! |
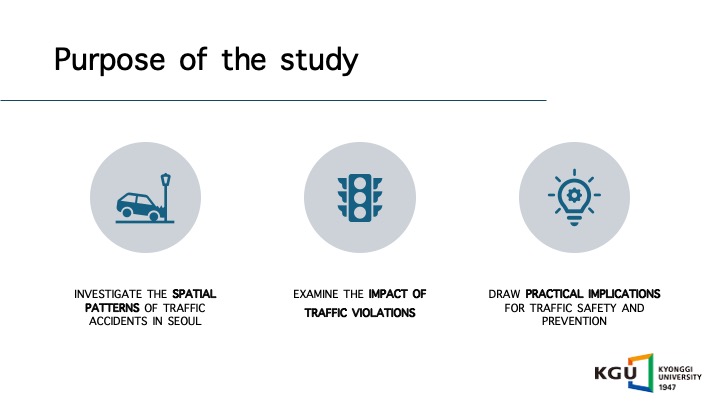 |
The purpose of this study is to investigate the spatial patterns of traffic accidents in Seoul and examine whether different types of traffic violations have distinct impacts on traffic accidents in order to draw practical implications for traffic safety and prevention.
|
| ICACT20260100 Slide.04
[Big Slide]
|
Chrome Click!! |
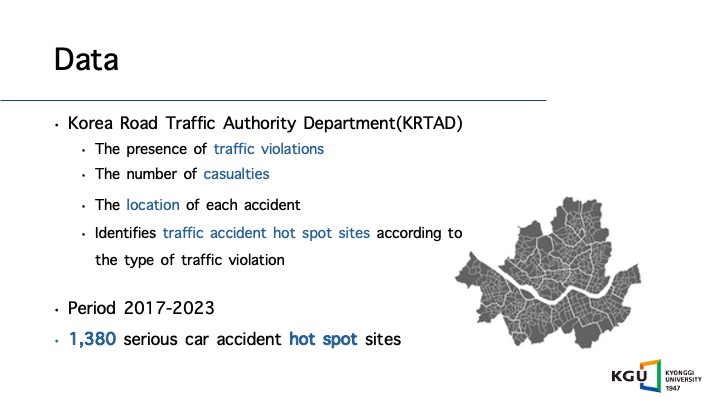 |
For this study, data from the Korea Road Traffic Authority Department (KRTAD) were utilized.
The data includes detailed information on traffic accidents, which are the presence of traffic violations, the number of casualties, and the location of each accident.
It also identifies traffic accident hot spot sites according to the type of traffic violation.
We analyzed traffic accident hot spot data for the period 2017–2023.
Over these seven years, 1,380 serious car accident hot spot sites were identified in Seoul.
|
| ICACT20260100 Slide.05
[Big Slide]
|
Chrome Click!! |
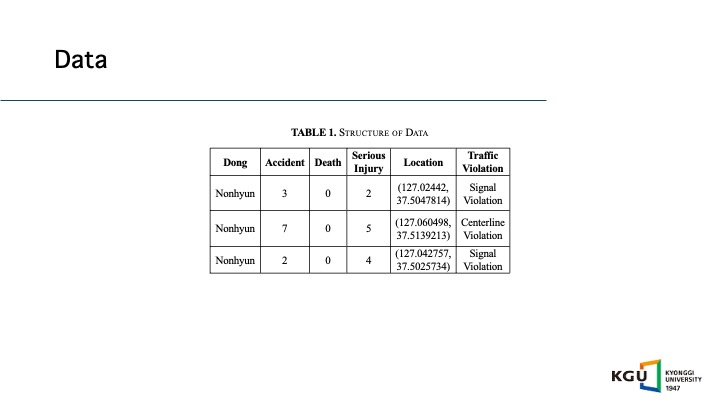 |
Table 1 presents the structure of the data.
Each row in the dataset represents a traffic accident in each hot spot site corresponding to a specific type of traffic violation.
For example, the first site is located in Nonhyeon-dong, where three traffic accidents occurred, all of which involved traffic signal violations.
|
| ICACT20260100 Slide.06
[Big Slide]
|
Chrome Click!! |
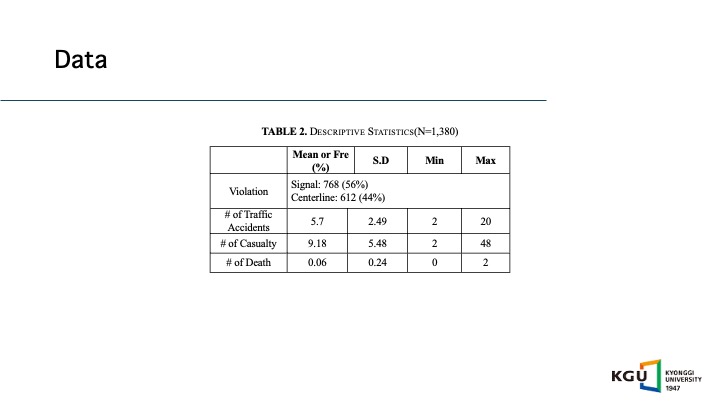 |
Table 2 presents the descriptive statistics illustrating the characteristics of the data.
Among the 1,380 traffic accident hot spot sites, 56% involved signal violations, while the remaining 44% involved centerline violations.
On average, each site experienced 5.7 traffic incidents over the seven-year period.
The average number of casualties per site was 9.18, ranging from a minimum of 2 to a maximum of 20.
|
| ICACT20260100 Slide.07
[Big Slide]
|
Chrome Click!! |
 |
For this study, three analytical approaches were employed.
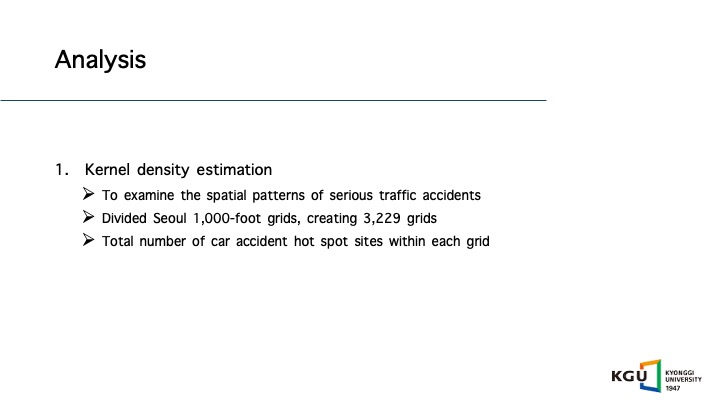
First, to examine the spatial patterns of serious traffic accidents, kernel density estimation was used.
This method calculates the point density of the variable of interest within a defined area
and effectively visualizes the distribution of serious traffic accident sites across the city.
The data is manipulated to examine the spatial patterns of serious traffic accidents.
In particular, the Seoul metropolitan area was divided into 1,000-foot grids, and the total number of car accident hot spot sites within each grid was calculated.
A total of 3,229 grids were created.
To explore variations in spatial patterns by violation type, the data were further disaggregated according to specific traffic violations.
|
| ICACT20260100 Slide.08
[Big Slide]
|
Chrome Click!! |
 |
Second, Local Indicators of Spatial Association (LISA) were applied to identify statistically significant concentrations of events
while accounting for spatial correlation between spatial units.
Using the LISA maps, areas with concentrated serious traffic accident sites were identified in Seoul.
|
| ICACT20260100 Slide.09
[Big Slide]
|
Chrome Click!! |
 |
Finally, a series of regression analyses were conducted to examine factors influencing both the number of serious traffic accident sites and the severity of traffic accidents by traffic violation type.
|
| ICACT20260100 Slide.10
[Big Slide]
|
Chrome Click!! |
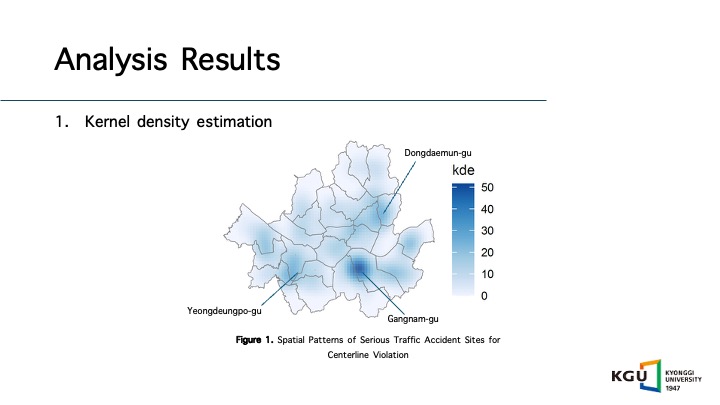 |
Figure 1 illustrates the spatial patterns of serious traffic accident sites involving centerline violations.
The kernel density scores indicate areas with higher concentrations of traffic accident hot spots.
According to the map, a greater number of hot spot sites are located in Gangnam-gu,
while Dongdaemun and Yeongdeungpo-gu exhibit moderate concentrations of hot spots.
|
| ICACT20260100 Slide.11
[Big Slide]
|
Chrome Click!! |
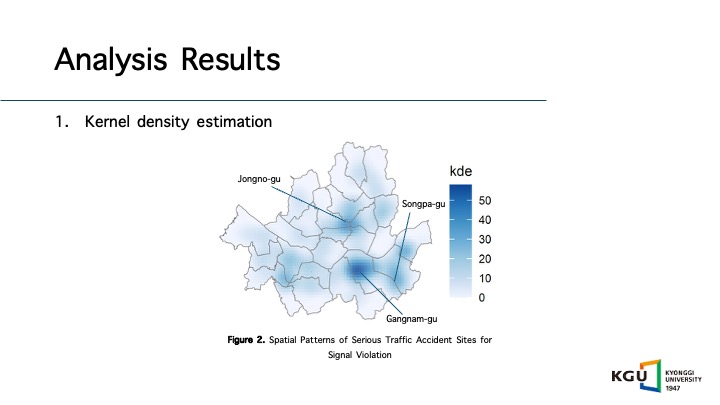 |
Figure 2 shows the spatial patterns of serious traffic accident sites involving traffic signal violations.
Similar to the map for centerline violations, Gangnam-gu emerges as a primary area with a high concentration of accident sites.
Additionally, more pronounced hot spots are observed in Songpa-gu and Jongno-gu.
|
| ICACT20260100 Slide.12
[Big Slide]
|
Chrome Click!! |
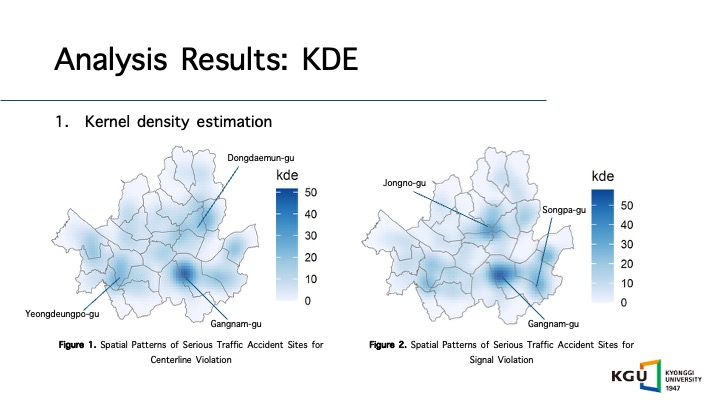 |
By comparing the two maps, it is evident that Gangnam-gu experiences a high concentration of serious traffic accident sites for both types of traffic violations.
When examining each violation type individually, hot spots for traffic signal violations appear more pronounced, whereas hot spots for centerline violations exhibit a more widespread spatial distribution.
|
| ICACT20260100 Slide.13
[Big Slide]
|
Chrome Click!! |
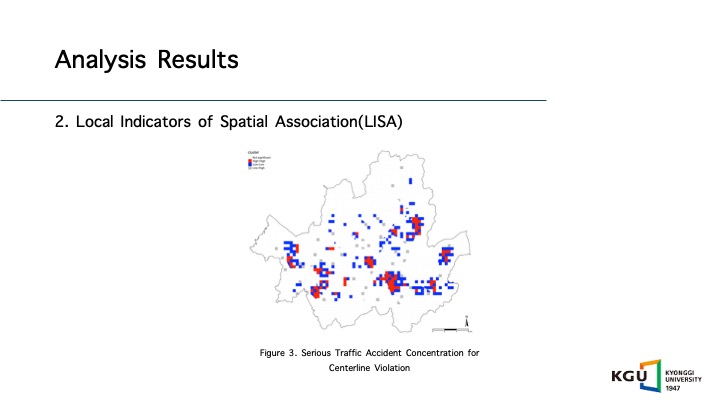 |
Figure 3 visualizes the concentration of traffic accident hot spot sites in the city.
The LISA map shows statistically significant clusters of high-high and low-low areas.
Grid areas colored in red represent high-high concentrations, while blue areas indicate low-low concentrations.
For centerline violations, several high-high clusters are observed across the city, with particularly significant concentrations in Gangnam-gu.
Areas adjacent to these high-accident zones also tend to experience a high volume of accidents.
Similar hot spot clusters are observed in Guro-gu, Dongdaemun-gu, and Yeongsan-gu.
|
| ICACT20260100 Slide.14
[Big Slide]
|
Chrome Click!! |
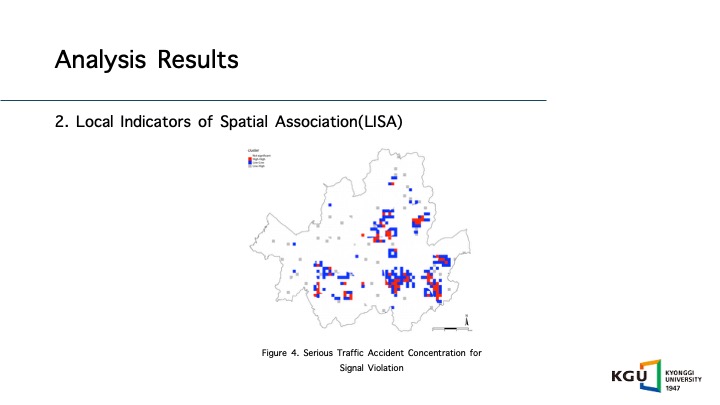 |
Figure 4 presents the LISA map for traffic accidents involving signal violations.
Compared to the LISA map for centerline violations, fewer clusters are observed.
High-high concentrations appear in Gangnam-gu and Songpa-gu, while grids in the western part of Seoul show relatively few traffic accident hot spots.
|
| ICACT20260100 Slide.15
[Big Slide]
|
Chrome Click!! |
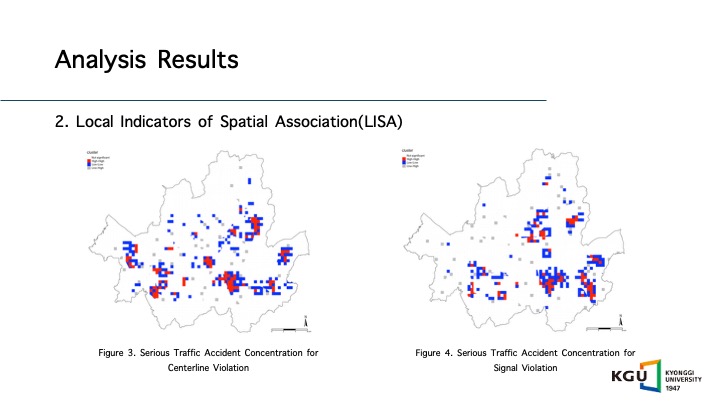 |
The distinction of two maps suggests that the spatial patterns of traffic accidents differ between centerline and signal violations.
Fewer clusters are observed in the signal violation map comparted to centerline violation. |
| ICACT20260100 Slide.16
[Big Slide]
|
Chrome Click!! |
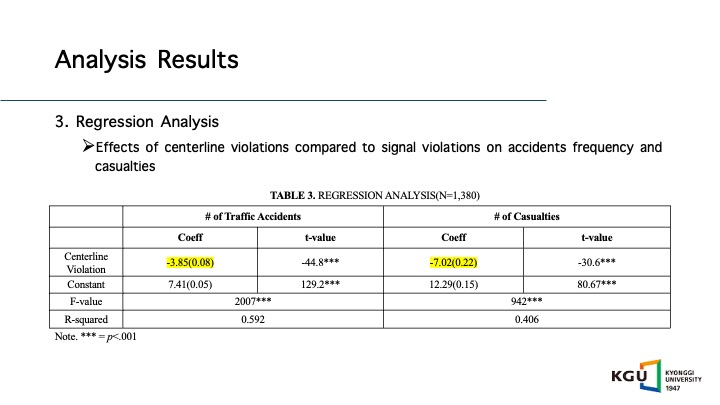 |
The regression analysis further highlights the effects of different types of traffic violations on accident frequency and casualties.
Compared to centerline violations, traffic hot spot sites with signal violations experience approximately 4 more accidents.
The model fit statistics indicate that around 59% of the variation in accident counts is explained by the type of violation.
Regarding casualties, sites with signal violations experience roughly 7 more, although the model explains relatively less variation in this outcome, accounting for only 40%.
|
| ICACT20260100 Slide.17
[Big Slide]
|
Chrome Click!! |
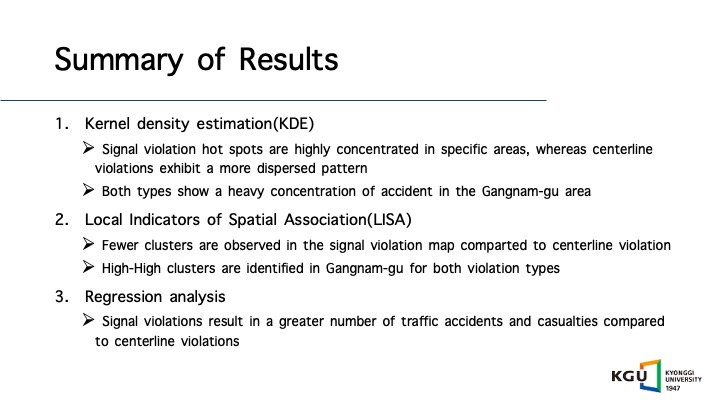 |
To briefly summarize the analysis results,
Kernel density estimation reveals that signal violation hot spots are highly concentrated in specific areas, whereas centerline violations exhibits a more dispersed pattern throughout Seoul.
The LISA analysis illustrates that the fewer cluster are observed in the signal violation map, while both results highlight a significant high-high concentration in Gangnam-gu.
Lastly, regression analysis demonstrates that the signal violations lead to a larger number of traffic accidents and casualties compared to centerline violation.
|
| ICACT20260100 Slide.18
[Big Slide]
|
Chrome Click!! |
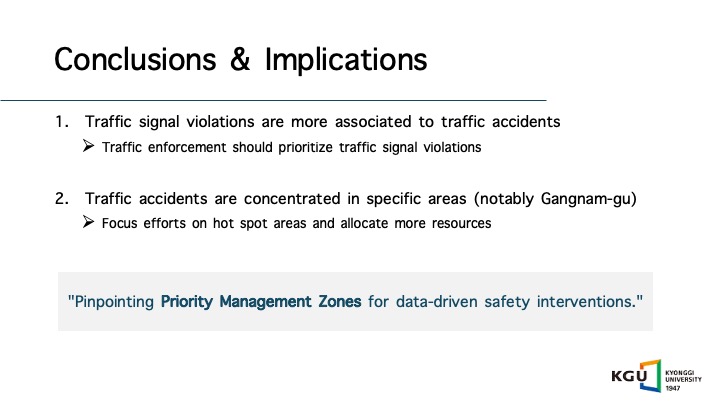 |
To wrap up, our study provide two key findings for urban traffic safety.
First, we found that signal violations are more strongly associated with accidents and casualties than centerline violations.
In this regard, traffic enforcement and safety measures—whether through police presence or electronic surveillance—should prioritize the prevention of signal violations to maximize safety impacts
Second, our spatial analysis confirms that accidents are highly concentrated in specific areas, notably Gangnam-gu.
These significant hotspots should be the primary focus of our safety efforts.
By identifying localized risk factors and allocating more resources to these zones, we can improve road safety more efficiently.
In conclusion, we believe this analysis is vital
because it filters out random incidents and pinpoints statistically significant Priority Management Zones for targeted, data-driven safety interventions.
|
| ICACT20260100 Slide.19
[Big Slide]
|
Chrome Click!! |
 |
Reference |
| ICACT20260100 Slide.20
[Big Slide]
|
Chrome Click!! |
 |
Thank you so much for your attention.
If you have any comments or advices on our project, that would be appreciated.
|















