 ICACT20260142 Slide.01
[Big Slide] |
Chrome  Click!! |
 |
Good morning, Chair Dr. Pham Dinh Lam, and fellow participants.
Thank you for attending this session at ICACT 2026 in PyeongChang.
We are Kien Hoang Dang and Hieu Cong Nghia, presenting our paper on behalf of my team from Viettel High Technology Industries Corporation.
Our paper is titled: ‘An Efficient Framework to Investigate the Root Cause of SLO Violation in 5G Online Charging Systems.’
Today we will cover the motivation, proposed framework, experimental results, and conclusion of our work
|
| ICACT20260142 Slide.02
[Big Slide]
|
Chrome Click!! |
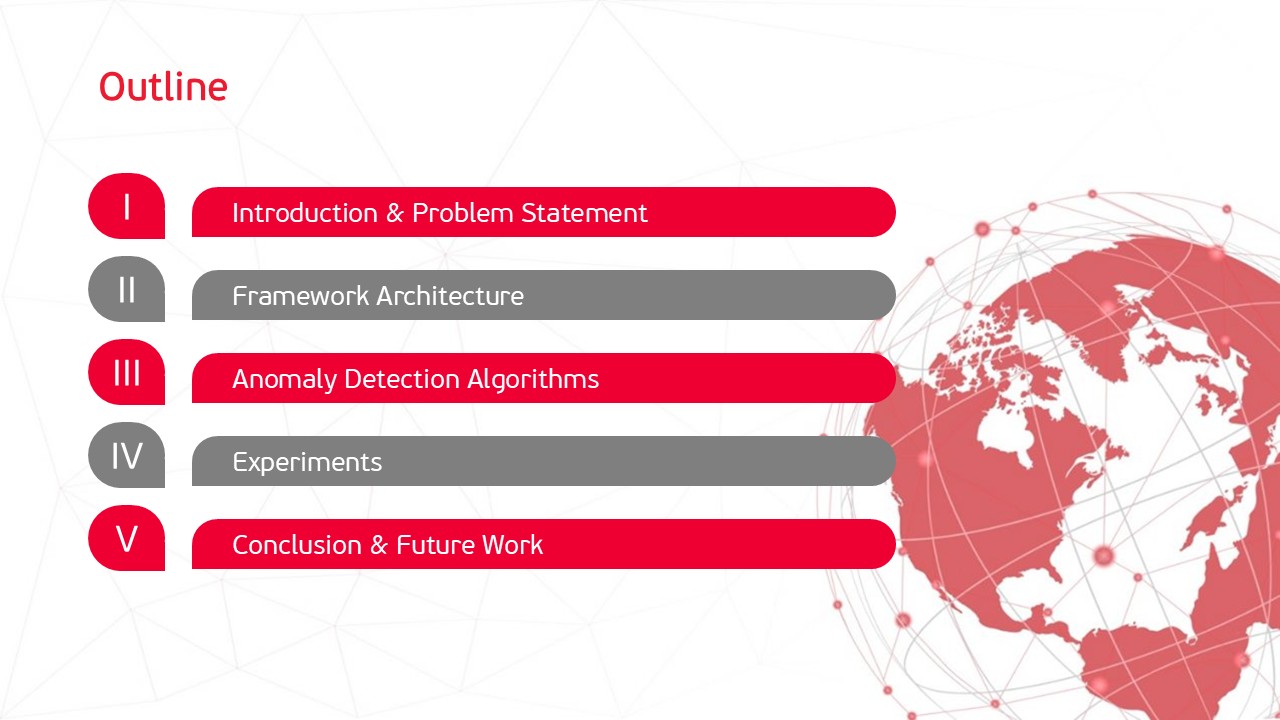 |
Here’s the outline:
Section I is the background and problem statement, highlighting SLO challenges in 5G.
Sections II and III detail the investigation framework and our anomaly detection algorithms.
Section IV presents experimental results to validate efficiency.
Finally, we wrap up with conclusions and future work directions.
|
| ICACT20260142 Slide.03
[Big Slide]
|
Chrome Click!! |
 |
Now let’s start with the foundation |
| ICACT20260142 Slide.04
[Big Slide]
|
Chrome Click!! |
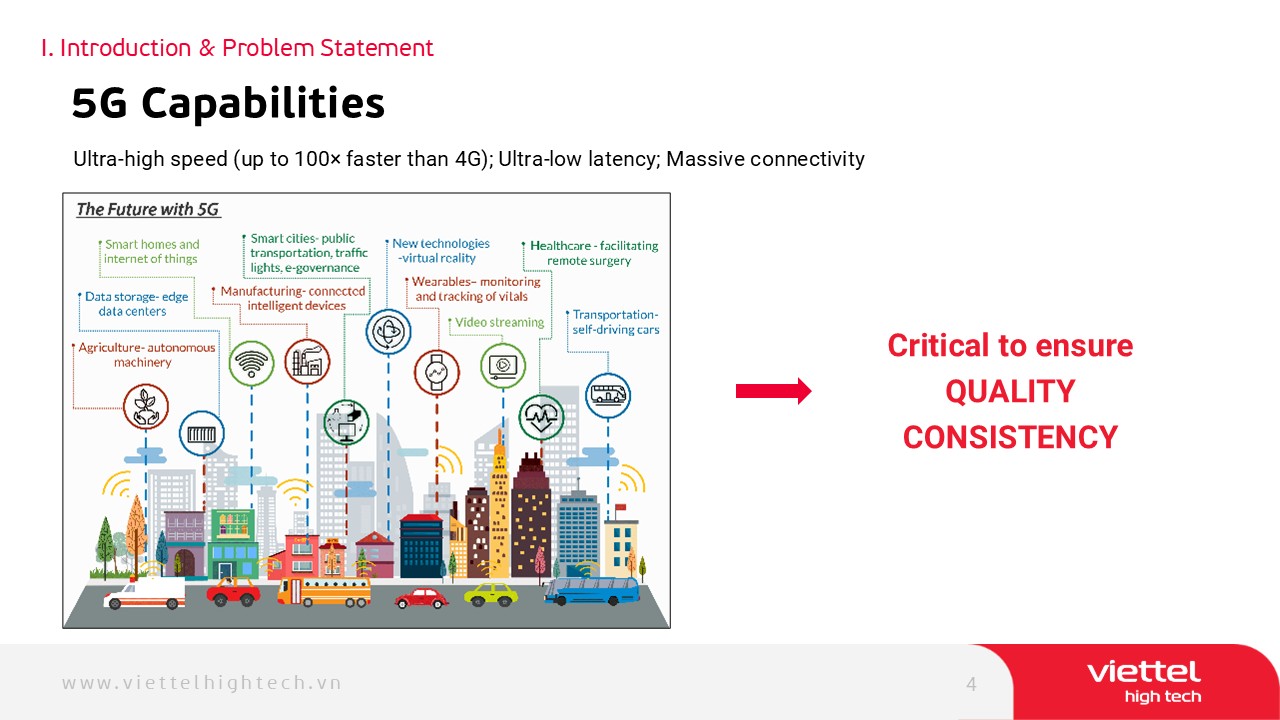 |
We all know that 5G is transforming global connectivity.
It brings ultra-high speed, ultra-low latency, and massive device connectivity at the same time.
These unlock many new services: industrial IoT, remote healthcare, smart transportation, and many others.
However, to capture full business value — especially service monetization — operators must guarantee consistent service quality at all times.
|
| ICACT20260142 Slide.05
[Big Slide]
|
Chrome Click!! |
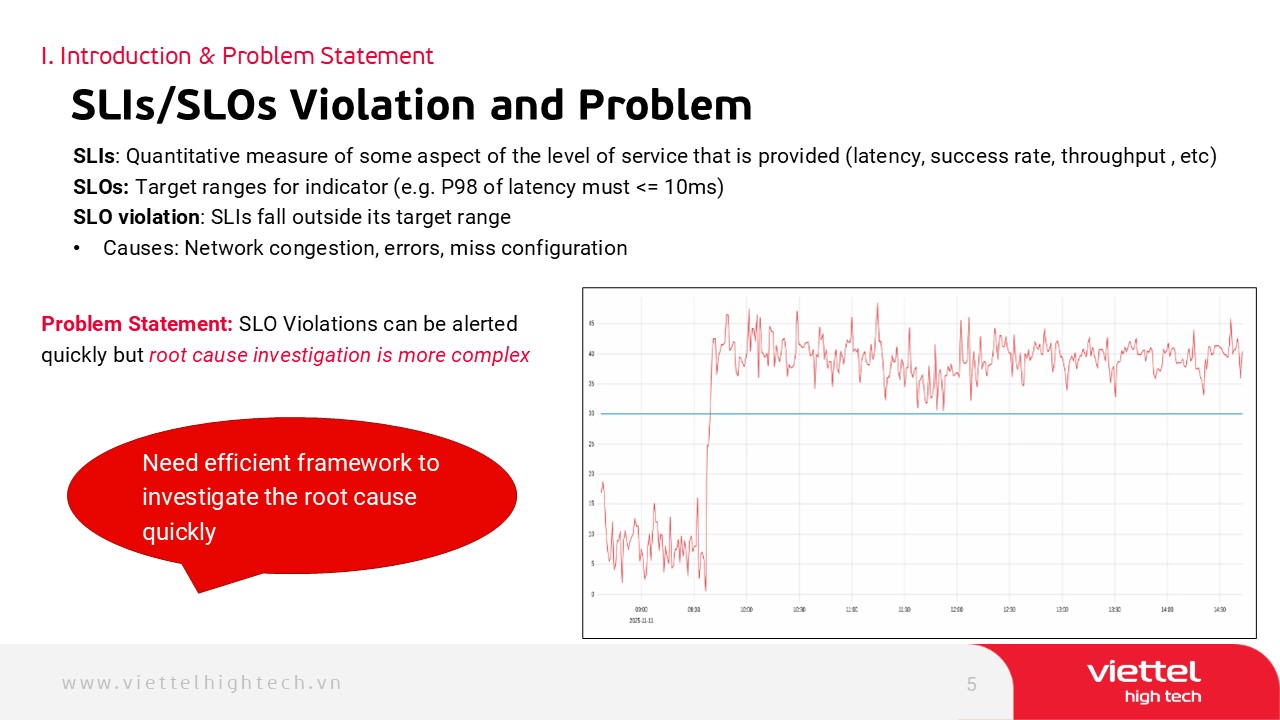 |
To enforce the reliability, we use two key concepts: SLIs and SLOs.
An SLI is a quantitative measure of some aspect of the level of service that is provided such as latency, success rate, or throughput.
An SLO defines the acceptable target range for SLI; for example, P98 of request latency must be less than or equal to 10 milliseconds.
When an SLI falls outside its SLO, a violation occurs.
In 5G OCS, violations cause call/internet interruptions, revenue loss, and lost customer trust.
Common causes include network congestion, hardware/software faults, or misconfigurations.
Monitoring detects violations quickly via alerting rules — but only shows symptoms, not root cause.
The real problem: we need much faster root cause investigation in zero-downtime 5G environments.
|
| ICACT20260142 Slide.06
[Big Slide]
|
Chrome Click!! |
 |
And nowhere is this more critical than in real-time charging and policy control.
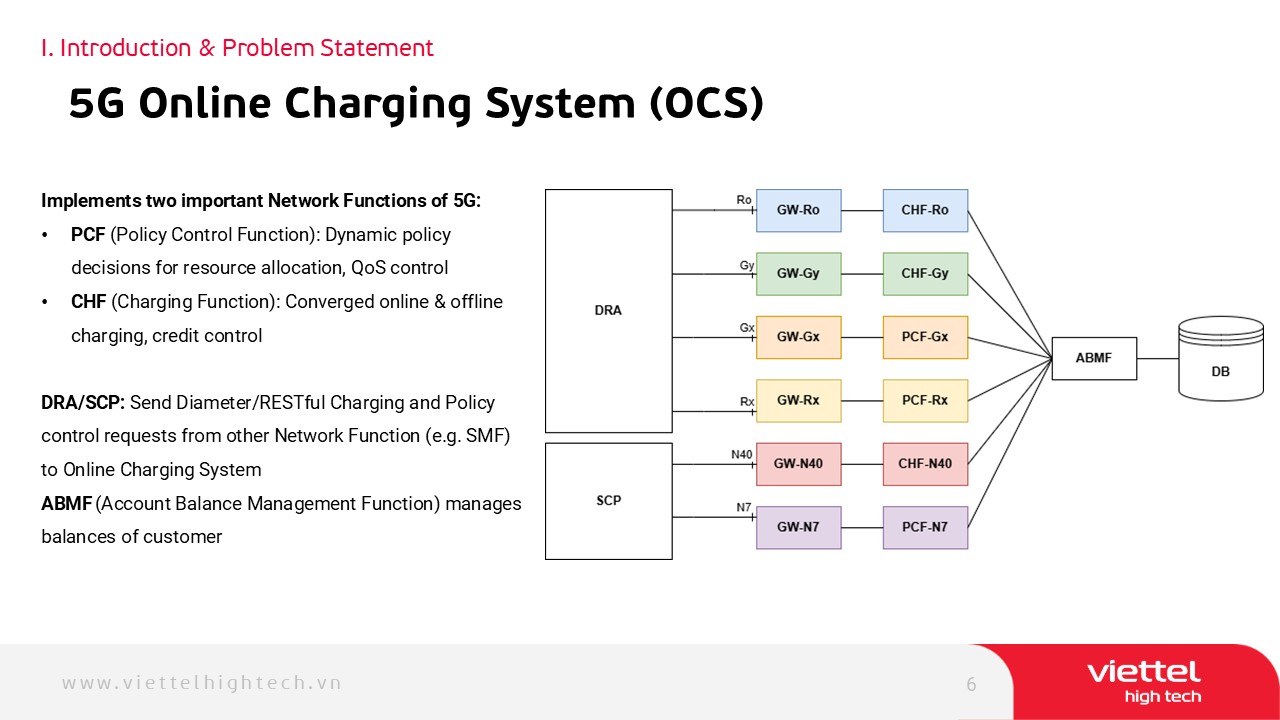
Real-time charging and policy enforcement are core responsibilities of the Online Charging System (OCS).�This is the architecture of our Online Charging System (OCS), which implements two important network functions of the 5G network: PCF and CHF.
PCF is responsible for online and offline charge user tariff, and PCF is responsible to control policy such as bandwidth control.
As shown in this figure, requests from other Network Functions (NF) like SMF were delivered to our system via Diameter Routing Agent (DRA) and Service Communication Proxy (SCP) using standard interfaces Ro, Gx, Gy, N7, N40, etc. DRA implements Diameter protocol for 4G charging & policy control, while SCP implements RESTful for 5G.
The ABMF (Account Balance Management Function) manages user balances stored in the database.
Our system must run with near-zero interruption. Any disruption directly affects revenue and customer experience. That is the challenge we address.
|
| ICACT20260142 Slide.07
[Big Slide]
|
Chrome Click!! |
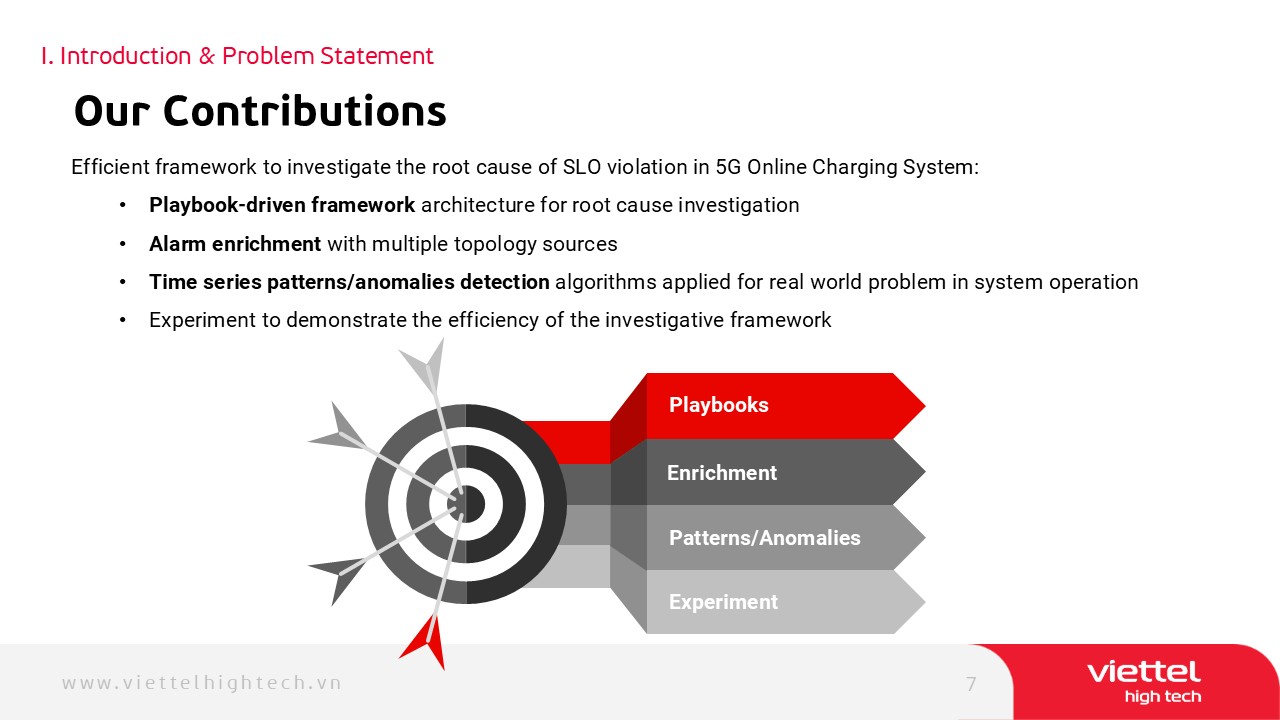 |
In this paper, we propose an efficient framework to investigate the root cause of SLO violation in the 5G Online Charging System with the following highlights.
The first contribution is a playbook-driven framework architecture for root cause investigation.
Then, we propose a method to enrich alarms with topology context from multiple sources.
We also propose algorithms for detecting time-series patterns and anomalies applied for real world problem in system operation.
Finally, we conduct experiments to demonstrate the efficiency of our investigative framework.
|
| ICACT20260142 Slide.08
[Big Slide]
|
Chrome Click!! |
 |
Now, let’s move to the framework architecture. |
| ICACT20260142 Slide.09
[Big Slide]
|
Chrome Click!! |
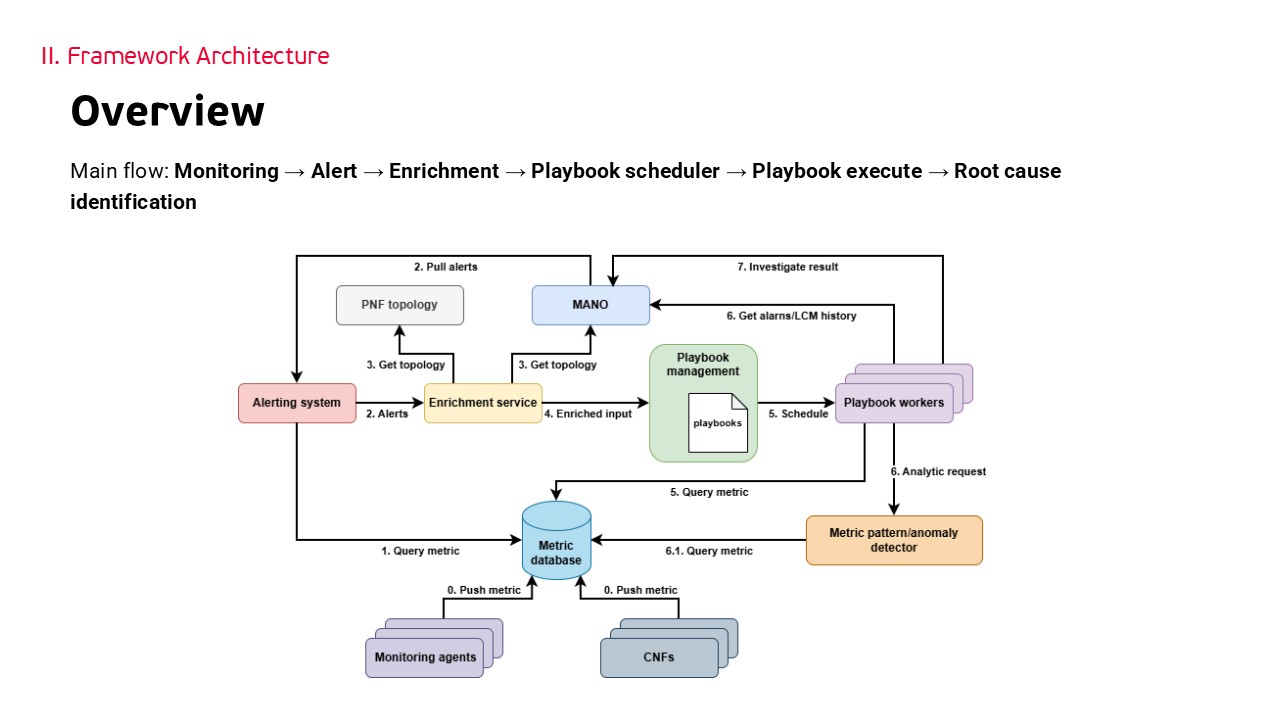 |
In our system, all metrics of infrastructure, virtualization and application layers were collected and stored centrally in the metric database.
The alerting system uses those metrics to generate alerts when the SLOs are violated.
When an SLO violation alert fires from monitoring, enrichment service adds context for the alert using PNF topology – which maintains the topology of Physical Network Functions like Firewall, Load Balancer, etc in our data centers, and MANO – which maintain topology of our Container Network Functions such as PCF, CHF, and ABMF.
Enriched data will become the input for playbook – a pre-defined list of steps to query metrics, request analysis, fetch logs and alarms for each type of incident.
Playbook management and playbook workers are responsible for scheduling and executing the playbooks.
We also develop “Metric patterns and anomaly detector” to help playbook detect patterns and anomalies in our time series metrics.
This topology-based approach enables fast and comprehensive investigation in 5G OCS.
|
| ICACT20260142 Slide.10
[Big Slide]
|
Chrome Click!! |
 |
Let’s look first at how violations are actually detected.
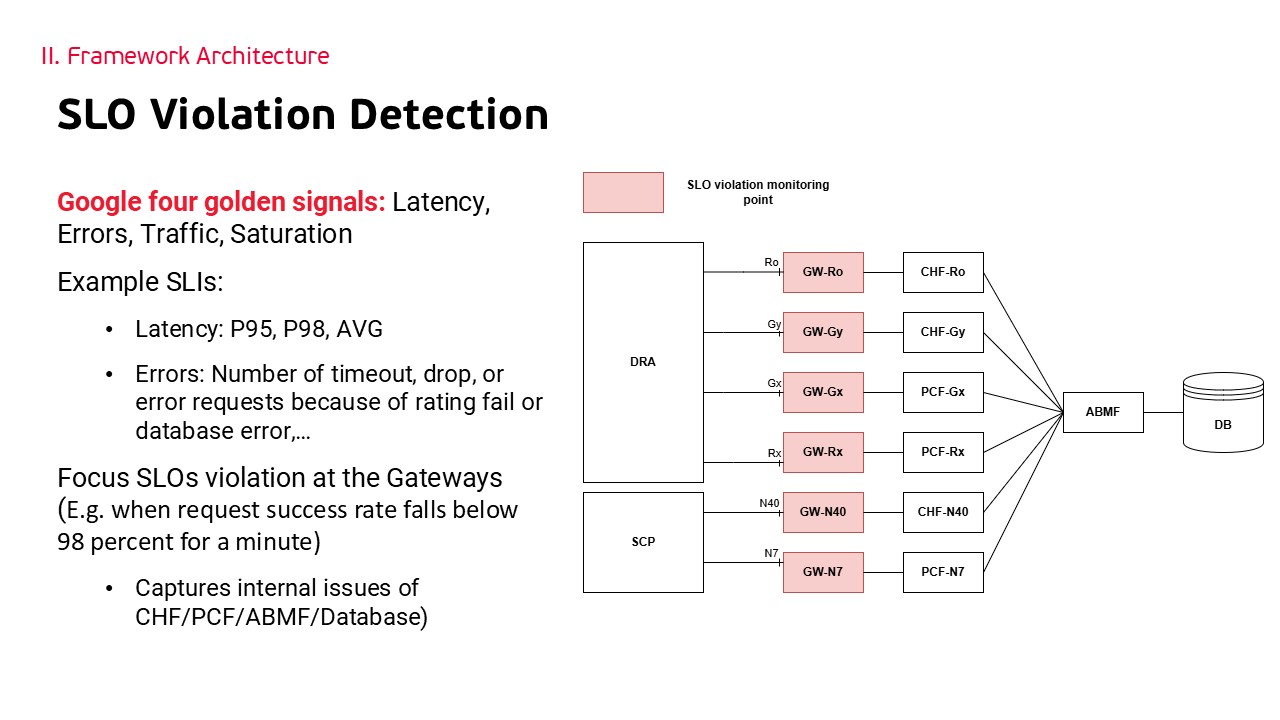
We focus on four Golden Signals of system health defined by Google: Latency, Errors, Traffic, and Saturation.
Some example SLIs that we are interested in are: P95, P98, or AVG of latency, error rate of requests, which include: timeout, drop, or error requests because of rating fail or database error.
SLO violation is detected at the Gateways using collected metrics and alerting rules E.g. request success rate of a service falls below 98 percent for a minute.
Our monitoring system allows all problems in CHF/PCF, ABMF, and the database to be seen at the gateways.
|
| ICACT20260142 Slide.11
[Big Slide]
|
Chrome Click!! |
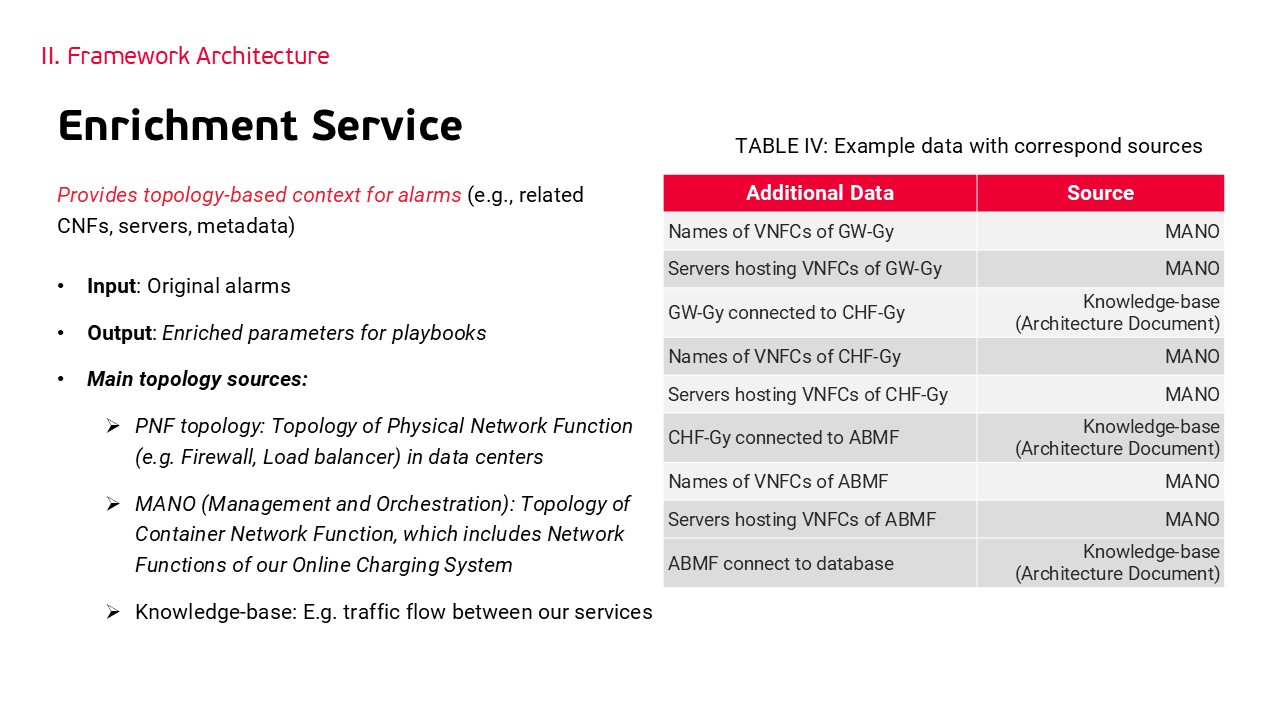 |
Once detected, we immediately enrich the raw alarm before investigation begins.
The Enrichment Service transforms raw alarms into actionable inputs by adding topology-based context.
We have three main topology sources:
PNF topology: Topology of Physical Network Function (e.g., Firewall, Load balancer) in data centers.
MANO (Management and Orchestration): Topology of Container Network Function, which includes the Network Functions of our Online Charging System.
Knowledge-base: For example, traffic flow between services.
Example data and their corresponding sources were shown in Table 4.
|
| ICACT20260142 Slide.12
[Big Slide]
|
Chrome Click!! |
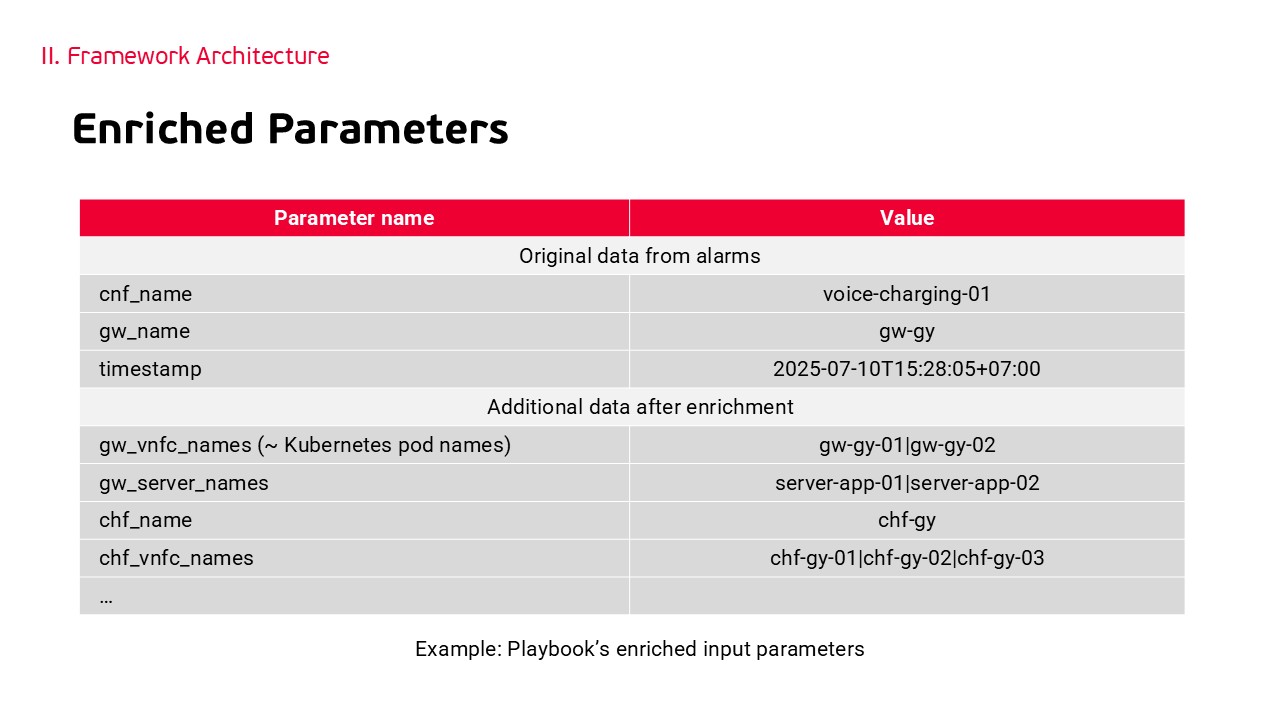 |
Here is a concrete example of what those enriched parameters look like.
Original alarm data includes CNF name, GW name = gw-gy, and timestamp.
Enriched data includes gateway VNFC names, aka Kubernetes pod names, names of servers that host gateway VNFC, names of the charging function that the gateway sends requests to, etc.
With this enriched context, the playbook can now run structured steps automatically. |
| ICACT20260142 Slide.13
[Big Slide]
|
Chrome Click!! |
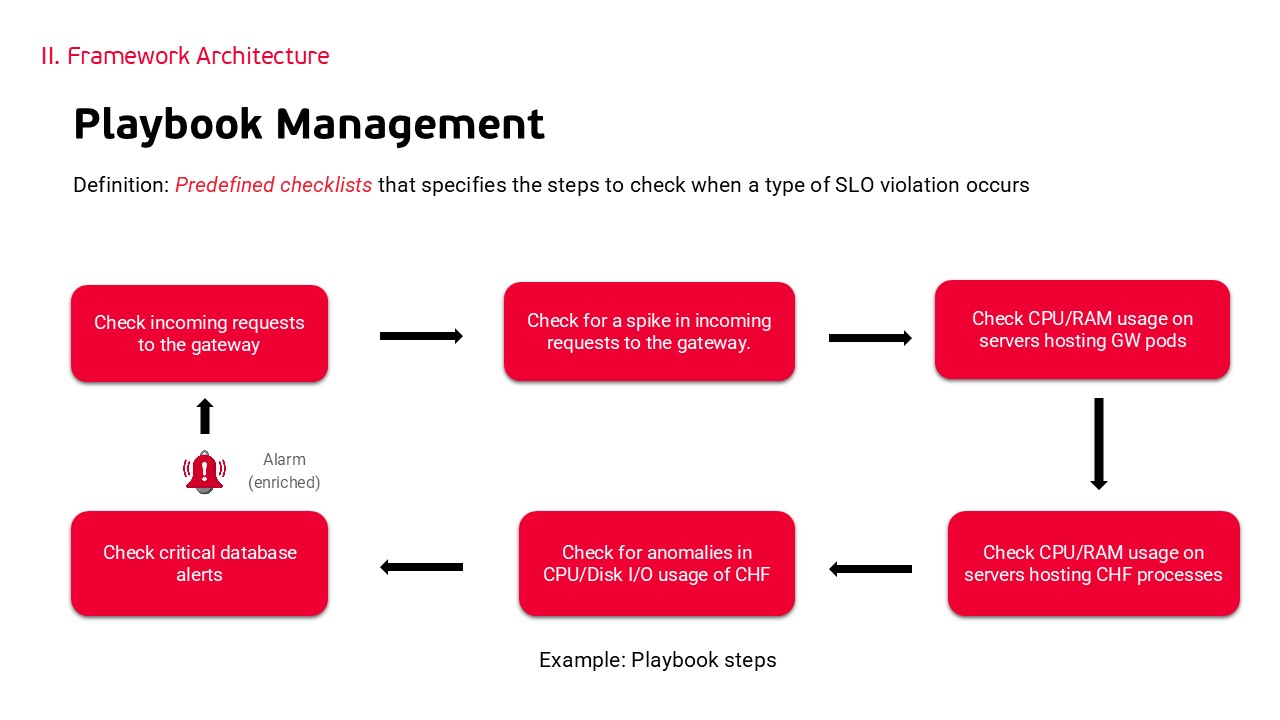 |
Playbook Management is the core orchestrator.
A playbook is a predefined checklists that specifies the steps to check when a type of SLO violation occurs.
A simple playbook can be shown in this figure, which include basic check RAM/CPU steps, detect anomalies in CPU/ Disk IO usage and check critical database alerts.
This automated sequence minimizes manual work, quickly gather relevant data and reach a conclusion without manual jumping between tools. |
| ICACT20260142 Slide.14
[Big Slide]
|
Chrome Click!! |
 |
Now, we start introducing Anomaly and Pattern Detection Algorithms, important tools of the playbook. |
| ICACT20260142 Slide.15
[Big Slide]
|
Chrome Click!! |
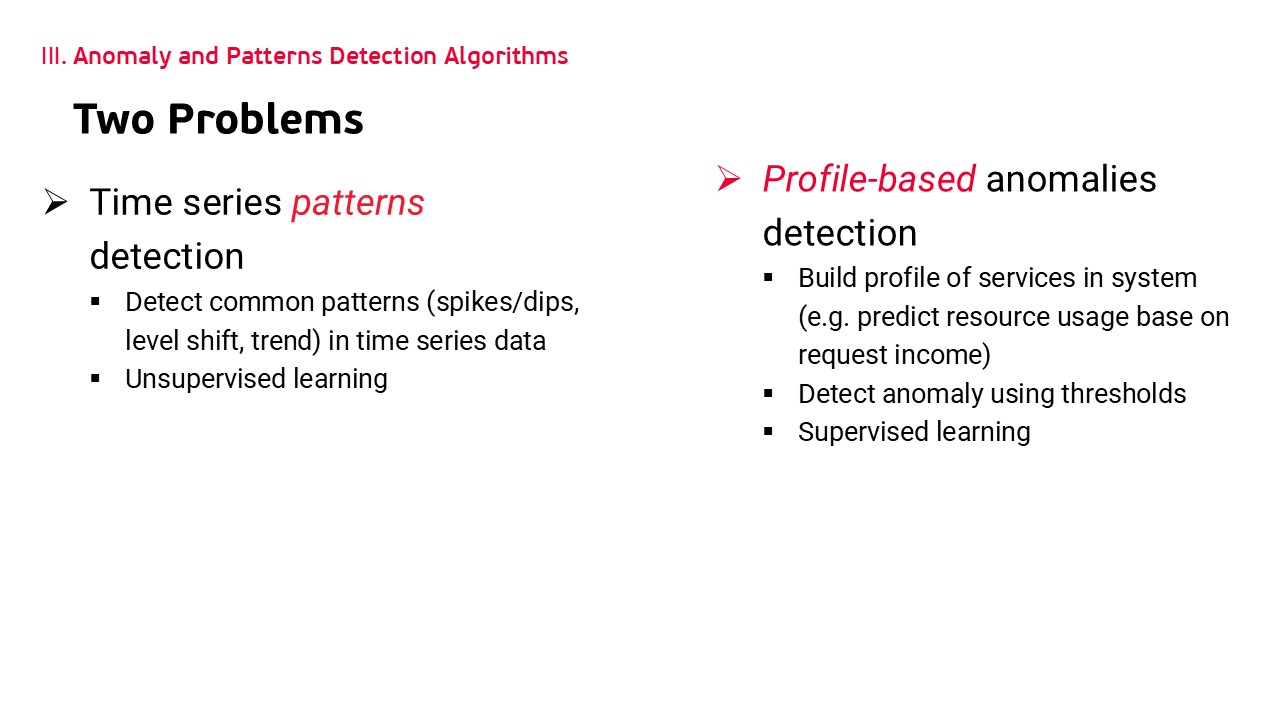 |
To enhance the ability of the playbook, we develop a time series pattern and anomaly detection service that a playbook step can use to analyze time series metrics.
First, time series pattern detection identifies key signals: spikes or dips for abrupt changes, level shifts for persistent alterations, and trends for gradual issues like memory leaks.
Second, profile-based anomaly detection uses regression models to build profiles of our services, for example, predict CPU usage based on the number of requests per second in a normal operation, which can be used to indicate inefficiencies or misconfigurations of services.
These algorithms help investigating system bottlenecks quickly.
|
| ICACT20260142 Slide.16
[Big Slide]
|
Chrome Click!! |
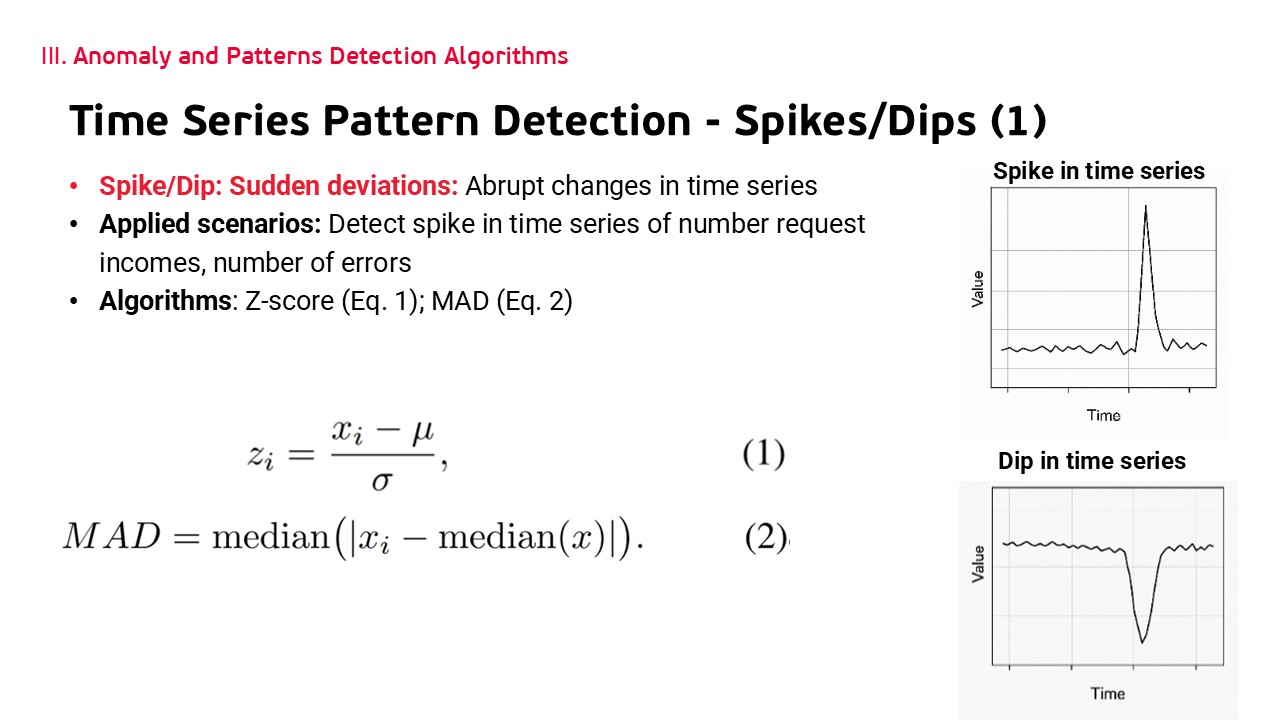 |
We detect spikes and dips as sudden deviations in time series metrics, such as TPS or latency, which often signal traffic surges or overloads in charging gateways.
Short spikes appear as isolated points, while long spikes or dips span contiguous segments.
To handle, we use Z-score normalization: thats (xi minus the mean) divided by the standard deviation.
For outliers, median absolute deviation steps in, calculated as the median of absolute differences from the median.
|
| ICACT20260142 Slide.17
[Big Slide]
|
Chrome Click!! |
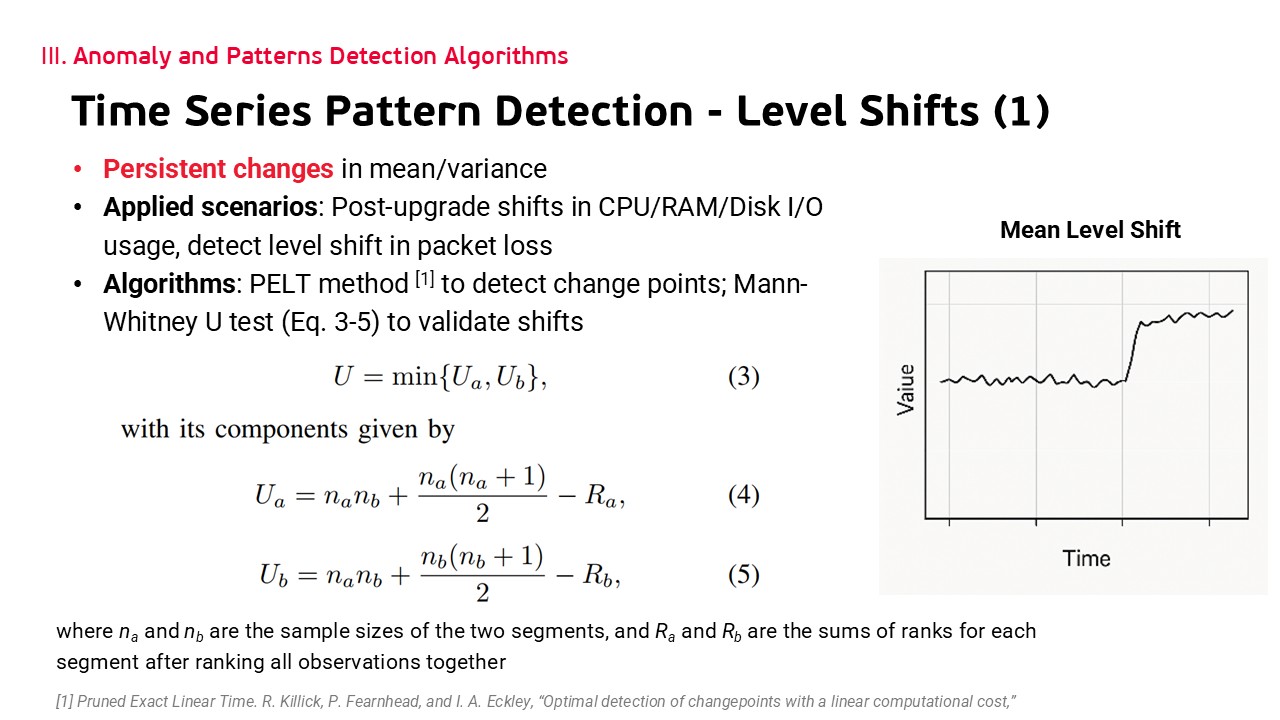 |
Level shifts represent lasting changes in mean or variance, commonly seen after software upgrades or configuration updates in CHF or PCF components.
To detect them, we start with PELT method to locate change points, then statistically validate using the Mann-Whitney U test.
The test computes U as the minimum of Ua and Ub, derived from sample sizes and rank sums, confirming significant differences between segments.
This statistical check ensures were spotting persistent shifts, like post-upgrade CPU spikes, which could lead to SLO violations if ignored.
|
| ICACT20260142 Slide.18
[Big Slide]
|
Chrome Click!! |
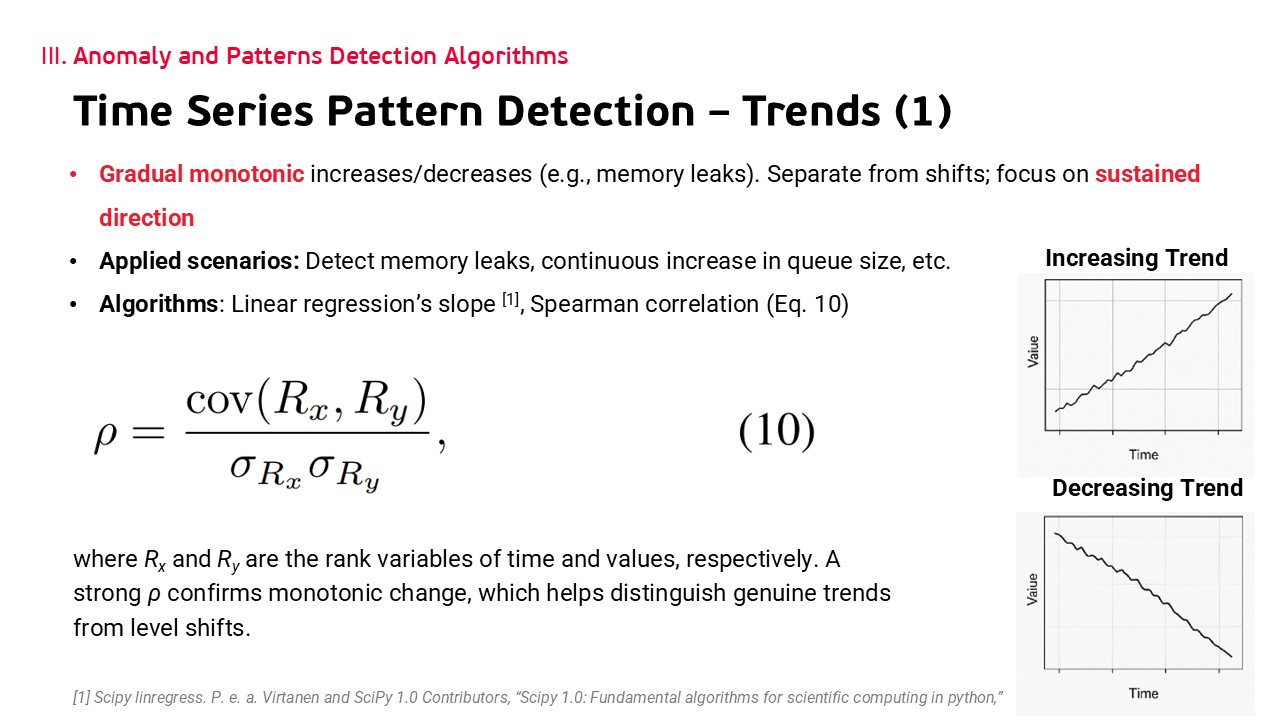 |
Trends capture gradual monotonic increases or decreases, such as steady memory growth indicating potential leaks in servers or applications.
We calculate the slope β using SciPys linregress on time-value pairs, then validate monotonicity with Spearmans rank correlation: thats the covariance of ranks Rx and Ry divided by their standard deviations.
It ensures we catch problems that build up over time, preventing broader SLO impacts like service interruptions.
|
| ICACT20260142 Slide.19
[Big Slide]
|
Chrome Click!! |
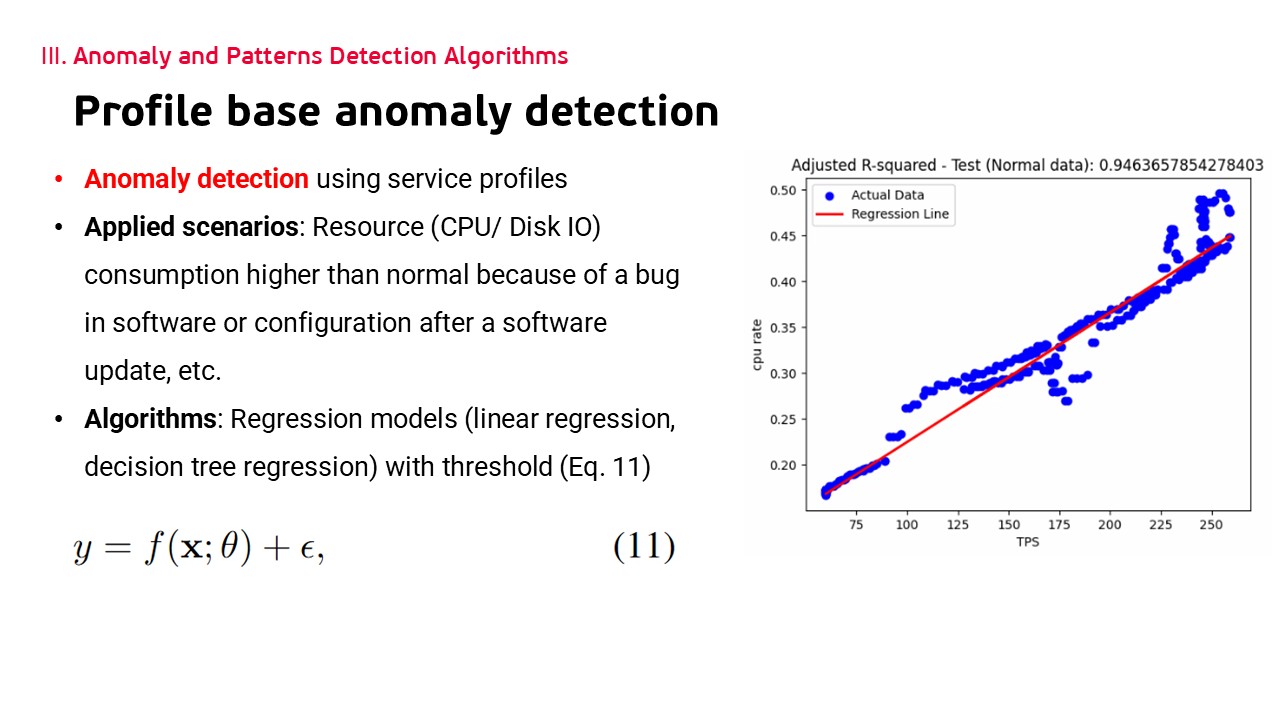 |
Besides unsupervised methods, we also apply supervised learning to train profiles of our services.
For example, build a model to predict CPU/ Disk IO consumption of a service in normal operation and use for detect possible bugs in software or configuration after a software update.
We use regression algorithms and used in conjunction with a threshold for the difference between predicted and actual values.
|
| ICACT20260142 Slide.20
[Big Slide]
|
Chrome Click!! |
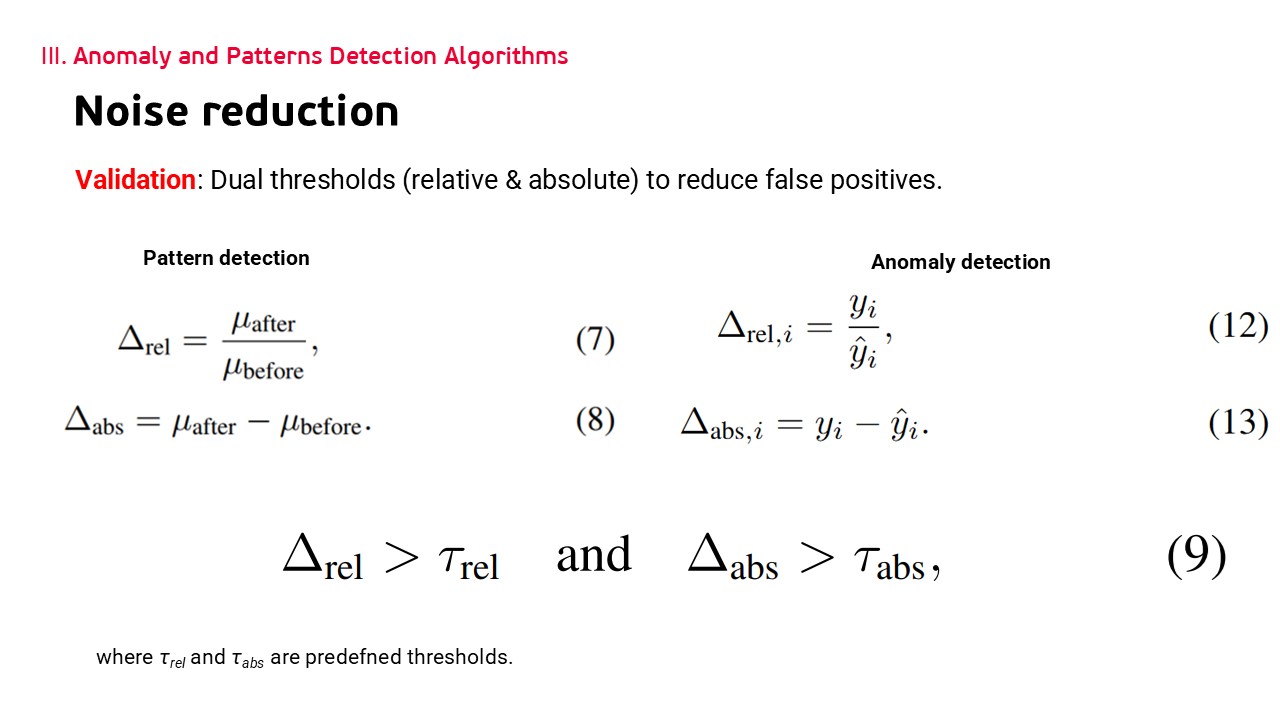 |
To cut down on false positives of all above algorithms, we apply dual thresholds: a relative one, Δ rel as μ after over μ before exceeding τ rel, and an absolute one, Δ abs as the difference surpassing τ abs.
We use those two values in the post-detection phase to confirm the change is significant enough.
For example, CPU usage of a server changes from 3 percent to 6 percent, even the Δ rel is 200 percent, but it is not really a notable problem. While in contrast, if CPU usage change from 45 percent to 90%, still 200 percent in Δ rel, but that is an significant one
We will choose this value based on domain knowledge of metrics
|
| ICACT20260142 Slide.21
[Big Slide]
|
Chrome Click!! |
 |
And now we shift to experiments to demonstrate the efficiency of our framework.
|
| ICACT20260142 Slide.22
[Big Slide]
|
Chrome Click!! |
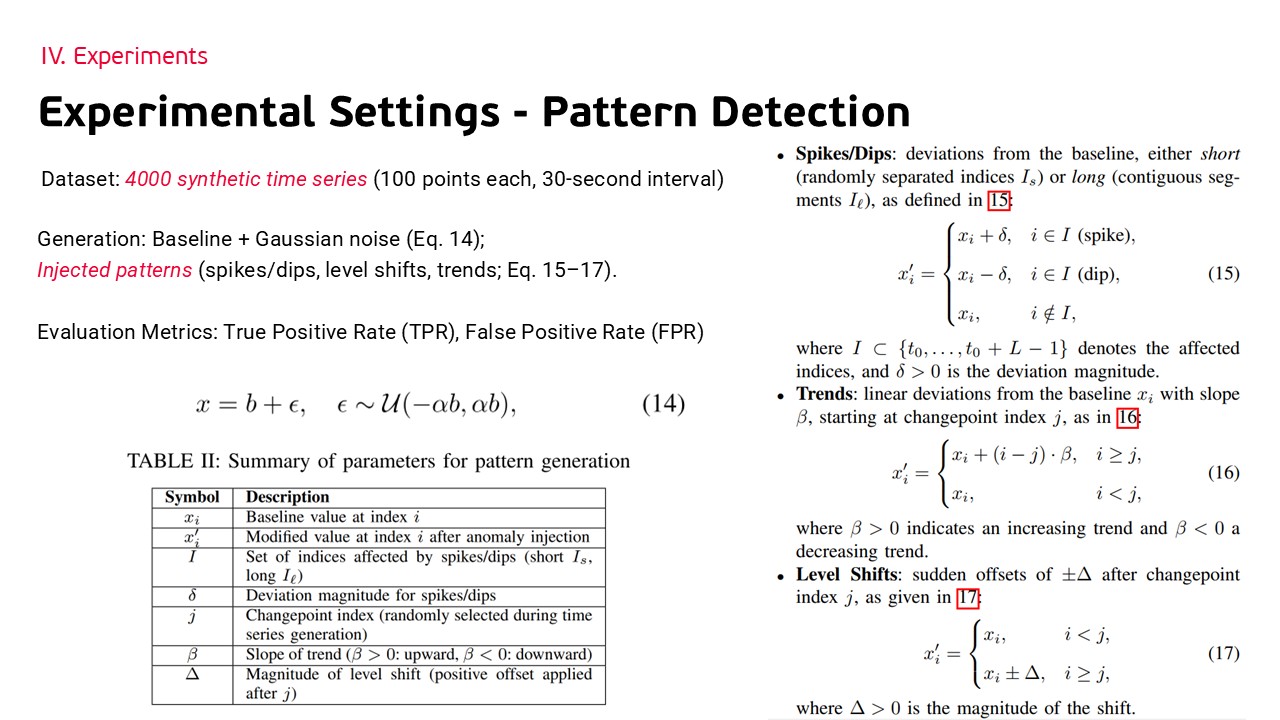 |
For pattern detection experiments, we generated 4000 synthetic time series — 100 points each, 30-second intervals — stored in Victoria Metrics, a high-performance metric database.
Each series includes a baseline + Gaussian noise (Eq. 14), then one injected pattern: spikes/dips, level shifts, or trends (Eq. 15–17).
Parameters are listed in Table II (baseline x_i, deviation δ, changepoint j, slope β, shift Δ, etc.).
We use binary classification metrics: True Positive Rate and False Positive Rate, to evaluate detection accuracy and false alarm rates across pattern types.
|
| ICACT20260142 Slide.23
[Big Slide]
|
Chrome Click!! |
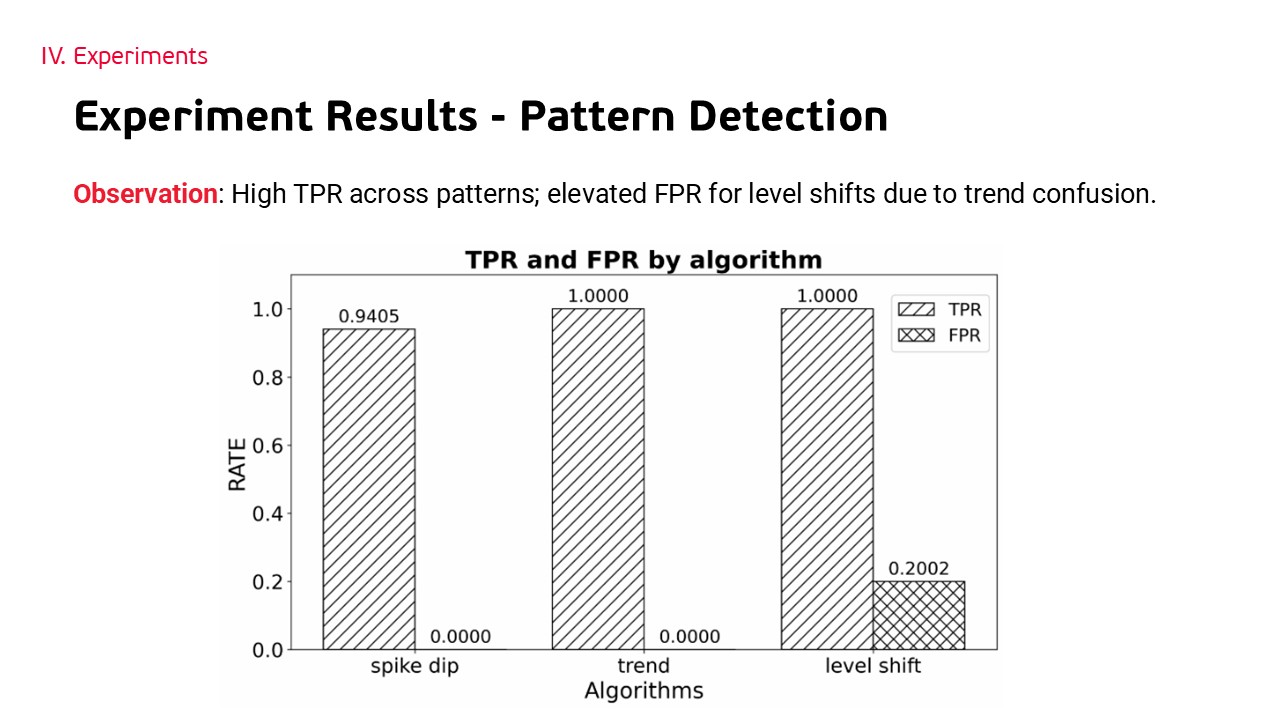 |
Let’s now look at the detection performance.�Results are shown in the bar chart. Spikes and dips achieved a true positive rate of 94% with zero false positives.
Trends performed well at 100% TPR and only 0% FPR.
Level shifts also reached 100% TPR, but with a higher 20% FPR, primarily because gradual trends were misclassified as level shifts.
Overall, the algorithms show excellent sensitivity with acceptable specificity — level-shift tuning is the main improvement needed.
|
| ICACT20260142 Slide.24
[Big Slide]
|
Chrome Click!! |
 |
Next, we move to profile-based anomaly detection.
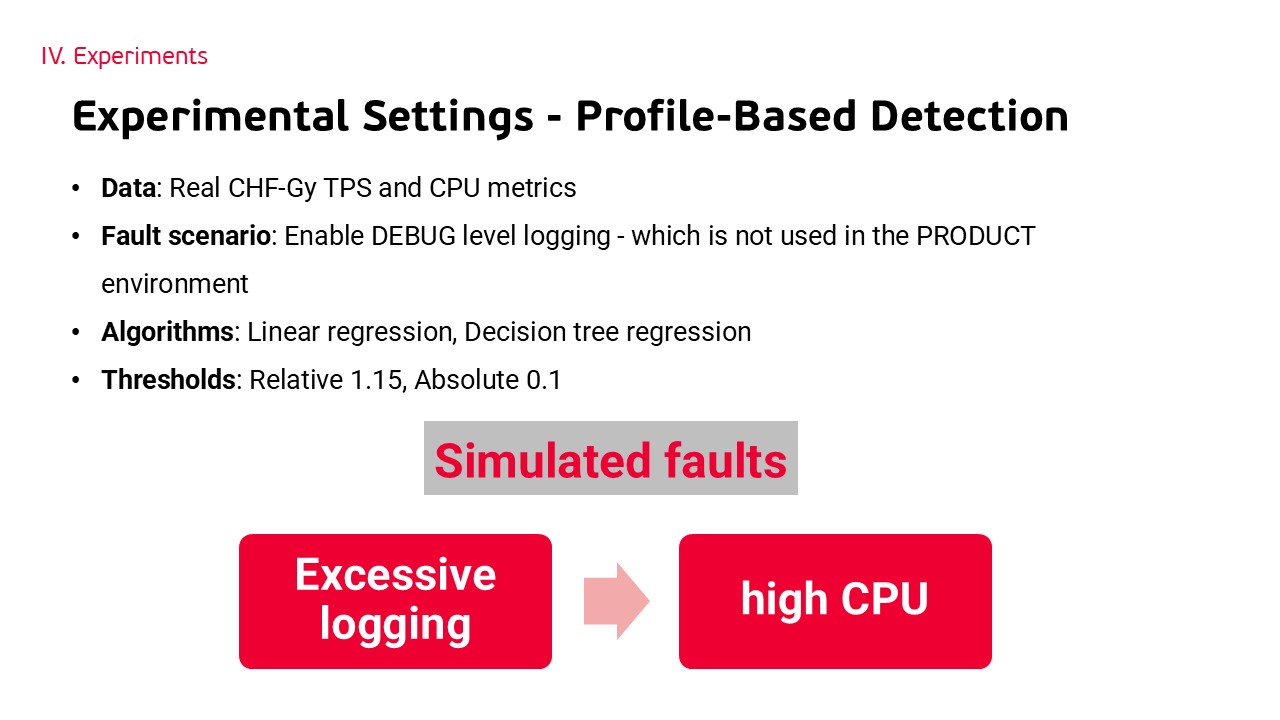
To conduct this experiment, we use real metrics of the service CHF-Gy with TPS - transaction per second as the feature, CPU usage as predicted output — collected during normal operation, and an abnormal period with DEBUG logging was enabled - which is not used in the PRODUCT environment. This logging option will make the service consume more CPU and Disk IO than usual because of the volume of log writes to disk.
We trained linear regression and decision tree models.
To detect the anomaly, we set the relative threshold equal to 1.15 and the absolute threshold equal to 0.1. This option confirms that the difference between the predicted CPU and the measured CPU is significant.
|
| ICACT20260142 Slide.25
[Big Slide]
|
Chrome Click!! |
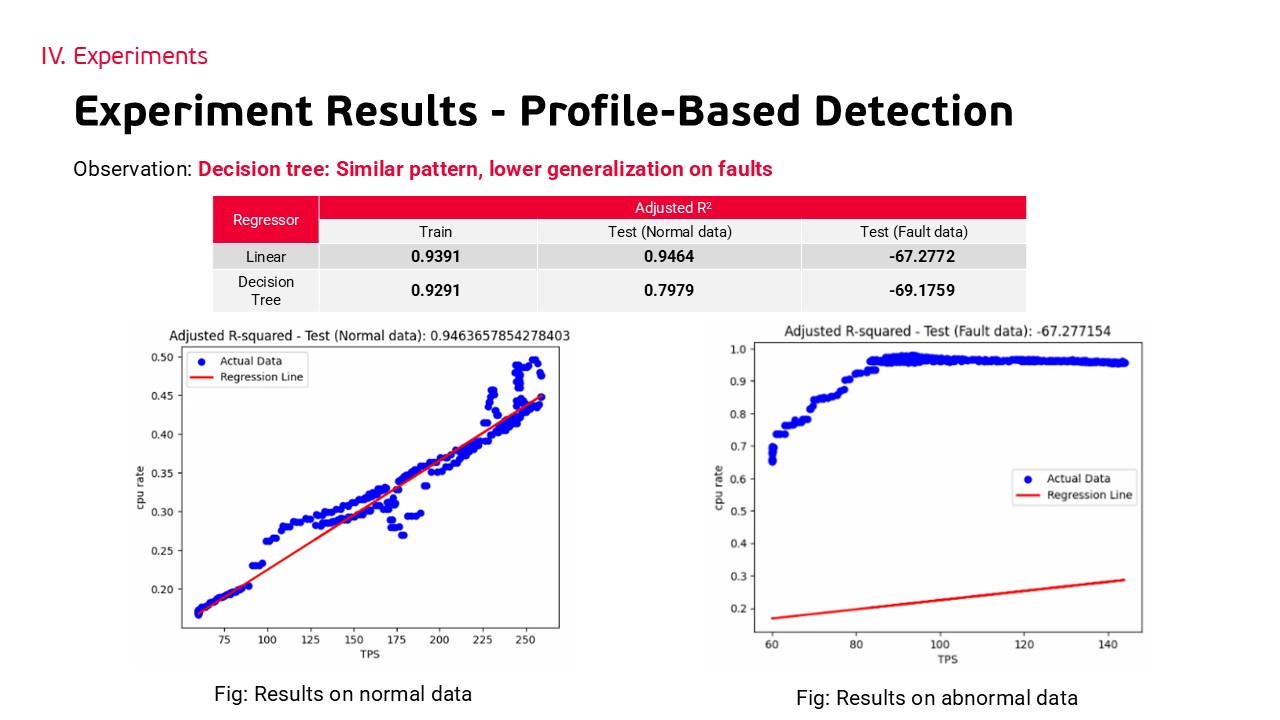 |
Here are the results on normal and fault data of two algorithms.
With our dataset, linear regression have show the better efficiency than decision tree regression on both the training dataset and the testing dataset.
The result on the test dataset was shown in this figure in two cases: normal logging and abnormal logging, which using DEBUG level logger and is usually not used in product environment.
On normal data, the regression fits well (left scatter plot); on fault data, the actual points deviate massively from the predicted line (right plot).
|
| ICACT20260142 Slide.26
[Big Slide]
|
Chrome Click!! |
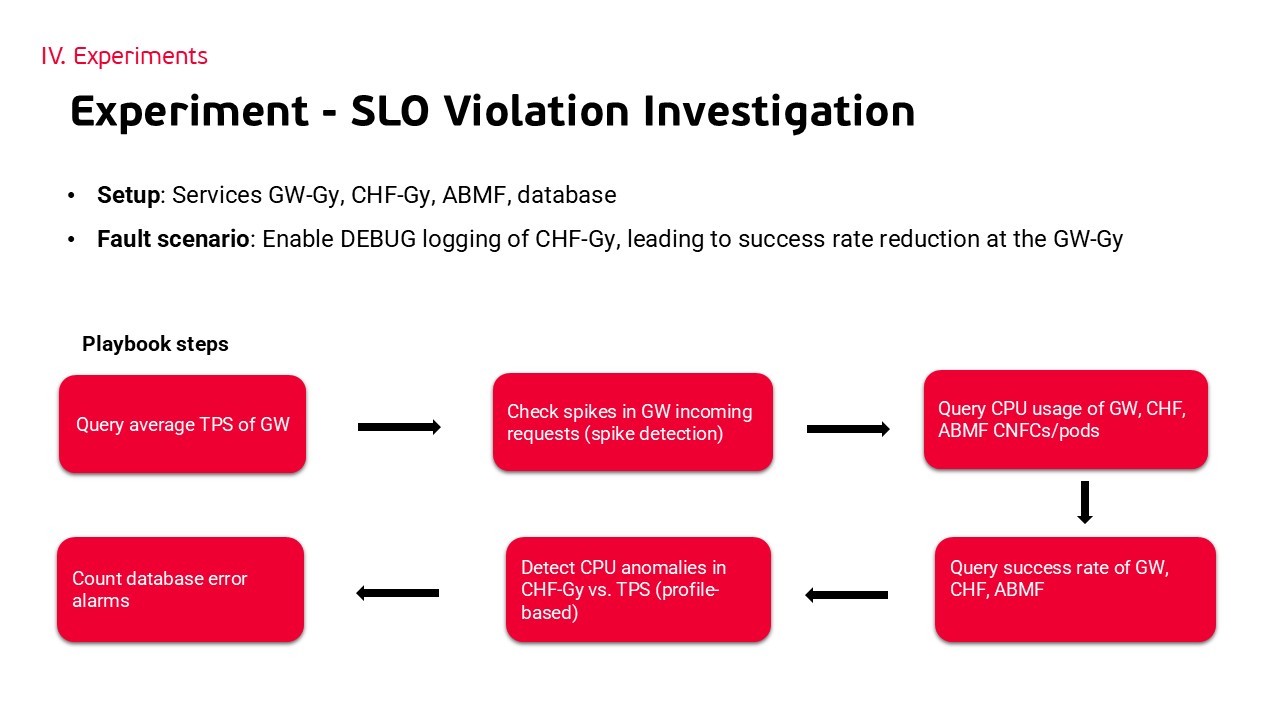 |
To validate the full framework, we simulated a simple OCS deployment with 4 services: GW-Gy, CHF-Gy, ABMF, and the database.
The fault scenario is Enable DEBUG logging of CHF-Gy, leading to a success rate reduction at the GW-Gy.
The playbook executed sequentially: Query GW average TPS, check spikes in GW incoming requests, check CPU usage, check success rates, run profile-based anomaly detection, and count database errors.
|
| ICACT20260142 Slide.27
[Big Slide]
|
Chrome Click!! |
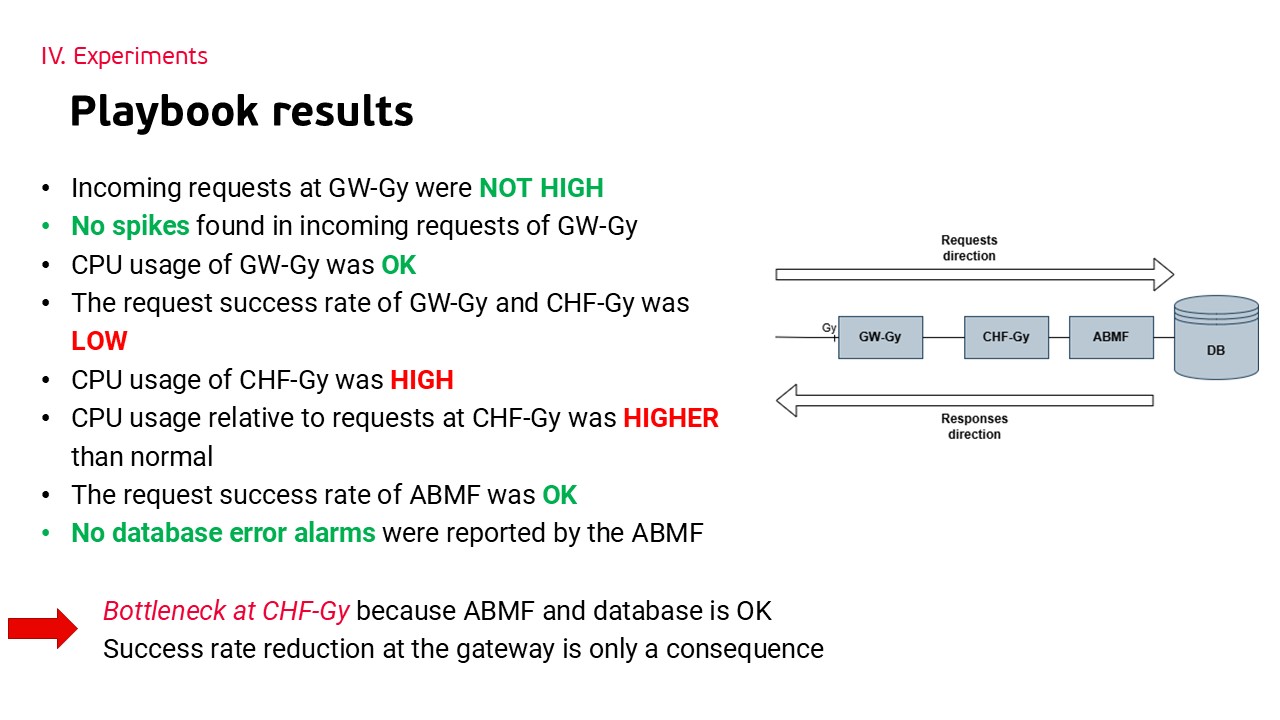 |
This is the result of our playbook.
The investigation located that CHF-Gy is the Bottleneck — showing high CPU relative to TPS, correlated with reduced success rates and profile deviations.
We can see no problem found in the database or the ABMF, and the success rate reduction at the gateway is only a consequence.
The Bottleneck may come from a software bug in CHF-Gy or misconfiguration. We can enhance the accuracy of this playbook by adding a step to check the software update history of CHF-Gy, for example, in the last 30 minutes before the incident.
|
| ICACT20260142 Slide.28
[Big Slide]
|
Chrome Click!! |
 |
Let’s wrap up with the main takeaways. In summary, we proposed an efficient playbook-based framework that integrates topology enrichment, time-series pattern detection, and profile-based anomaly analysis to investigate SLO violations in 5G OCS.
Experiments confirm high detection accuracy and practical root-cause localization, reducing MTTR and supporting near-zero-downtime requirements.
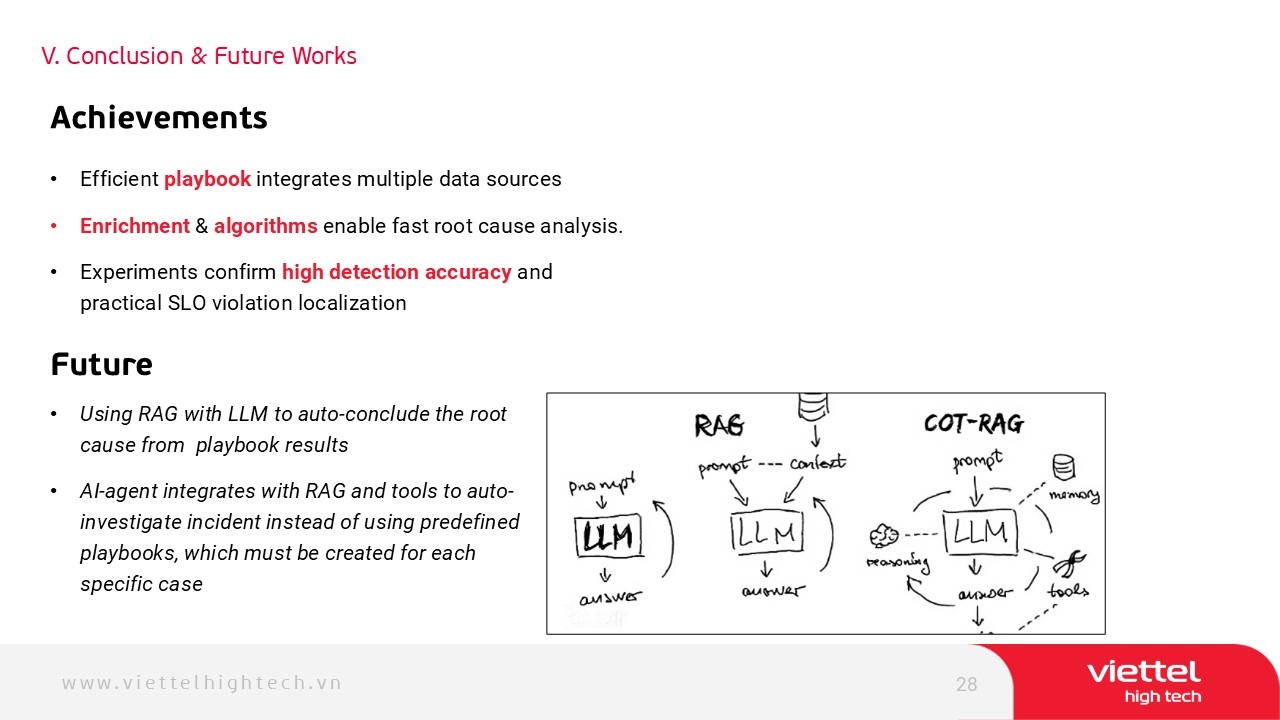
In the future, we will use RAG with LLM to auto-conclude the root cause from playbook results.
We also target to build an AI-agent integrates with RAG and tools to auto-investigate instead of using predefined playbooks, which must be created for each specific case.
|
| ICACT20260142 Slide.29
[Big Slide]
|
Chrome Click!! |
 |
So this is the end of our presentation. Thank you for listening.
|















