 ICACT20260214 Slide.01
[Big Slide]
[YouTube] |
Chrome  Click!! |
 |
Good afternoon, everyone. I am Ho-Min Park from ETRI, and I am honored to share our findings with you. Today, I am pleased to present our latest research on An End-to-End Predictive Maintenance System for Autonomous Inspection based on Health Index. In this session, I will demonstrate how we transitioned from the traditional, labor-intensive manual inspection, to a fully autonomous, standards-compliant digital system that is ready for the smart factory era. |
| ICACT20260214 Slide.02
[Big Slide]
[YouTube] |
Chrome Click!! |
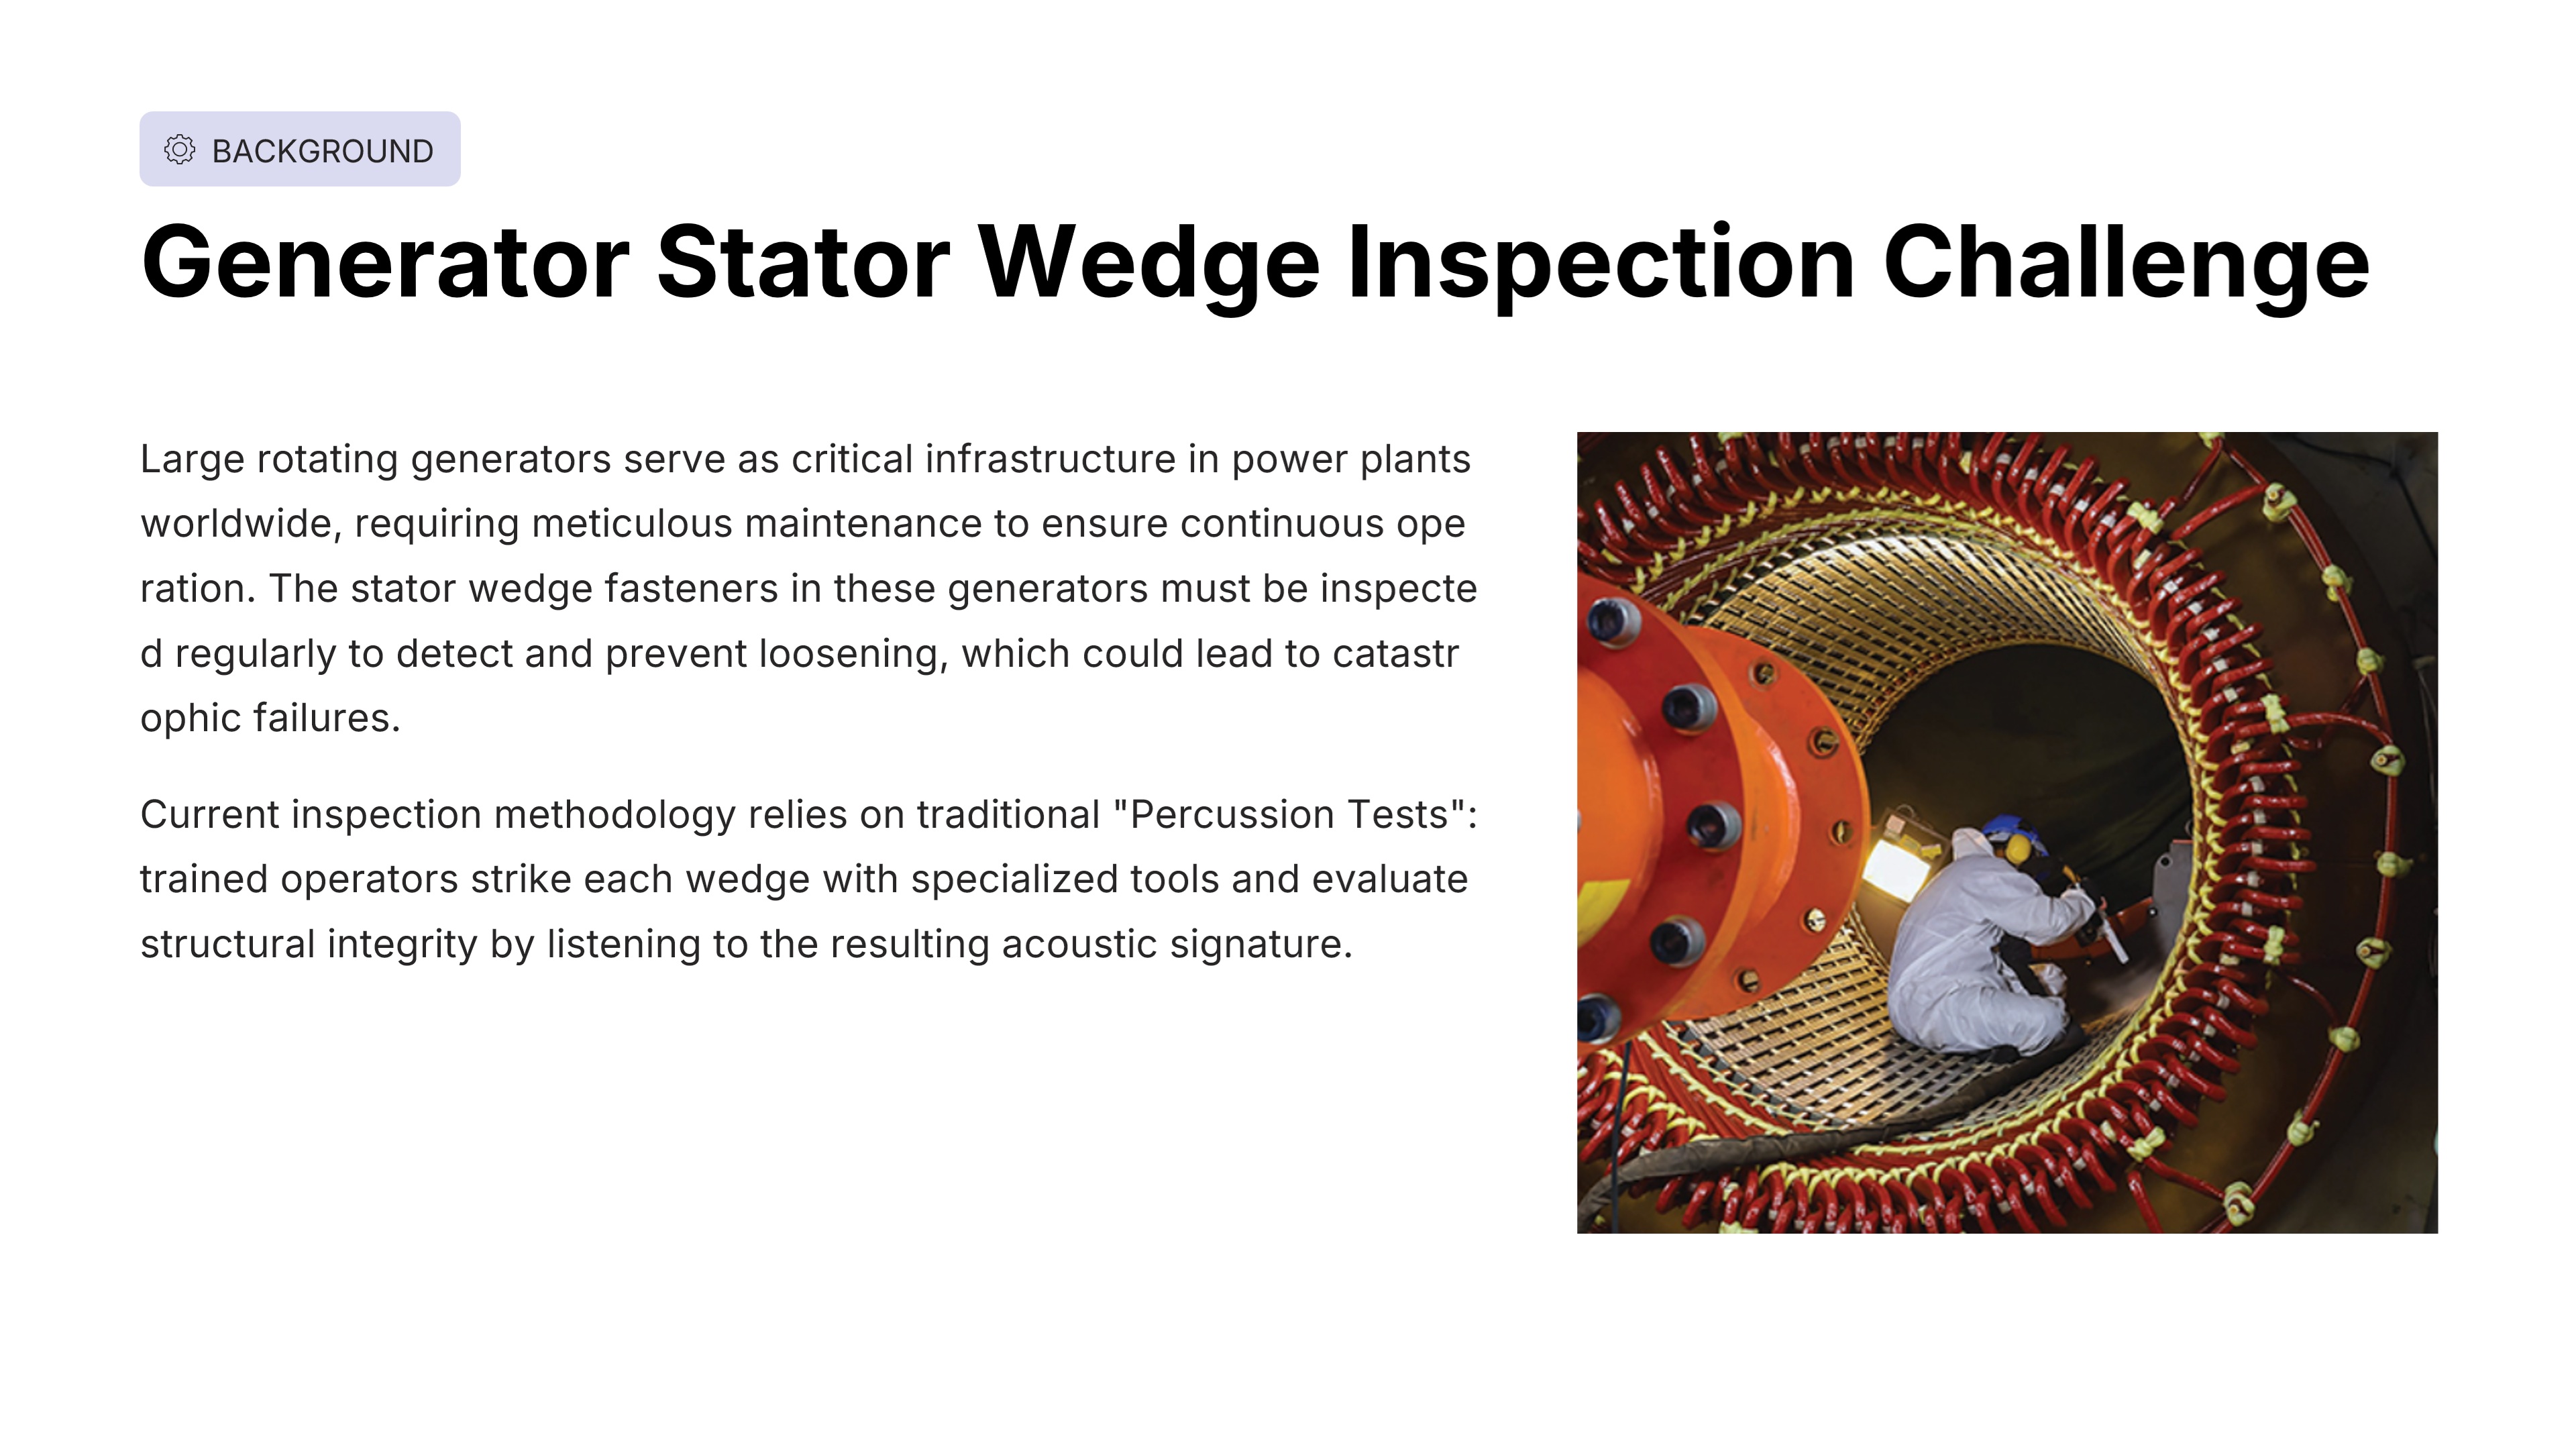 |
Let’s start with the background context. As many of you know, large rotating generators are the absolute heart of power plants, and their reliability is non-negotiable. The critical component here is the Stator Wedge. If these fasteners loosen over time, it can lead to catastrophic vibration and eventual machine failure. Currently, to prevent this, we rely on the Percussion Test. It’s a rather primitive method, where a trained operator physically strikes the wedge with a hammer, and listens to the sound to judge its tightness. |
| ICACT20260214 Slide.03
[Big Slide]
[YouTube] |
Chrome Click!! |
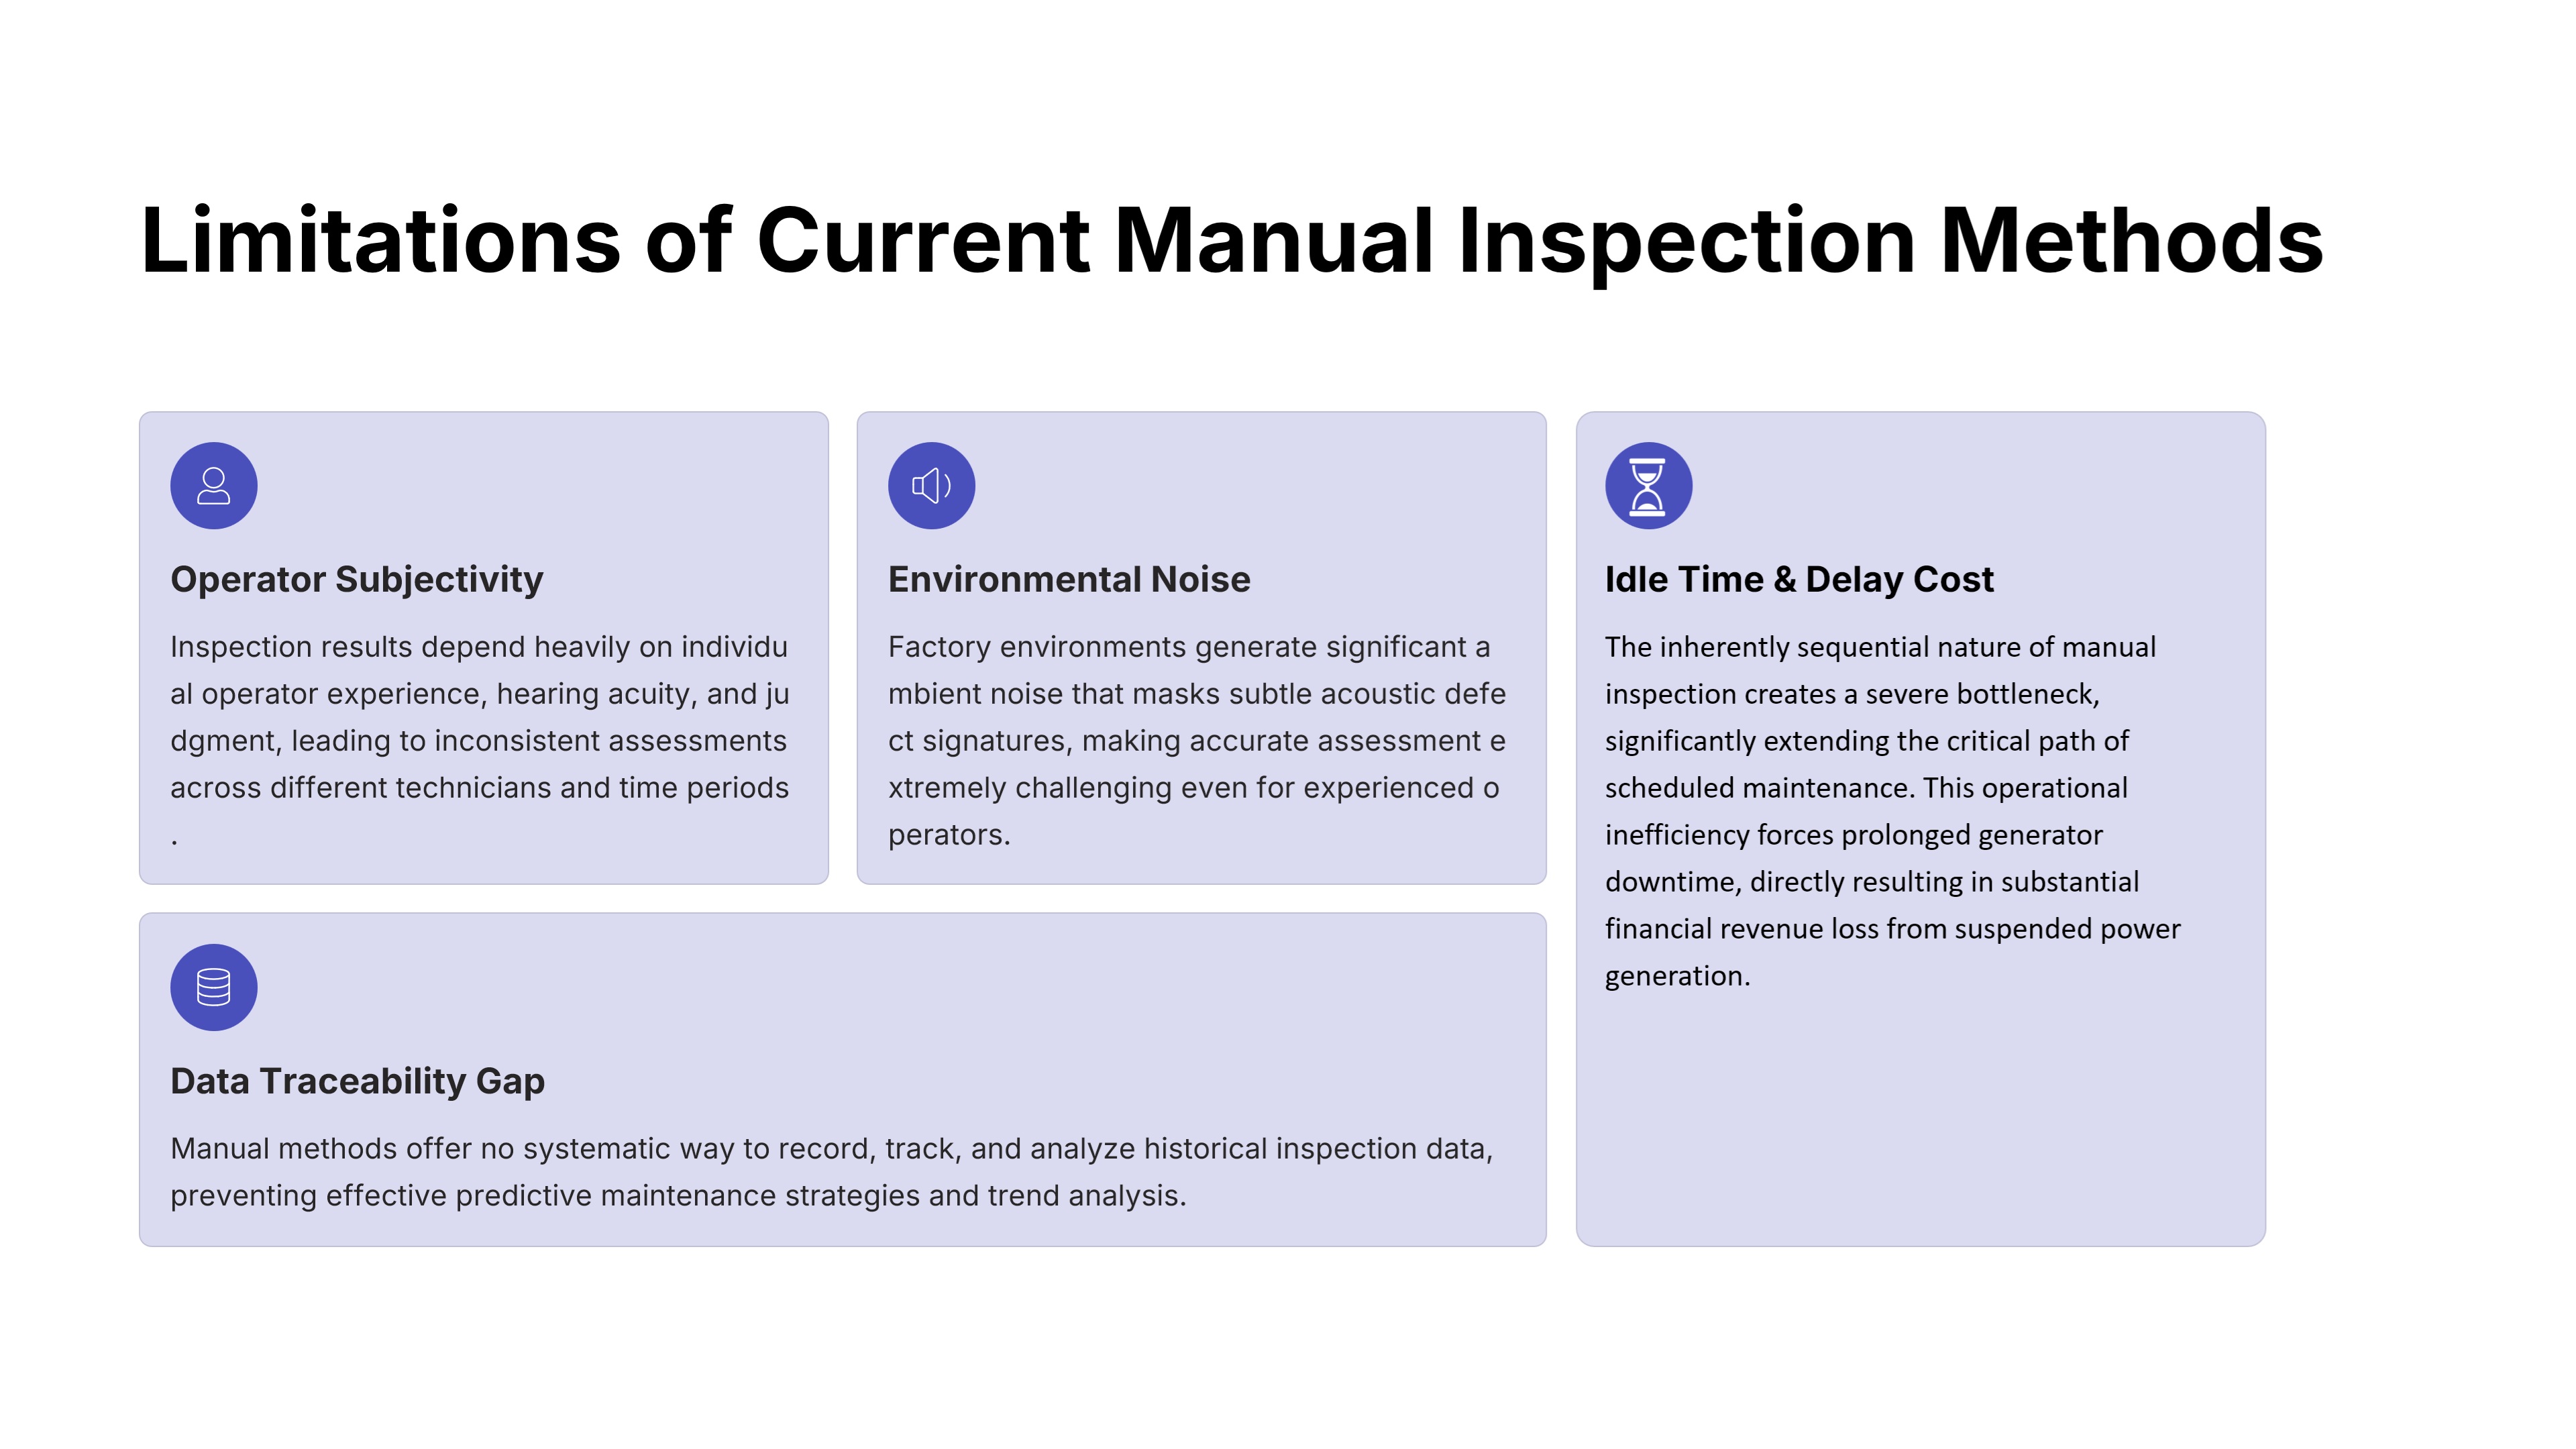 |
However, this manual method has severe limitations that we need to address. First, there is the issue of Operator Subjectivity. The results depend entirely on the operators individual hearing and experience, which varies from person to person. It’s very hard to get consistent, objective data. Second, Environmental Noise. Power plants are incredibly loud environments. Even expert ears struggle to distinguish the subtle acoustic signatures of a defect amidst that roar. Third, Idle Time. Manual inspection is inherently slow and sequential, causing expensive downtime for the generator. Finally, there is a Data Traceability Gap. We have no digital history of these inspections, making any kind of long-term predictive trend analysis virtually impossible. |
| ICACT20260214 Slide.04
[Big Slide]
[YouTube] |
Chrome Click!! |
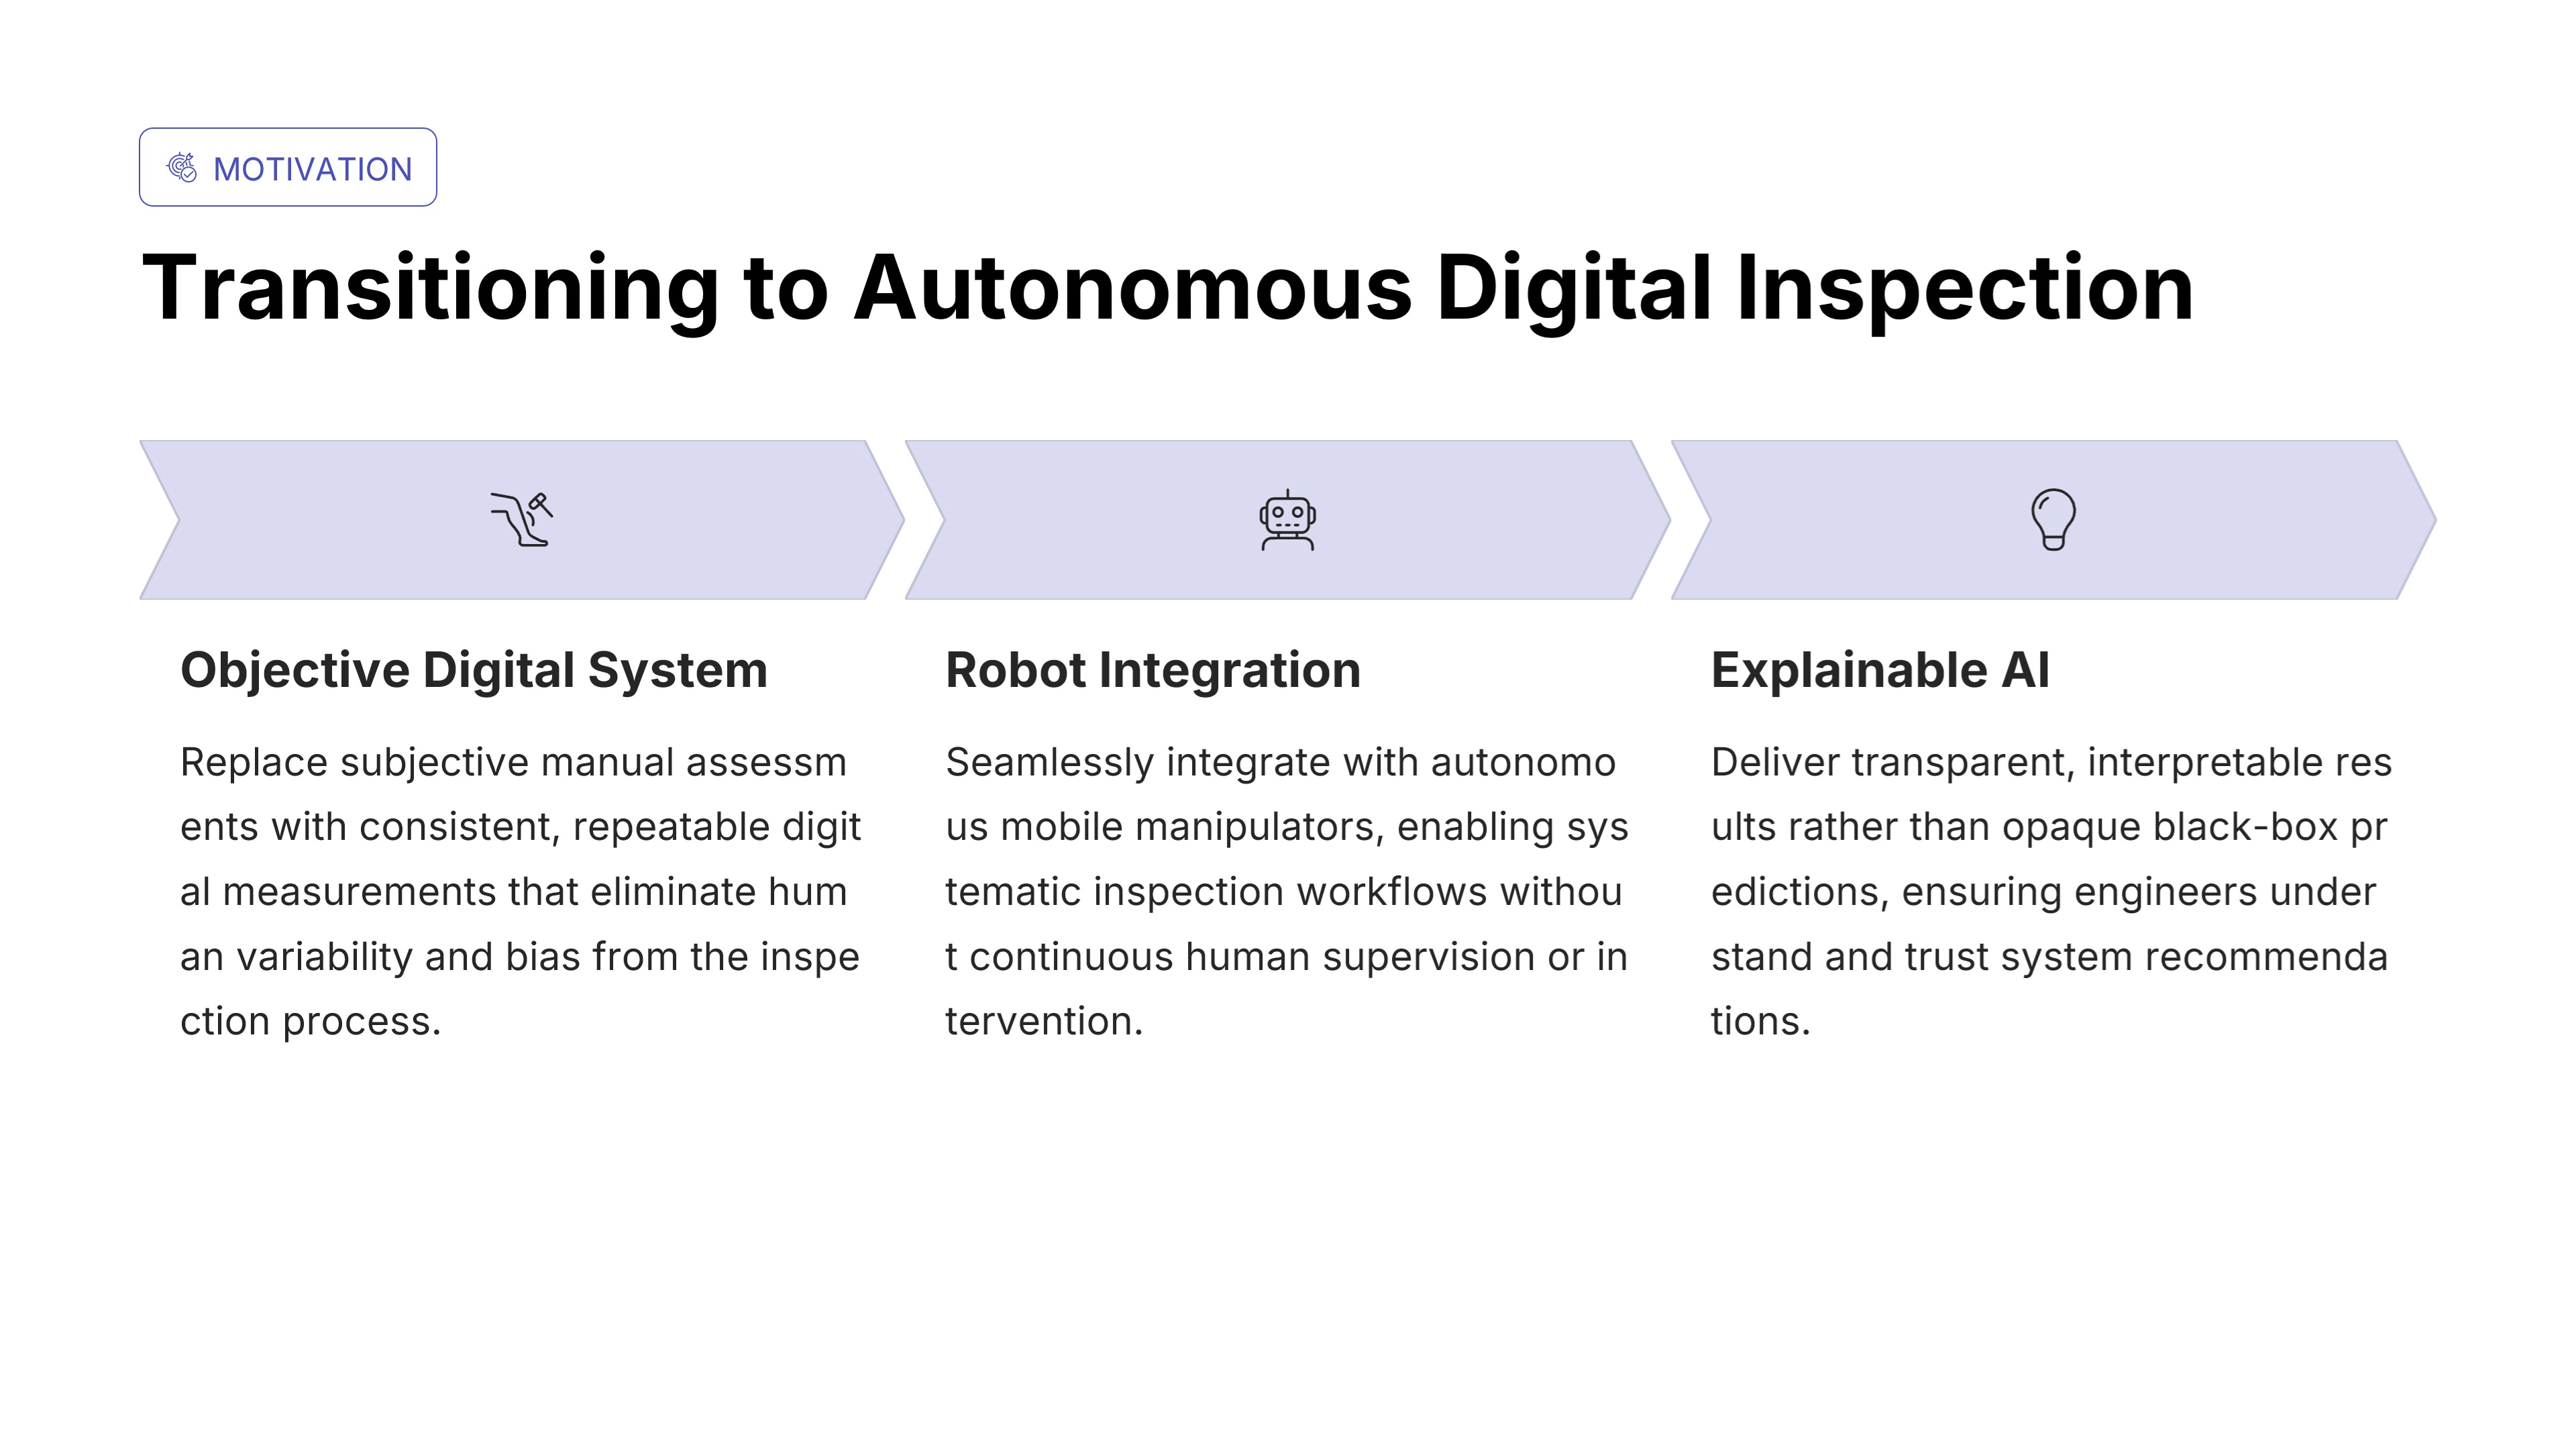 |
This brings us to our core motivation. Our goal is to fundamentally shift the paradigm to an Autonomous Digital Inspection. We aim to replace subjective human judgment with Objective Digital Systems, and seamlessly integrate this with Mobile Manipulators for full autonomy. And most importantly, we want to provide Explainable AI. It is crucial that field engineers can physically trust the results and understand the logic, rather than relying on an opaque, black-box decision that they cannot verify. |
| ICACT20260214 Slide.05
[Big Slide]
[YouTube] |
Chrome Click!! |
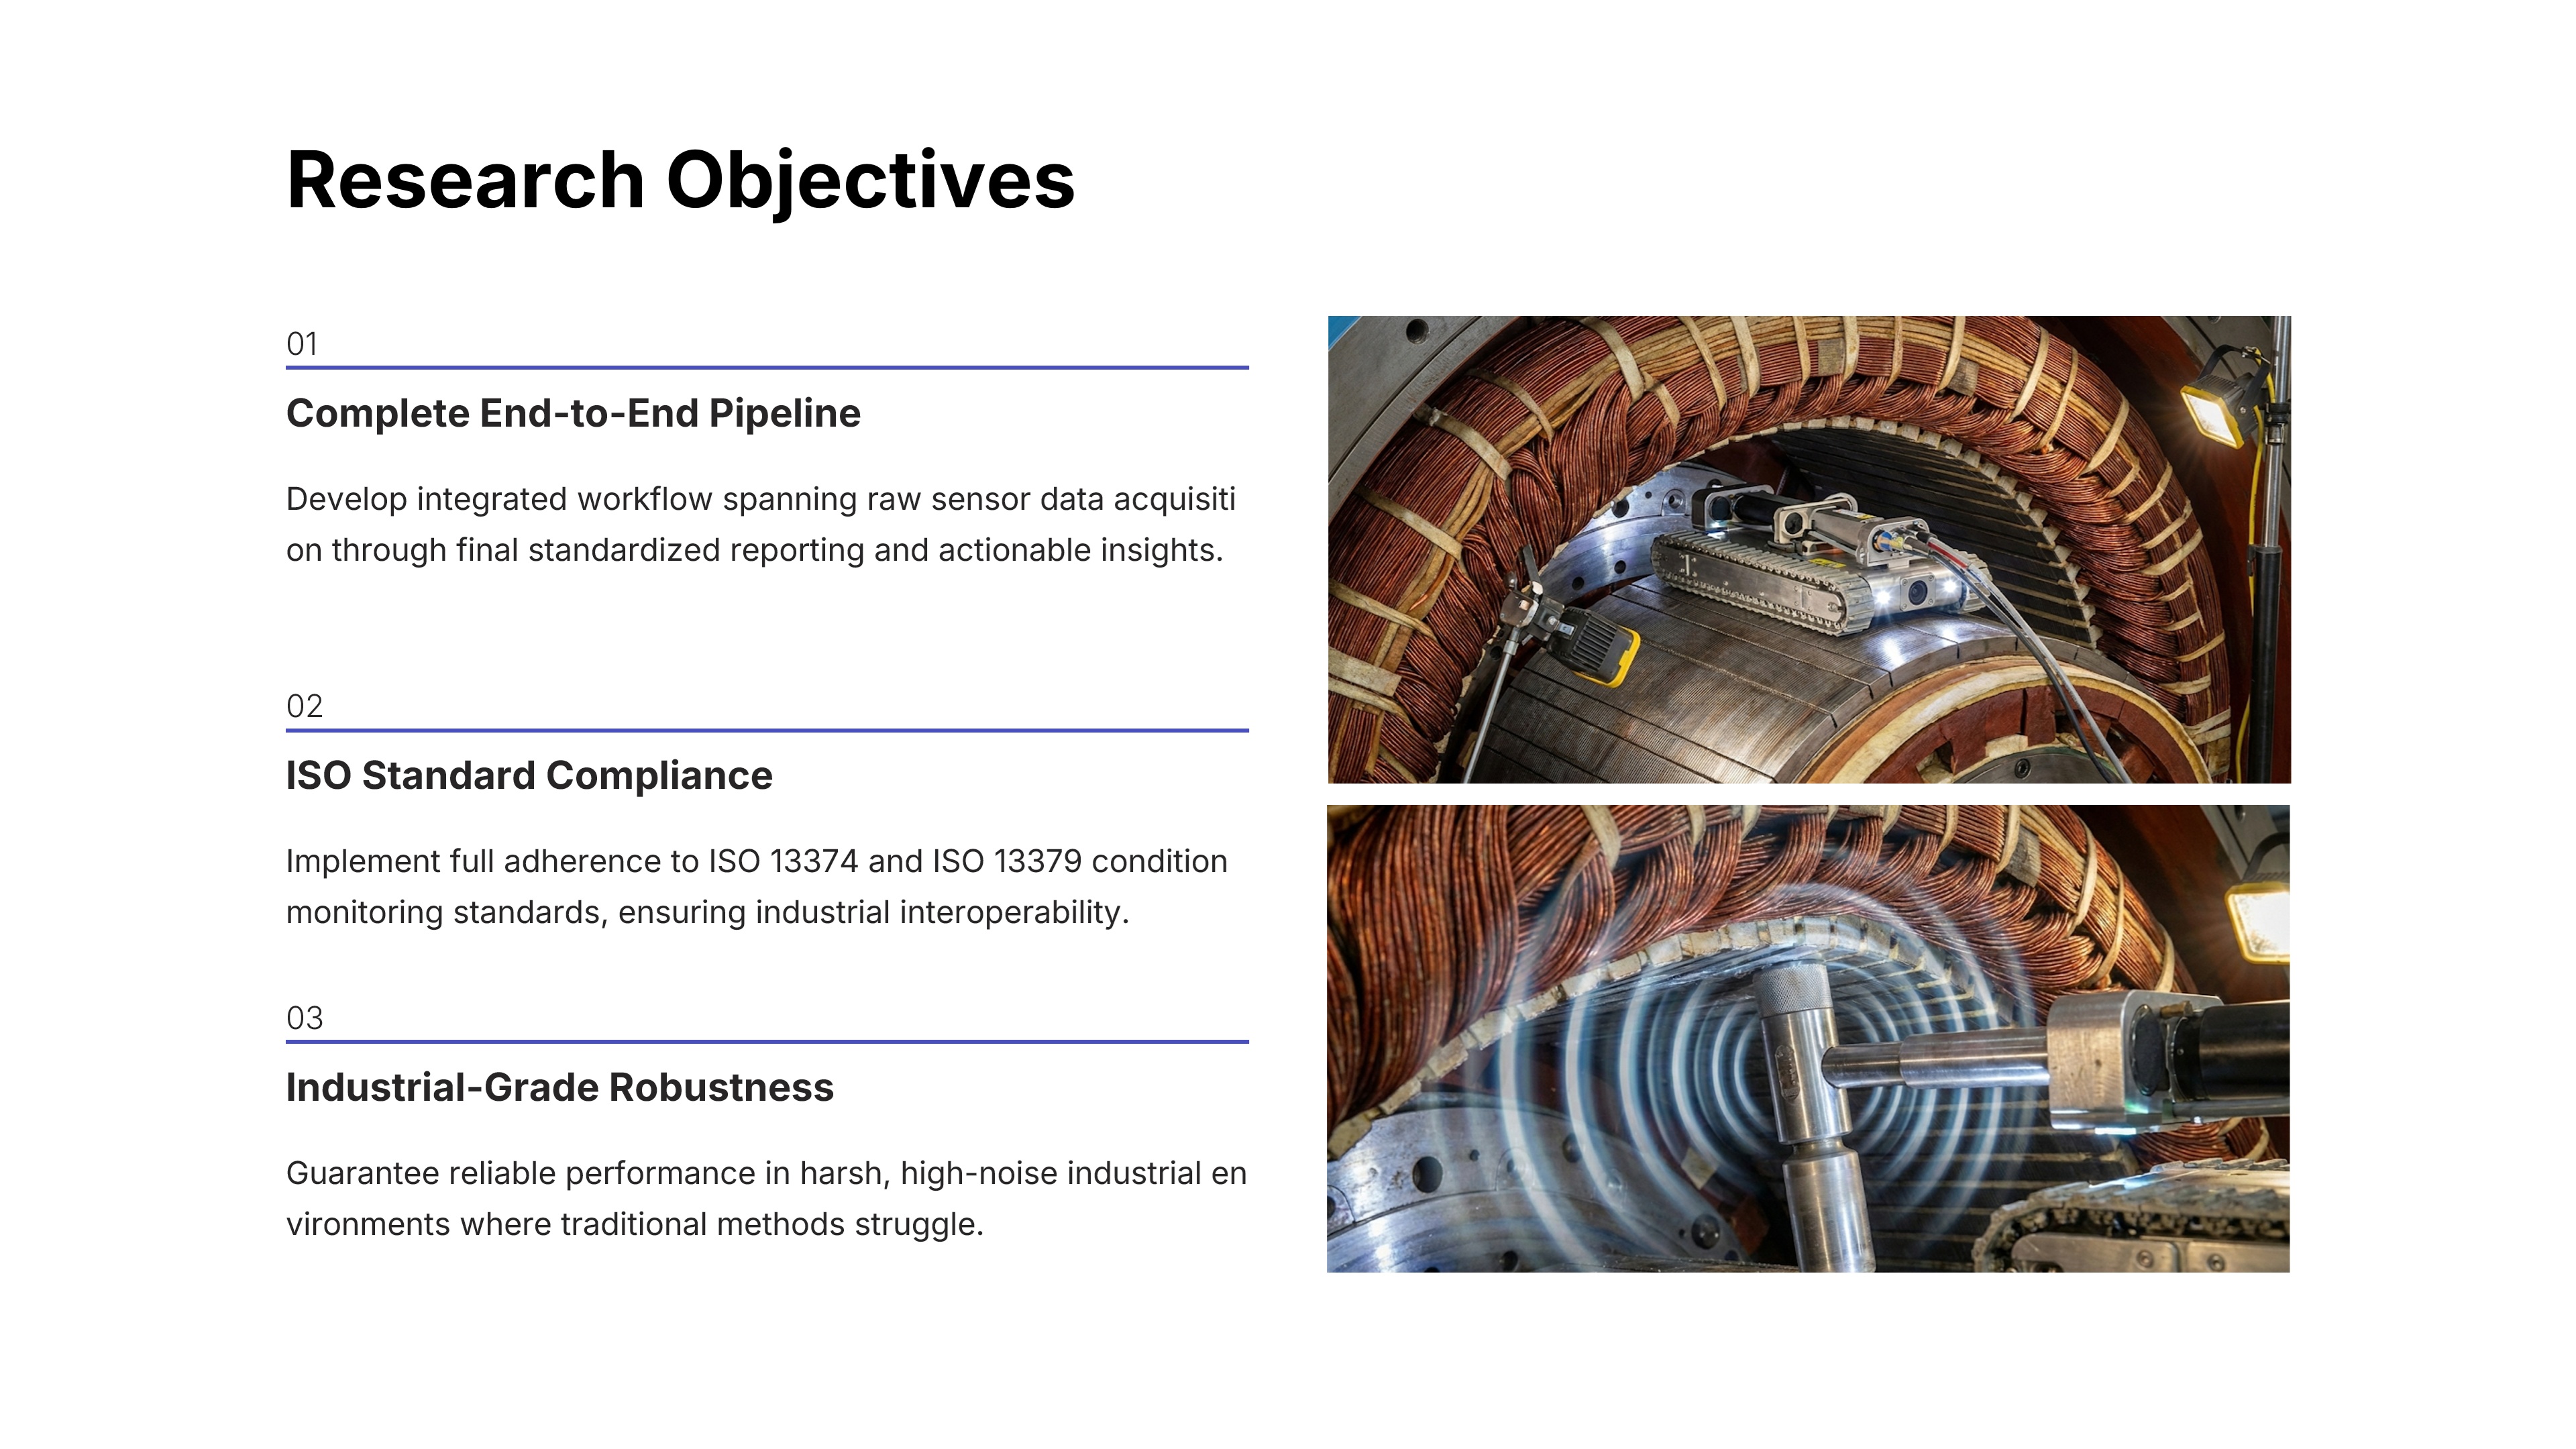 |
To achieve this ambitious goal, we set three main objectives for this research. First, Build a complete End-to-End Pipeline, covering everything from raw data acquisition at the sensor level, to the final report generation. Second, Ensure full ISO Standard Compliance, specifically ISO 13374 and 13379, to guarantee industrial interoperability and standardized data handling. And third, guarantee Industrial-Grade Robustness, ensuring the system works reliably and consistently, even in the harsh, high-noise environments of a real power plant. |
| ICACT20260214 Slide.06
[Big Slide]
[YouTube] |
Chrome Click!! |
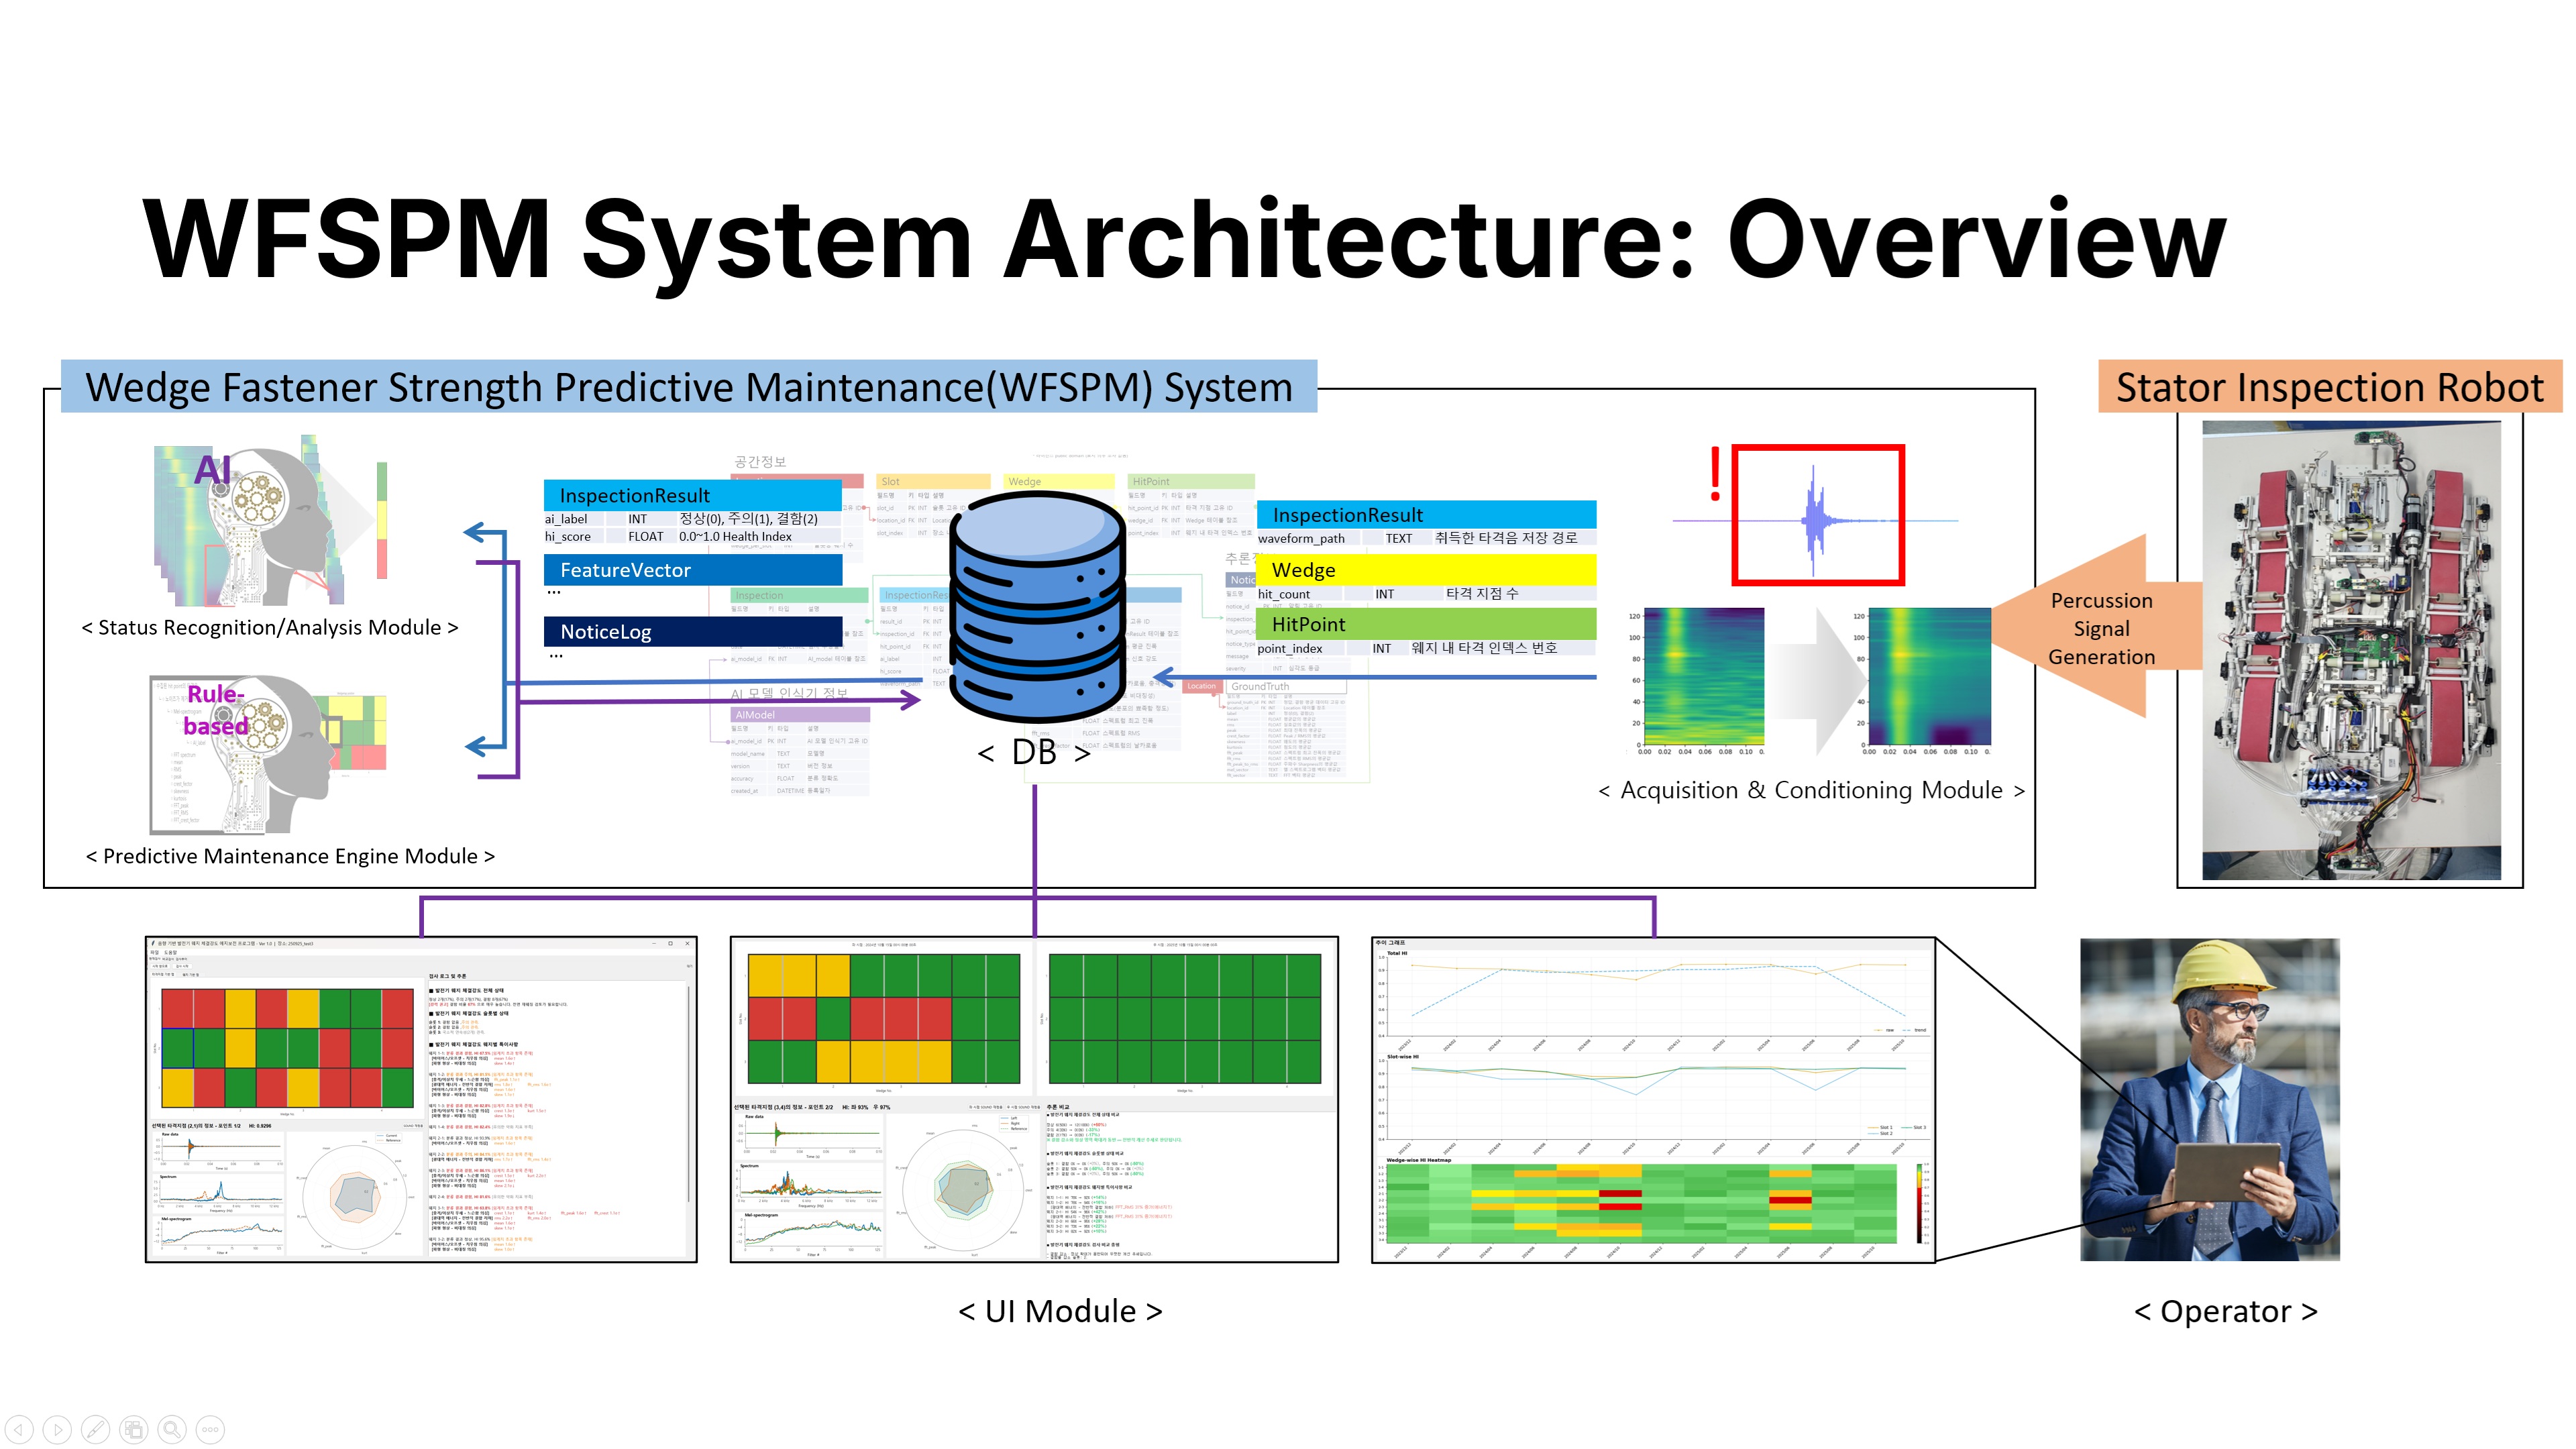 |
Here is the detailed overview of our proposed WFSPM system architecture. As you can see, it is not just a single algorithm, but a comprehensive, full-stack solution designed for real-world deployment. The architecture consists of several distinct, interconnected modules. On the far left, we have the Inspection Robot and the Acquisition Module, which capture the raw percussion signals. These signals are then passed to the Status Recognition and Analysis Module. This is where the core signal processing happens, extracting features and calculating the Health Index. This module doesnt just look at a single hit, but aggregates data to make a robust assessment. Next, we have the Predictive Maintenance Engine. This engine takes the analysis results, and applies our dual-threshold logic to determine the current state, whether it is Normal, Caution, or Fault. It also handles the logic for triggering re-inspections. All of this data is securely stored in our Database, which acts as the backbone for traceability. Finally, on the right, we have the UI Module and reporting tools. This seamlessly connects the physical inspection robot, to the user interface, providing real-time feedback to the operator. This entire loop, from the robots sensor to the users screen, operates autonomously, ensuring a closed-loop system for maintenance. |
| ICACT20260214 Slide.07
[Big Slide]
[YouTube] |
Chrome Click!! |
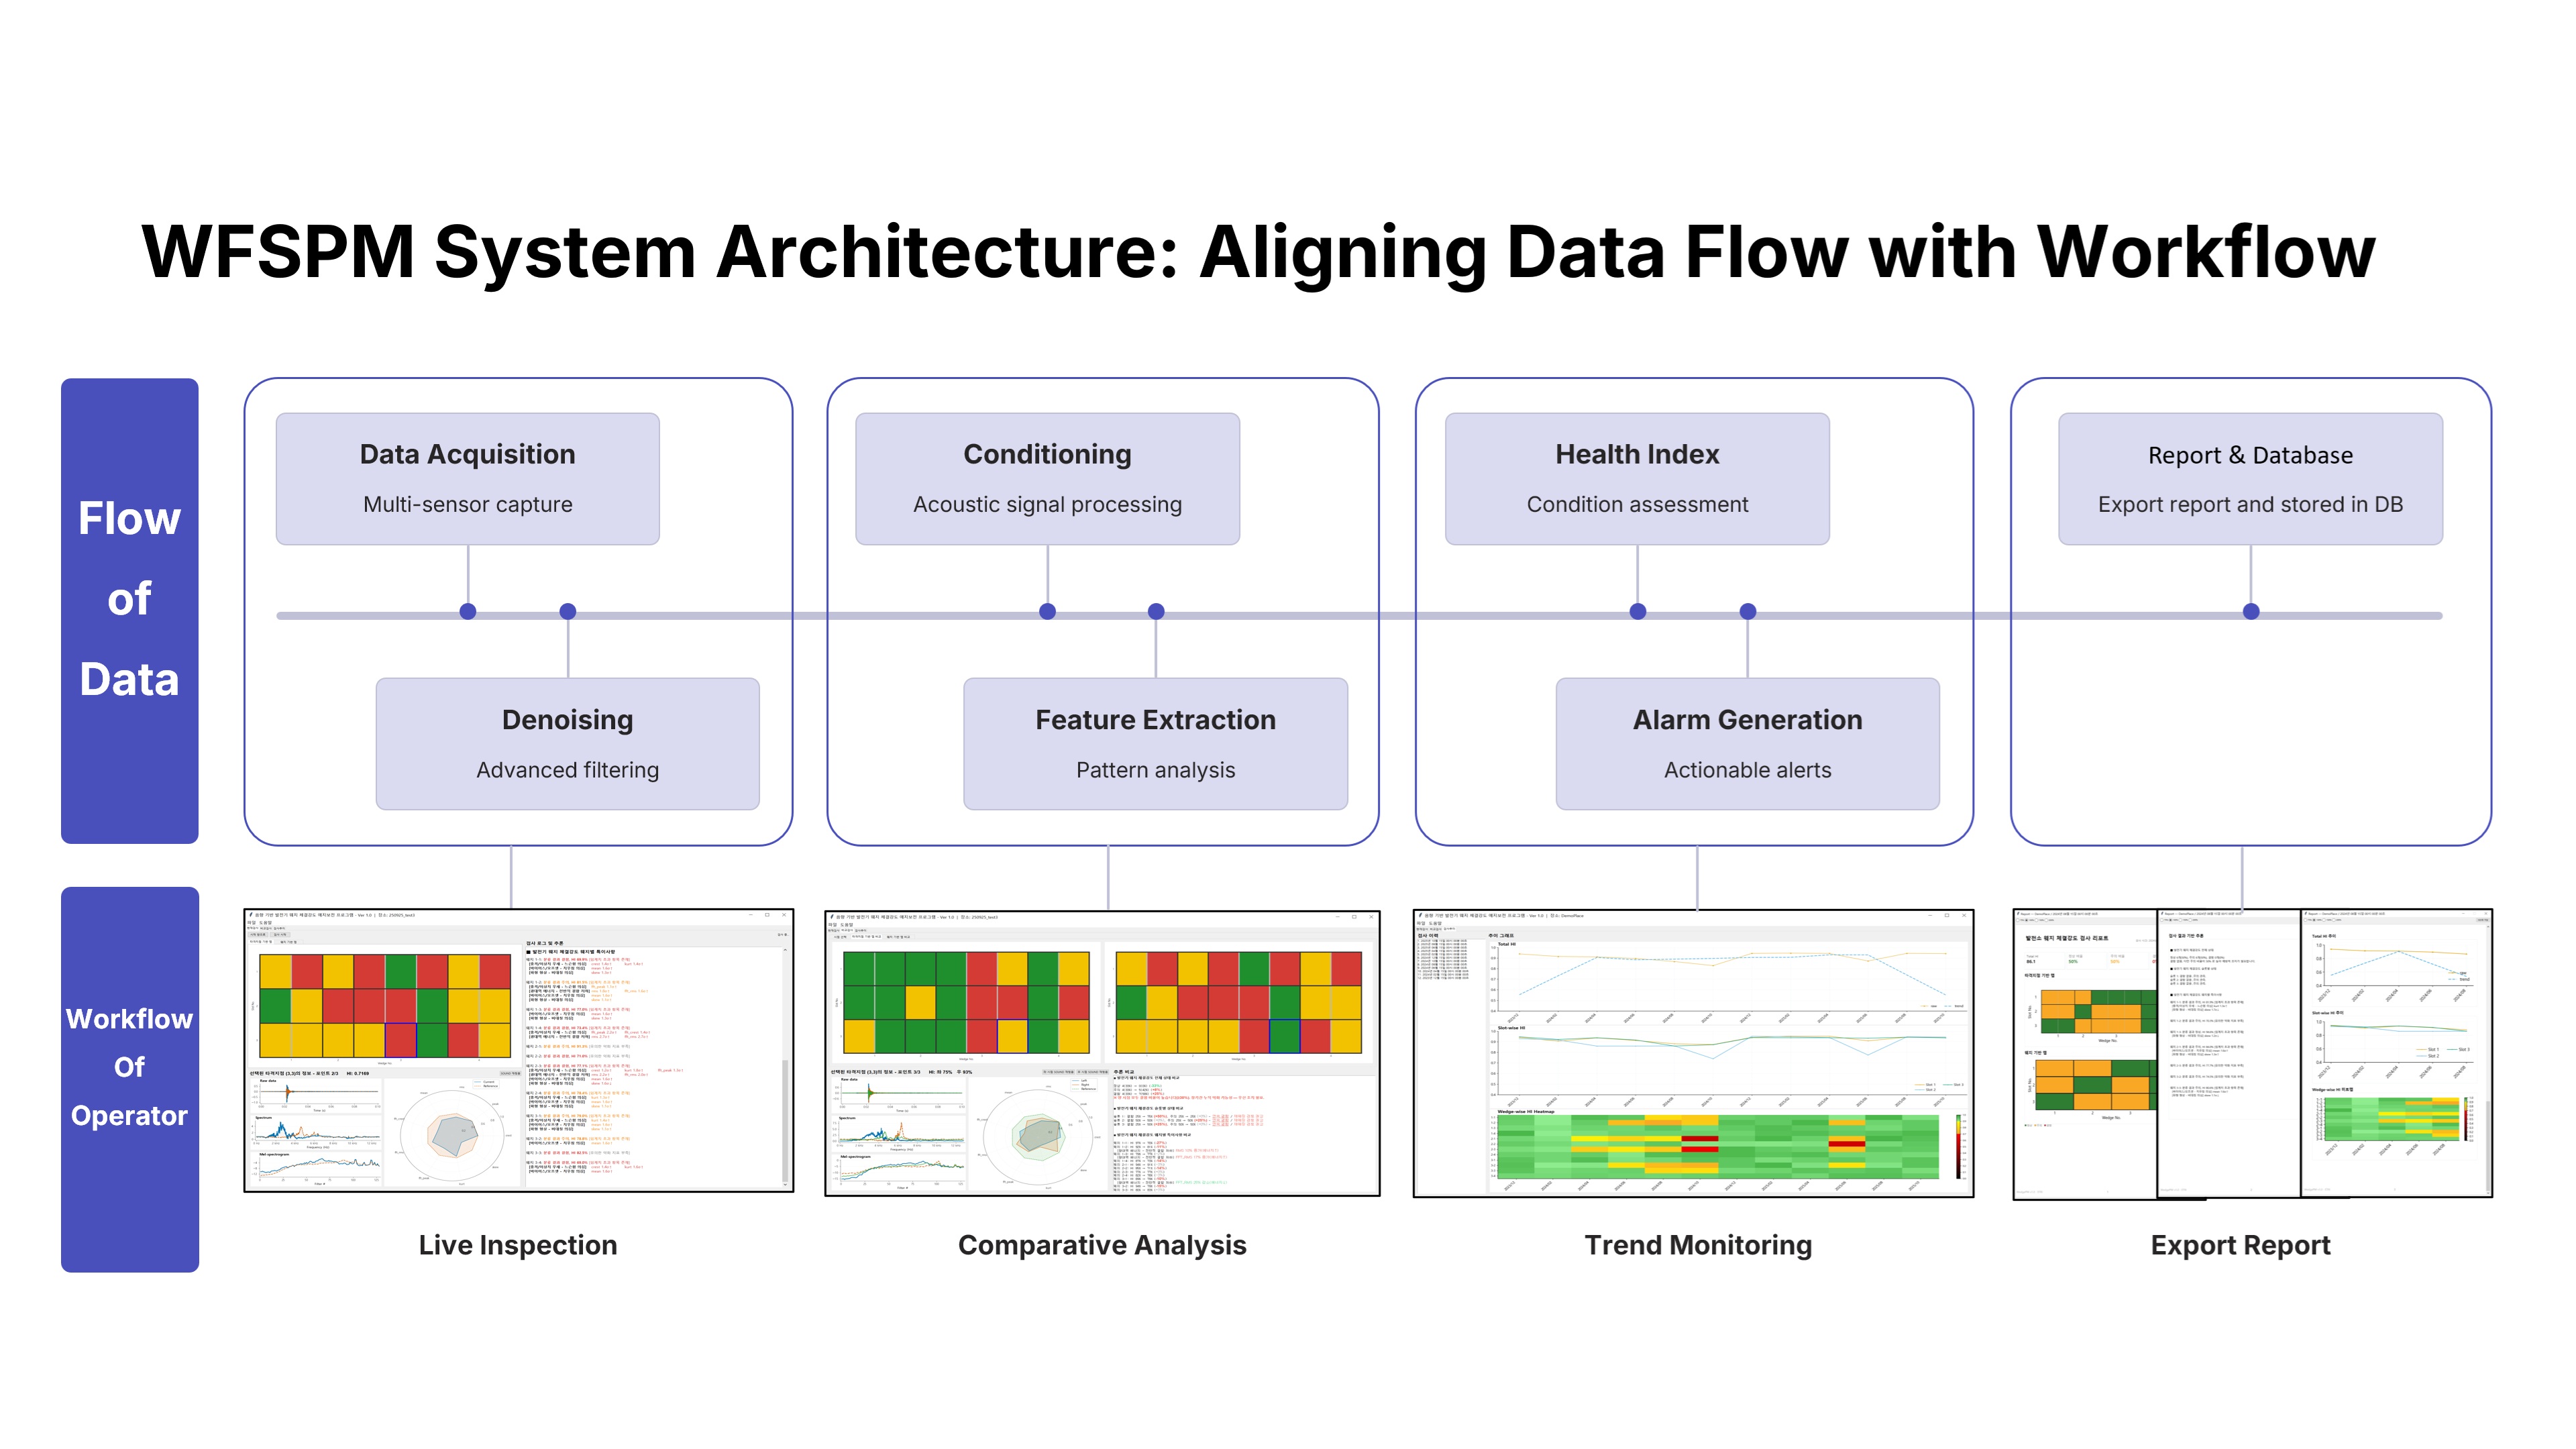 |
We designed the data flow to strictly mirror the actual inspection workflow used by field experts. It starts with Acquisition and Denoising to clean the signal, moves to Conditioning and Feature Extraction to understand the physics of the sound, calculates the Health Index for a quantitative score, and finally generates Alarms and Reports. This structured approach ensures that every single step of the data processing pipeline, directly supports and enhances the operators decision-making process, rather than complicating it. |
| ICACT20260214 Slide.08
[Big Slide]
[YouTube] |
Chrome Click!! |
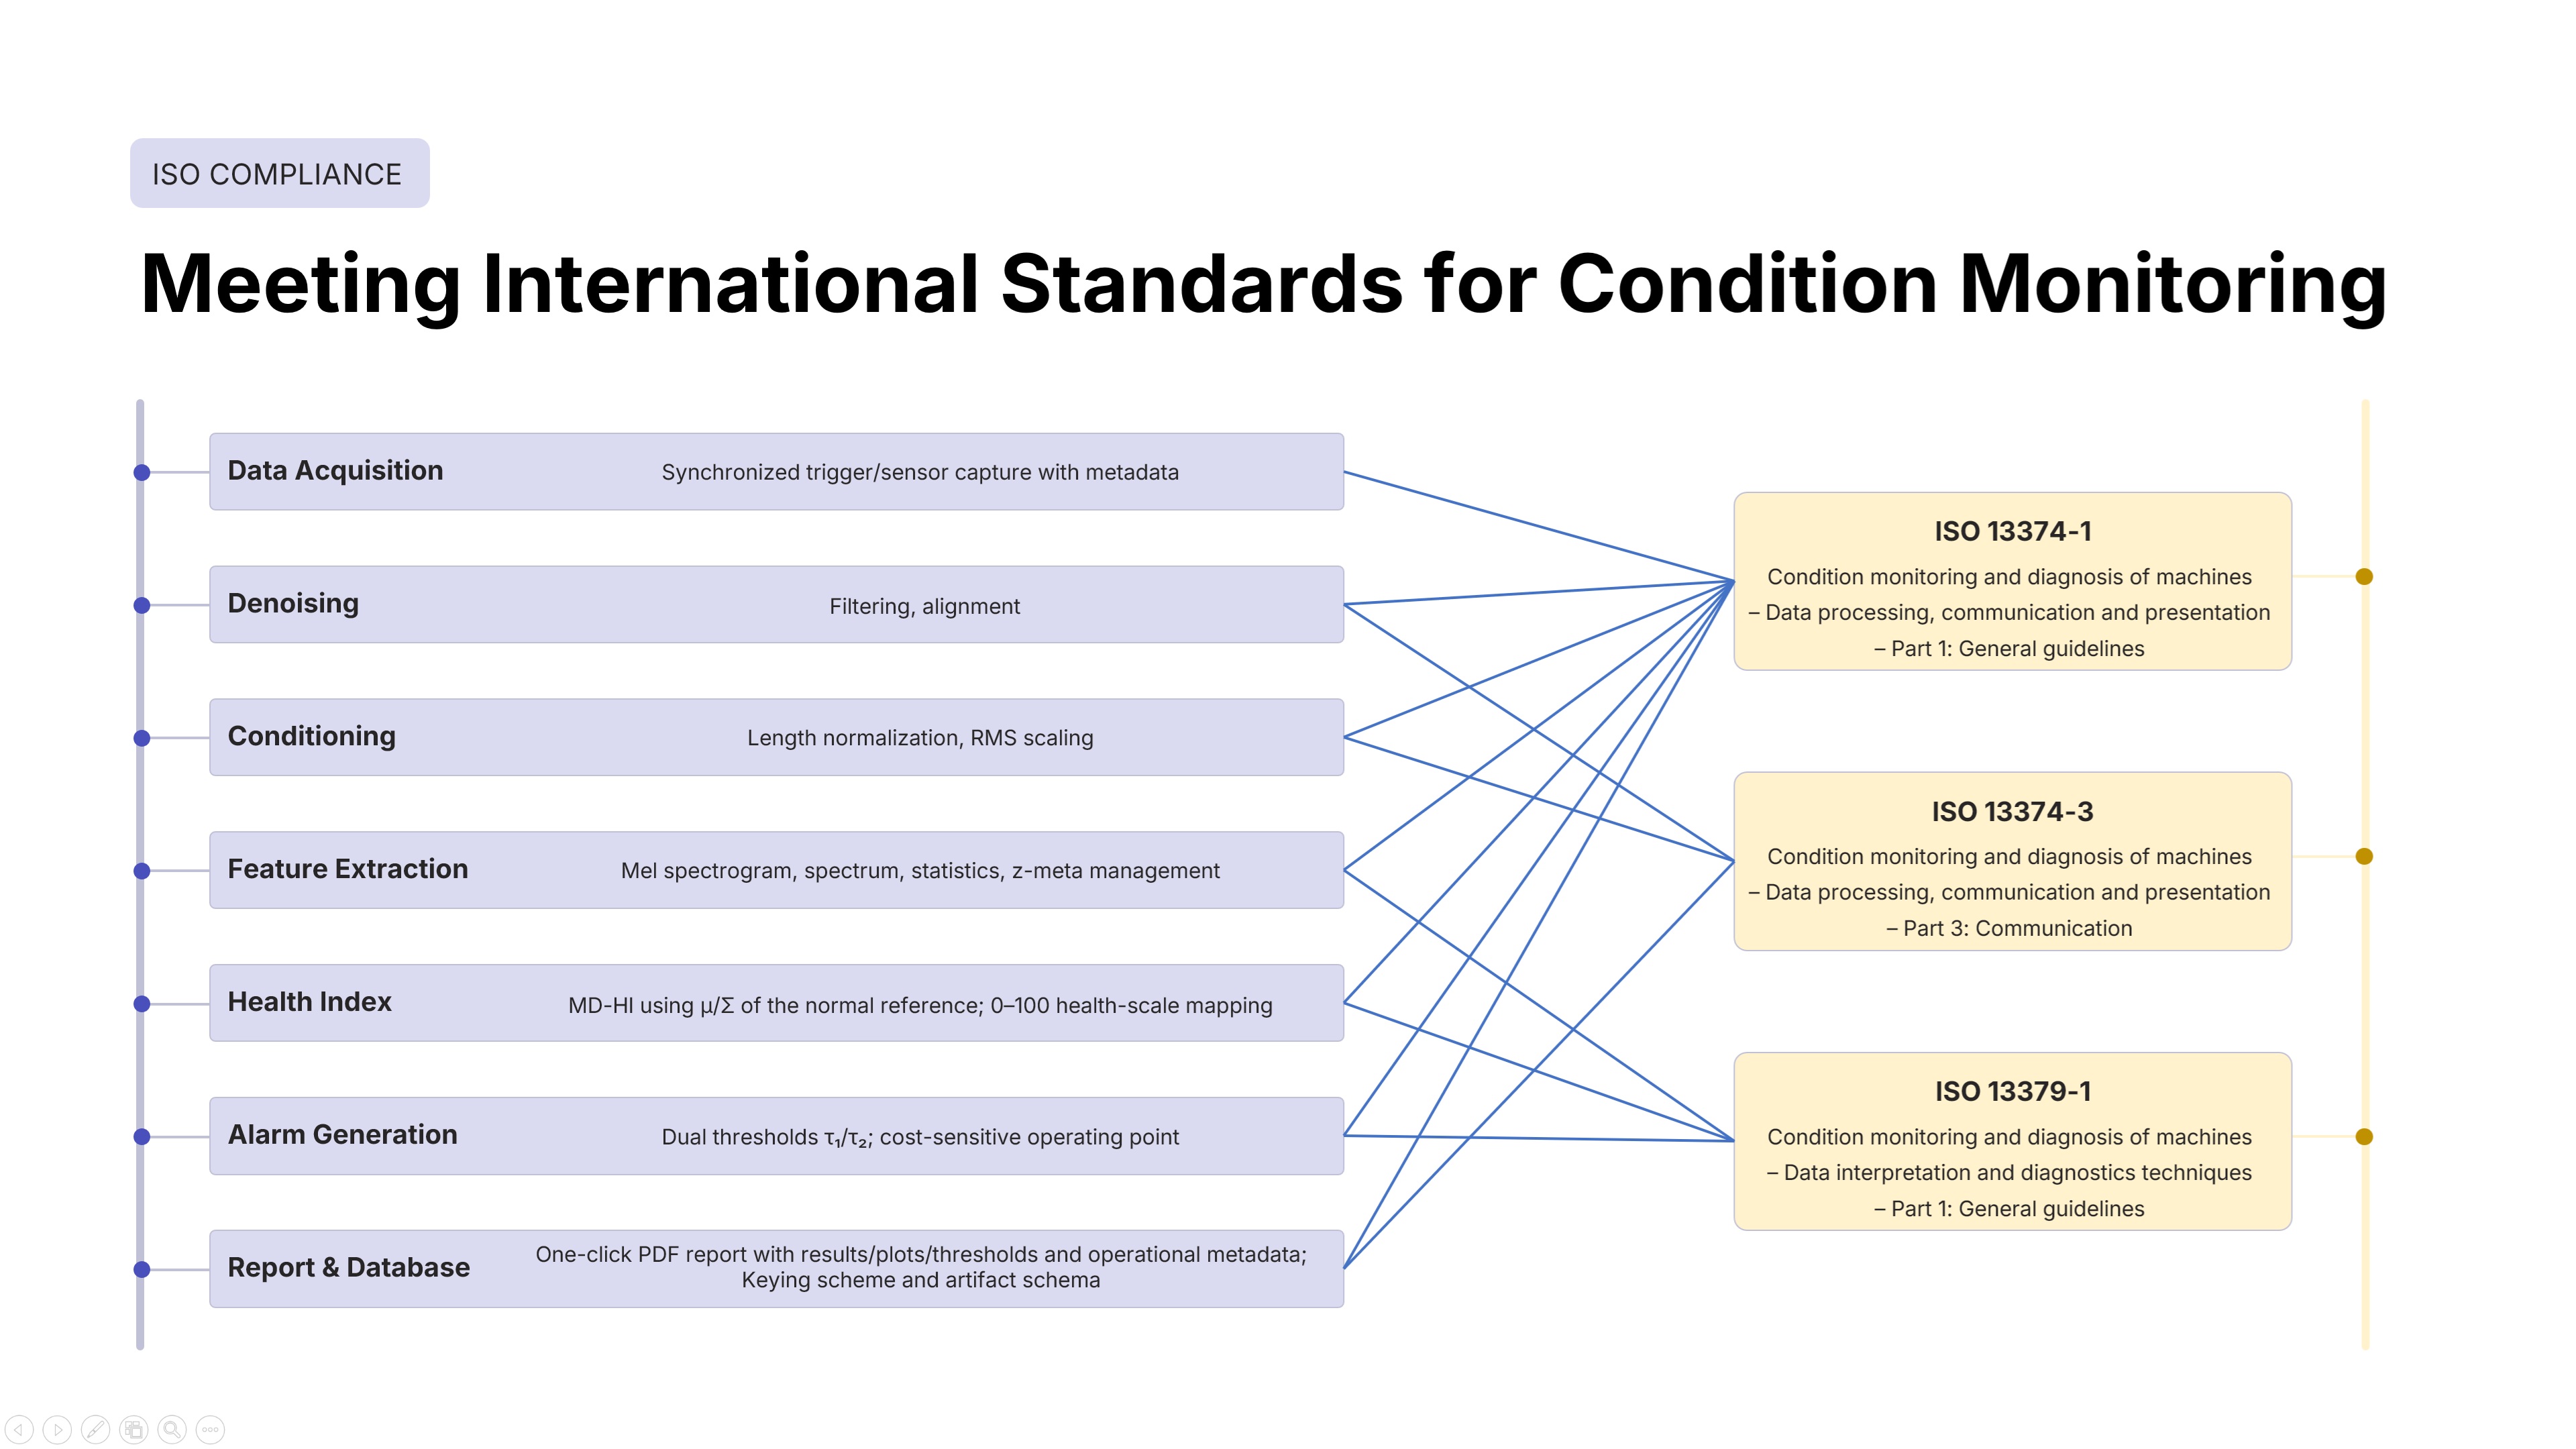 |
A key contribution of this work, and what sets it apart, is our strict alignment with international standards. We didnt just build a custom solution from scratch, we mapped every single module to ISO 13374 and 13379 guidelines. For example, our Data Acquisition block matches ISO 13374 Part 1 requirements, and our Alarm Generation logic follows the diagnostic guidelines of ISO 13379. This ensures our system is not a siloed tool, but one that can easily integrate with existing industrial frameworks and legacy systems. |
| ICACT20260214 Slide.09
[Big Slide]
[YouTube] |
Chrome Click!! |
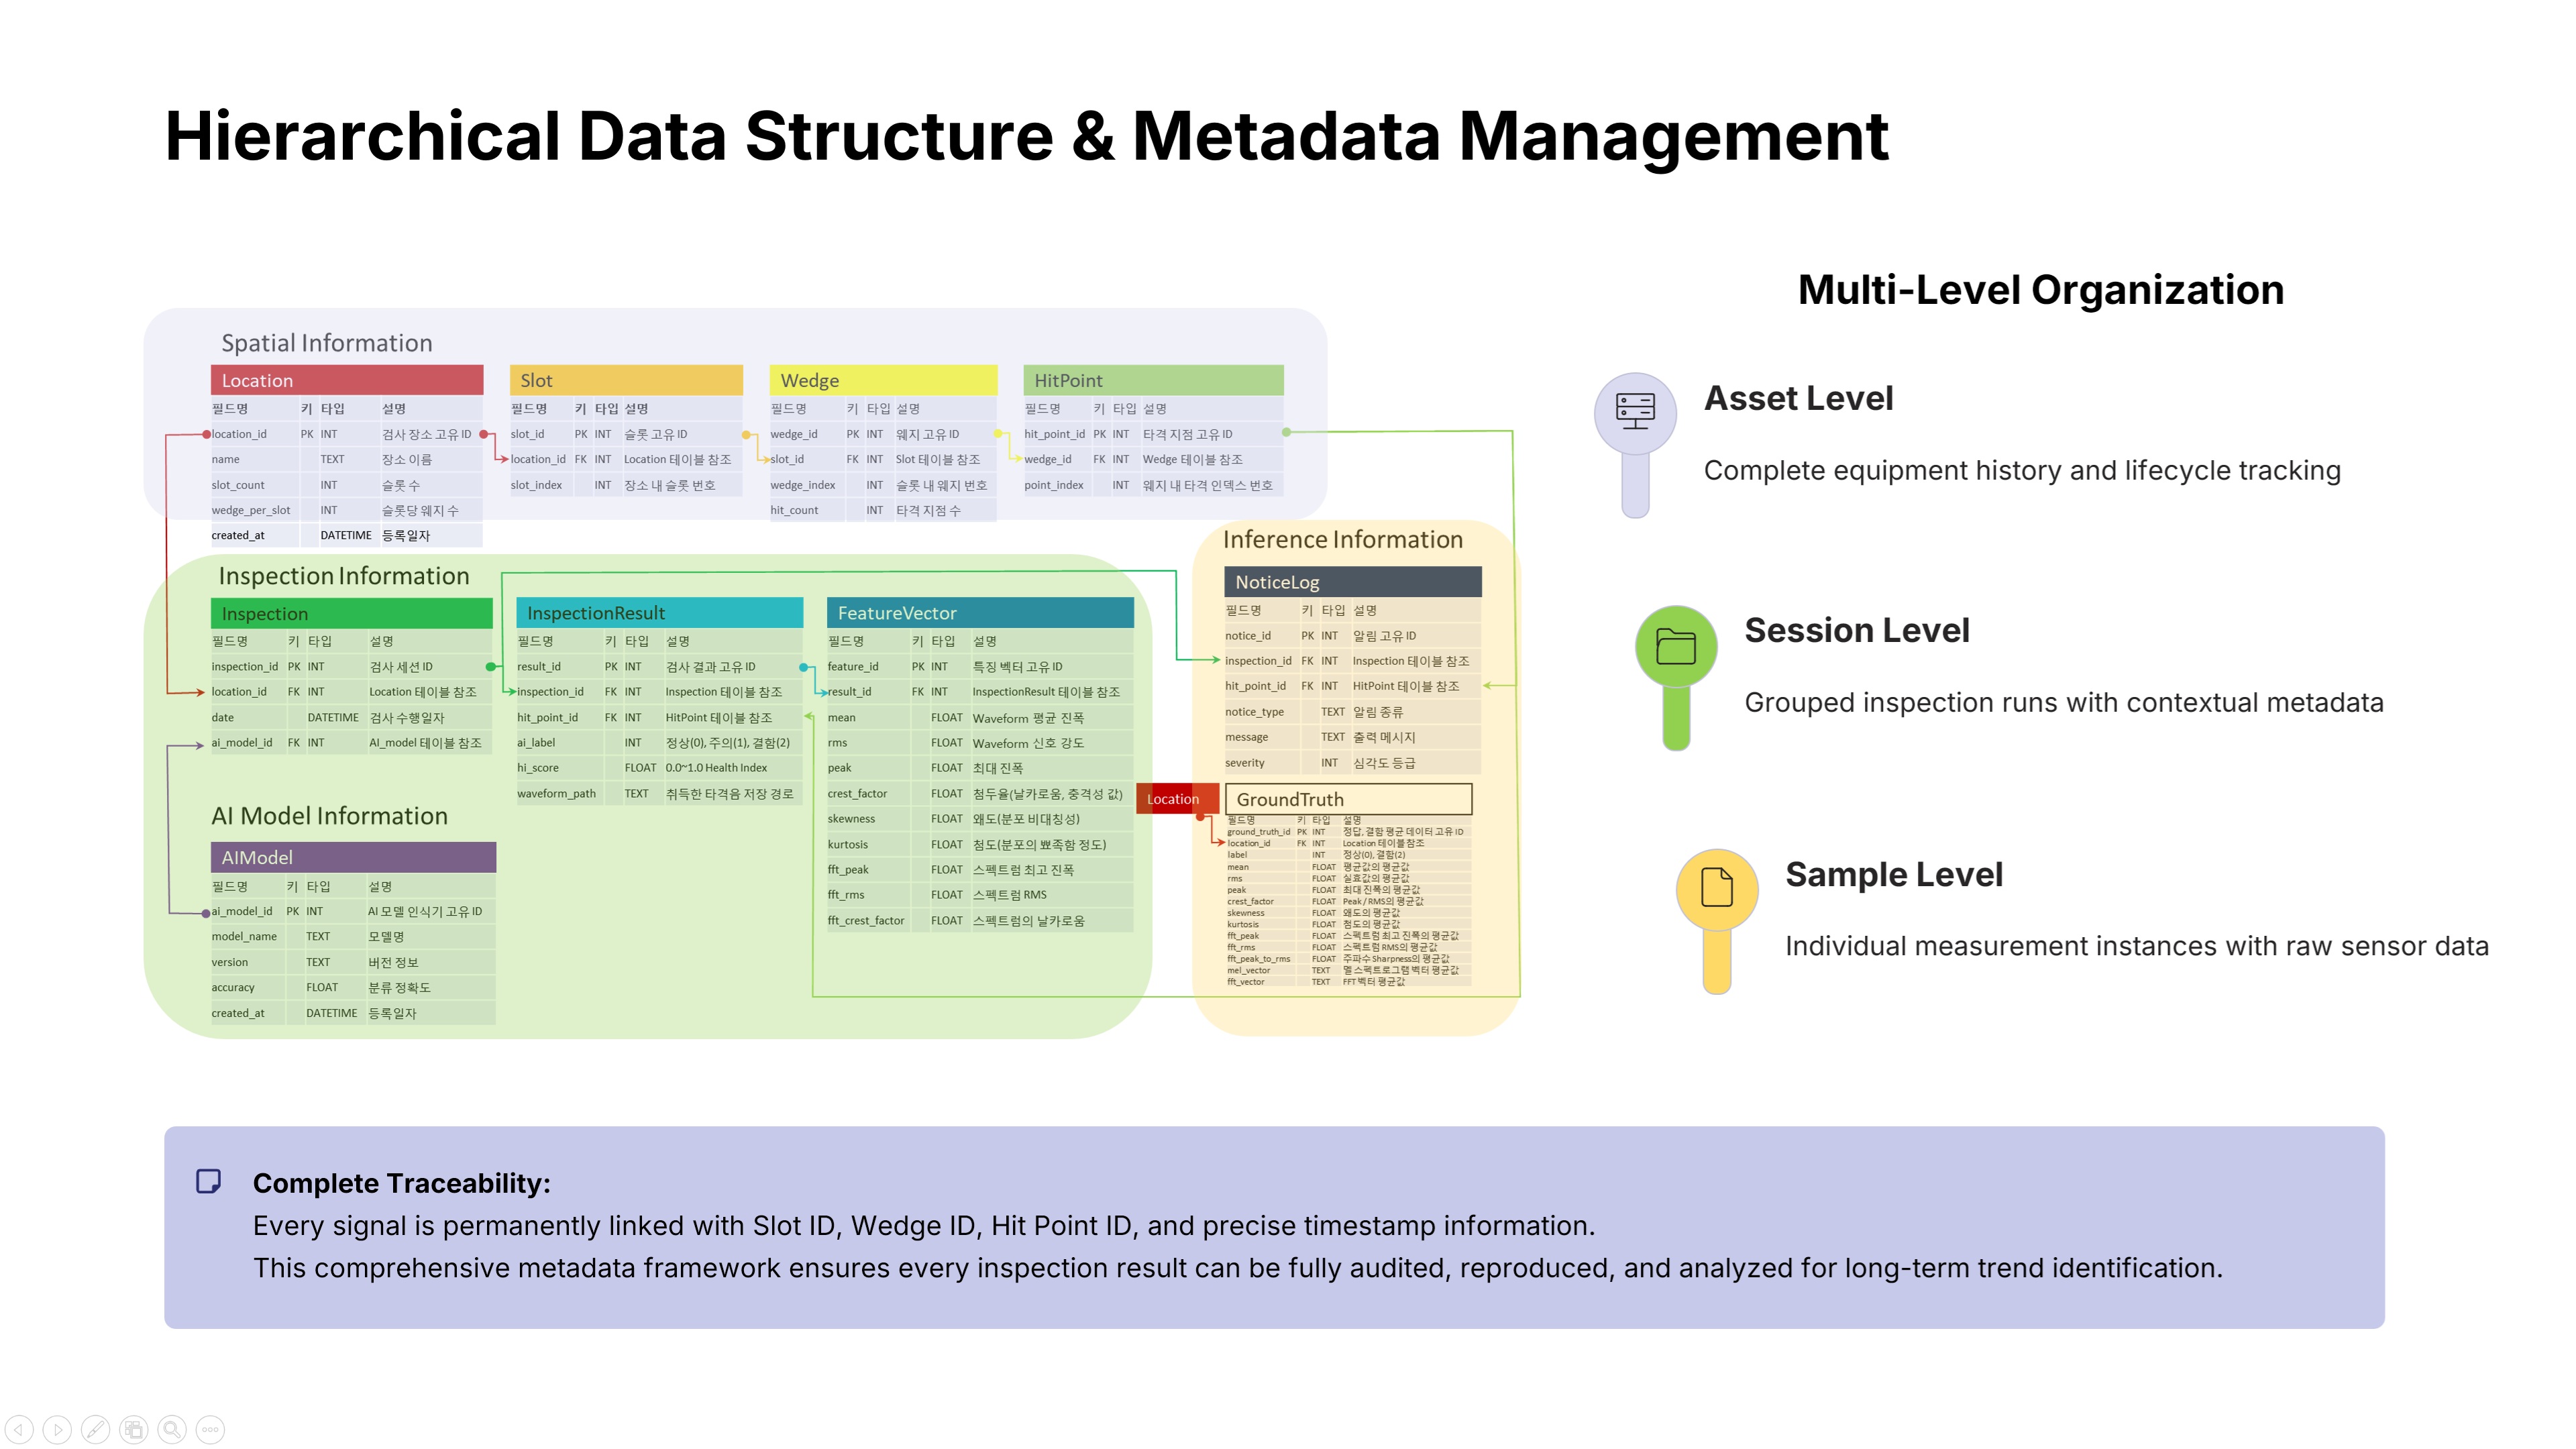 |
For effective predictive maintenance, data traceability is everything. We organized our data into a structured, multi-level hierarchy: comprising Asset, Session, and Sample levels. Crucially, every single signal captured is permanently linked with its specific metadata, such as Slot ID, Wedge ID, and the exact Timestamp. This means we can trace the complete history of every specific wedge over years of operation, allowing for deep, longitudinal analysis of degradation trends. |
| ICACT20260214 Slide.10
[Big Slide]
[YouTube] |
Chrome Click!! |
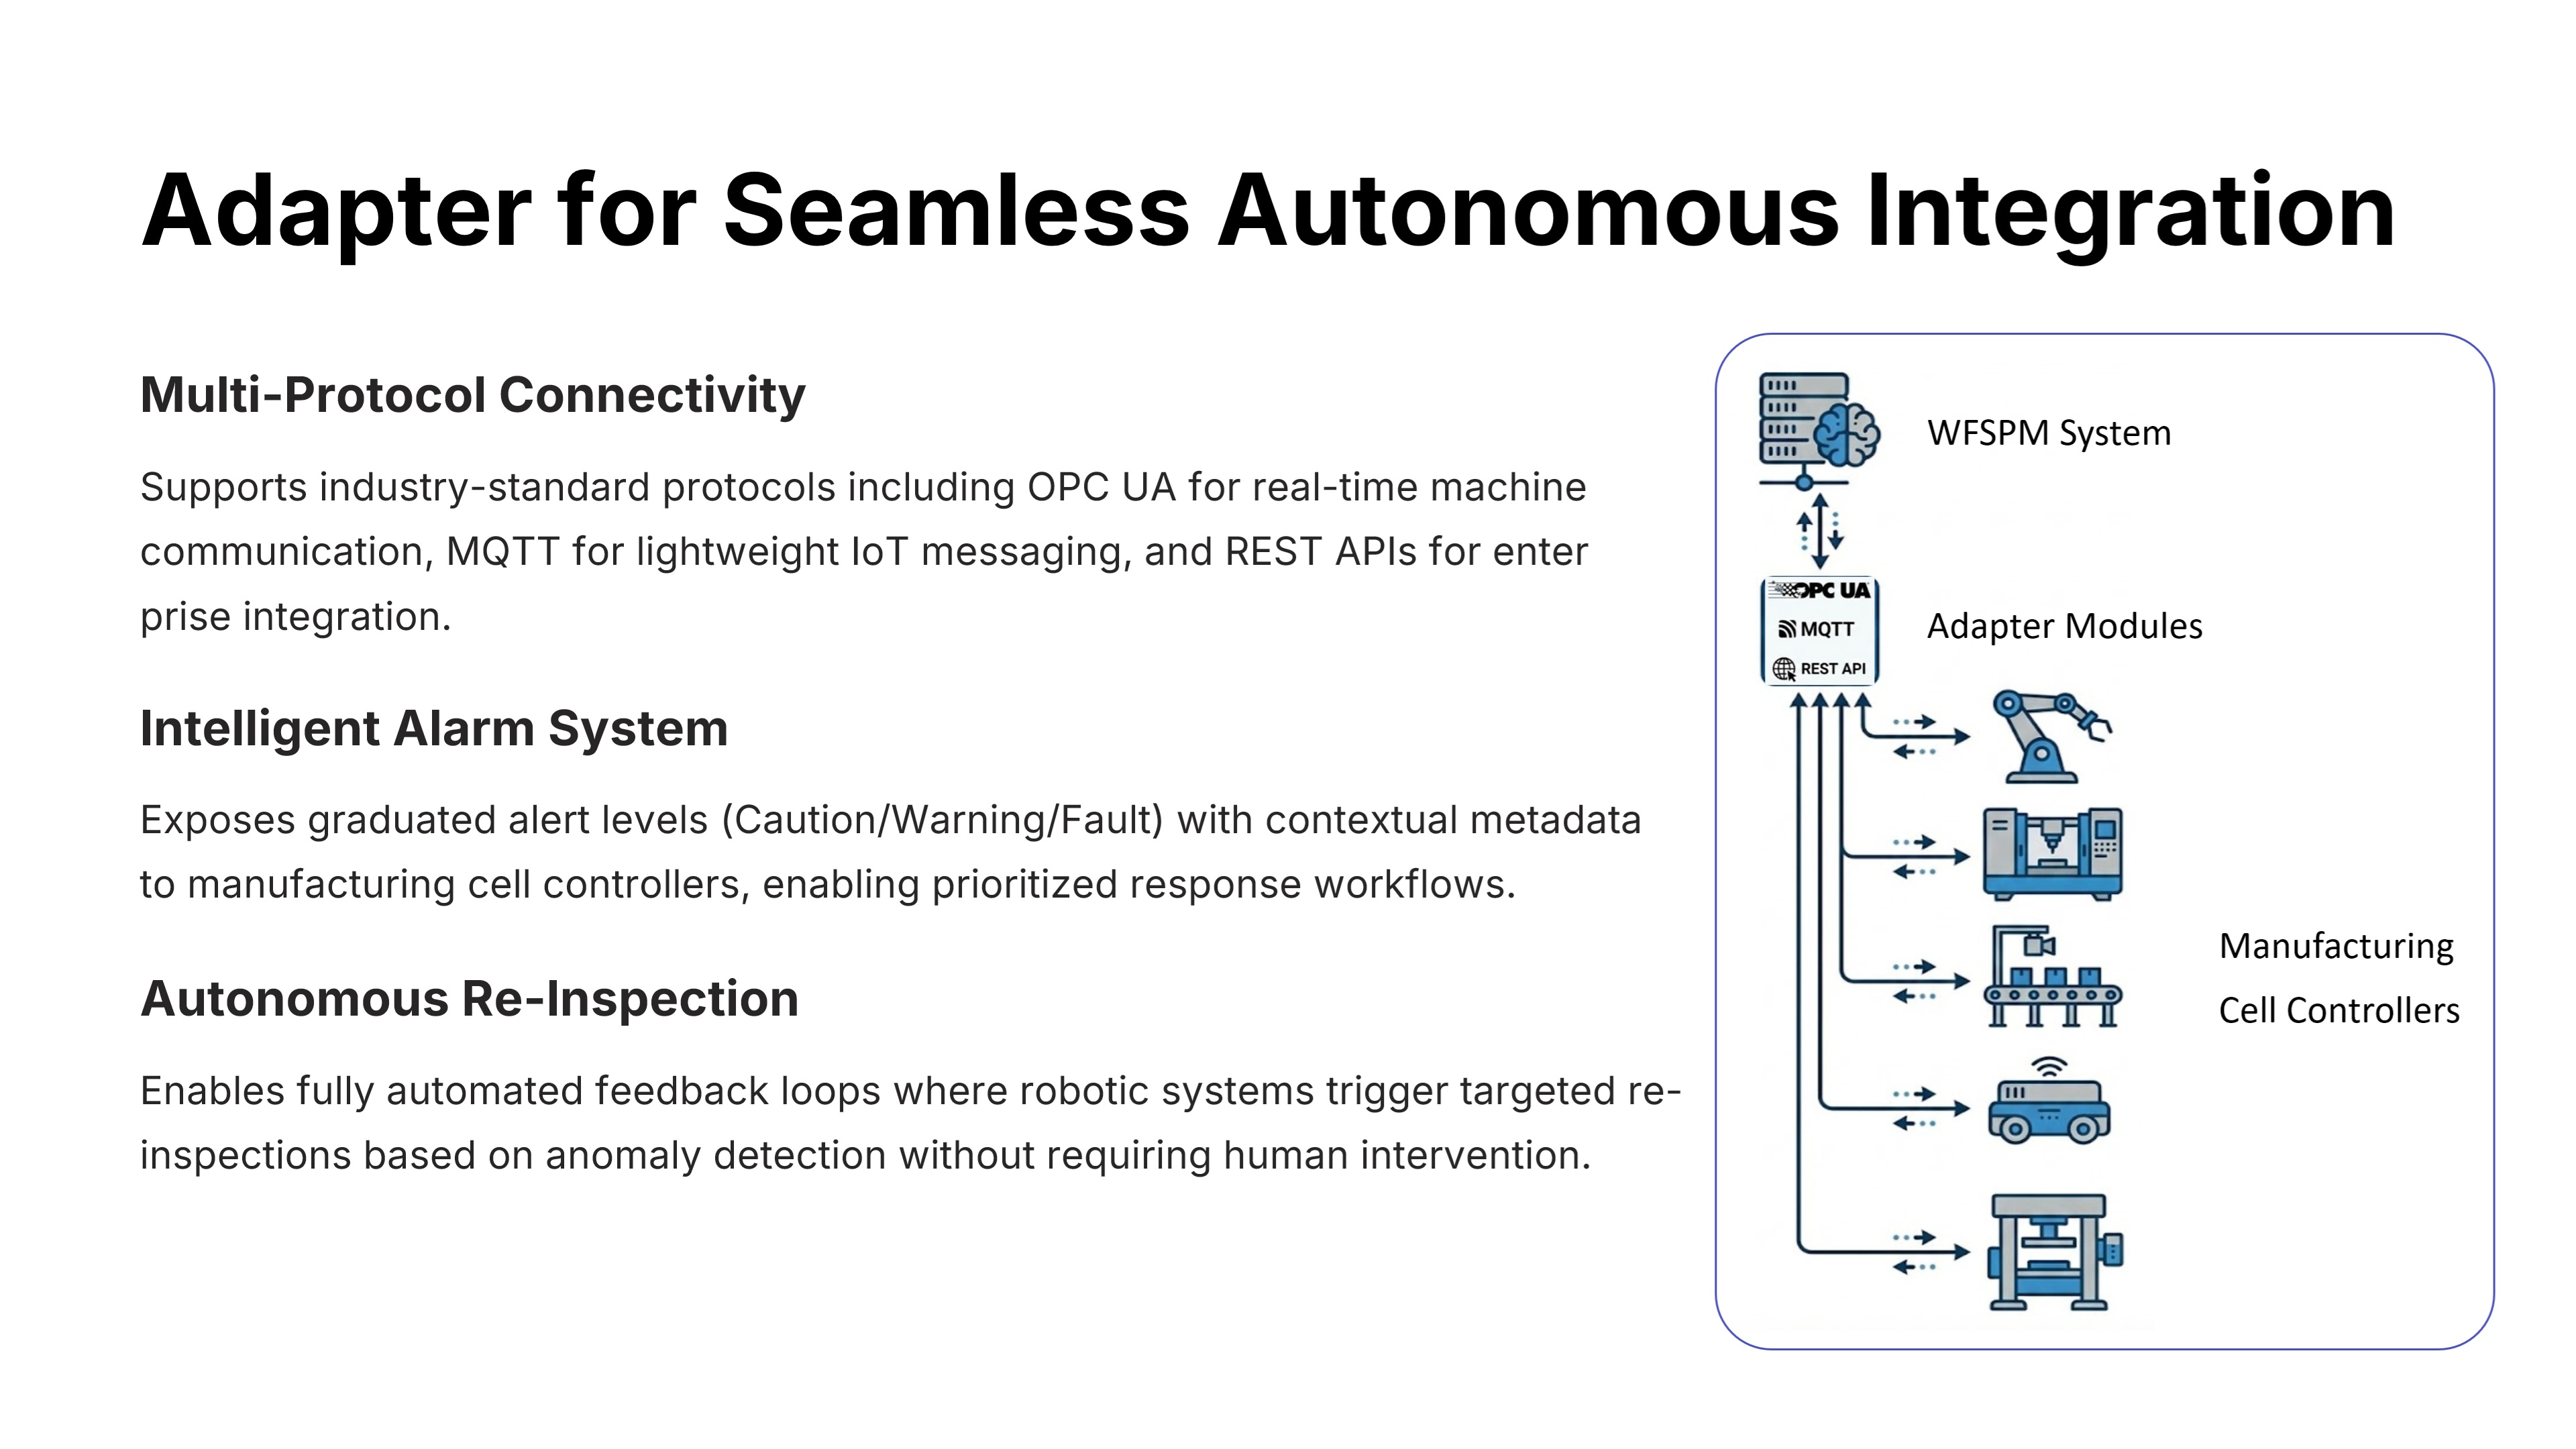 |
To support the integration with autonomous robots, we built a flexible Adapter Module. It supports standard industrial protocols like OPC UA, MQTT, and REST APIs. This allows our system to talk directly to manufacturing cell controllers and robot PLCs. For instance, if a defect is found during a scan, the system can automatically trigger a robotic re-inspection command to verify the result, all without any human intervention. |
| ICACT20260214 Slide.11
[Big Slide]
[YouTube] |
Chrome Click!! |
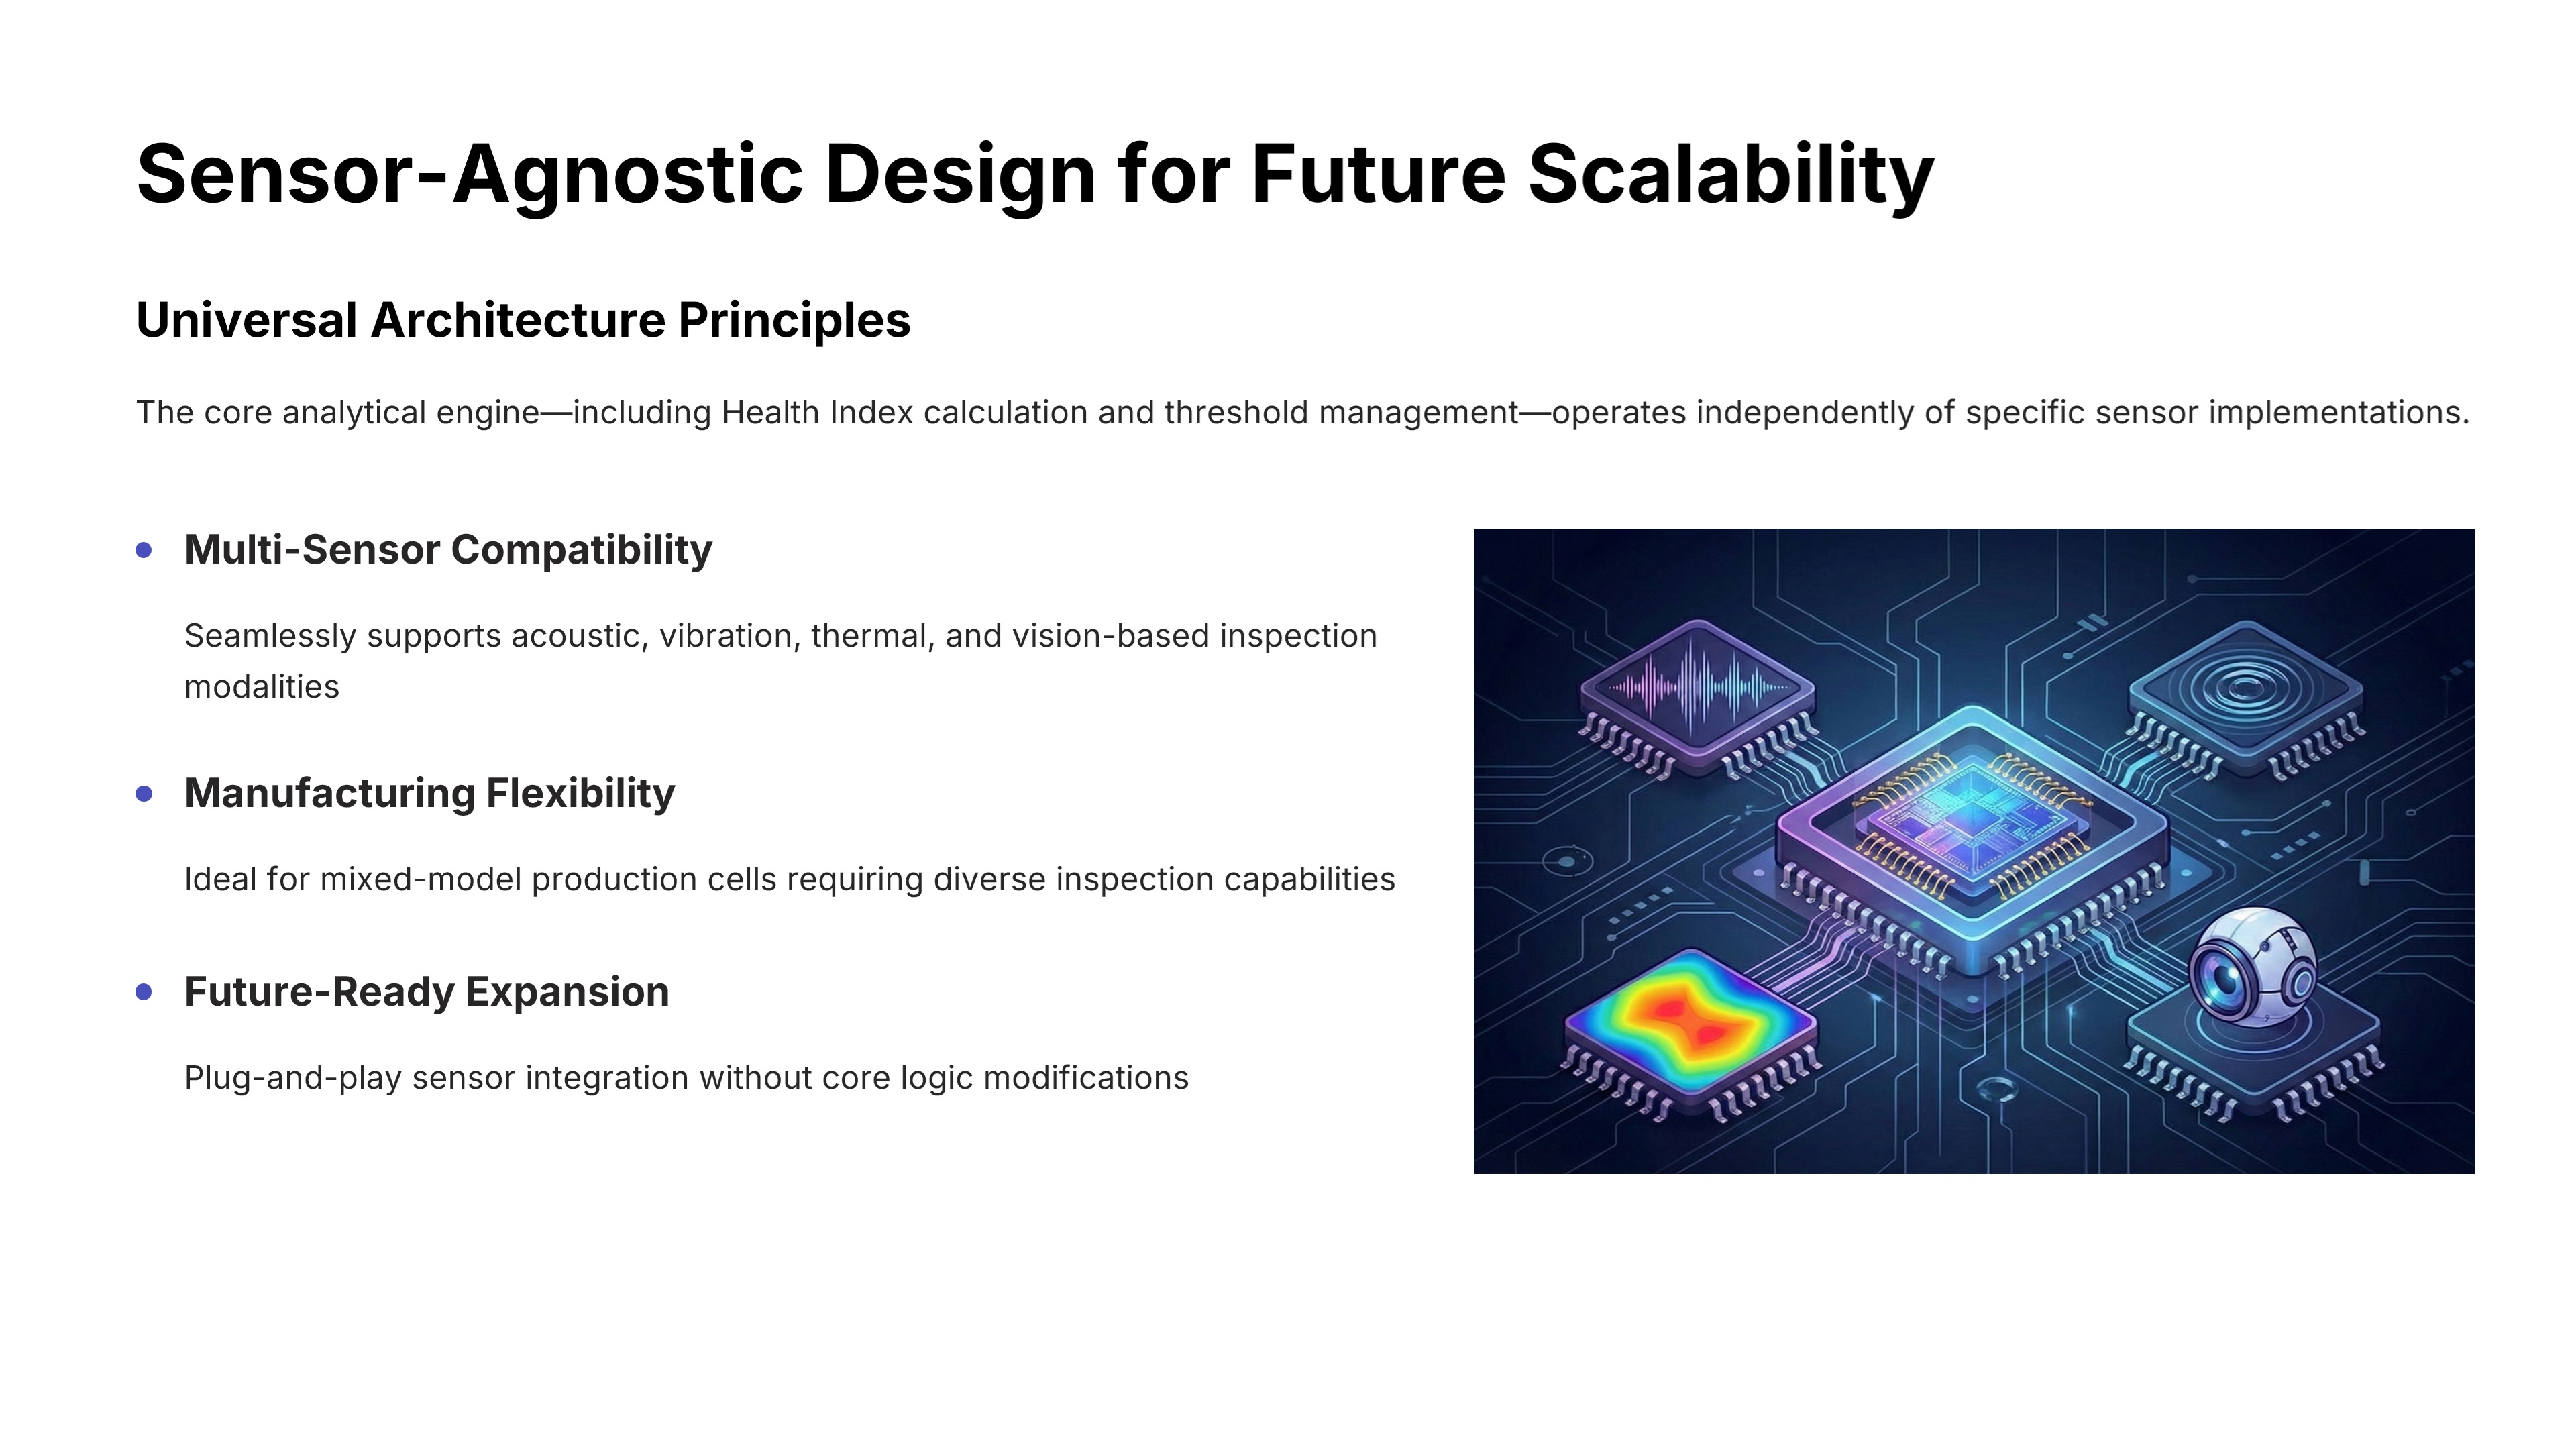 |
While we focus on acoustic signals in this presentation, our architecture is fundamentally Sensor-Agnostic. The core analytical logic, specifically the Health Index calculation and Threshold management, is completely independent of the sensor type being used. Whether you decide to use vibration, thermal, or computer vision sensors in the future, the backend logic remains exactly the same, ensuring maximum scalability and flexibility for the system. |
| ICACT20260214 Slide.12
[Big Slide]
[YouTube] |
Chrome Click!! |
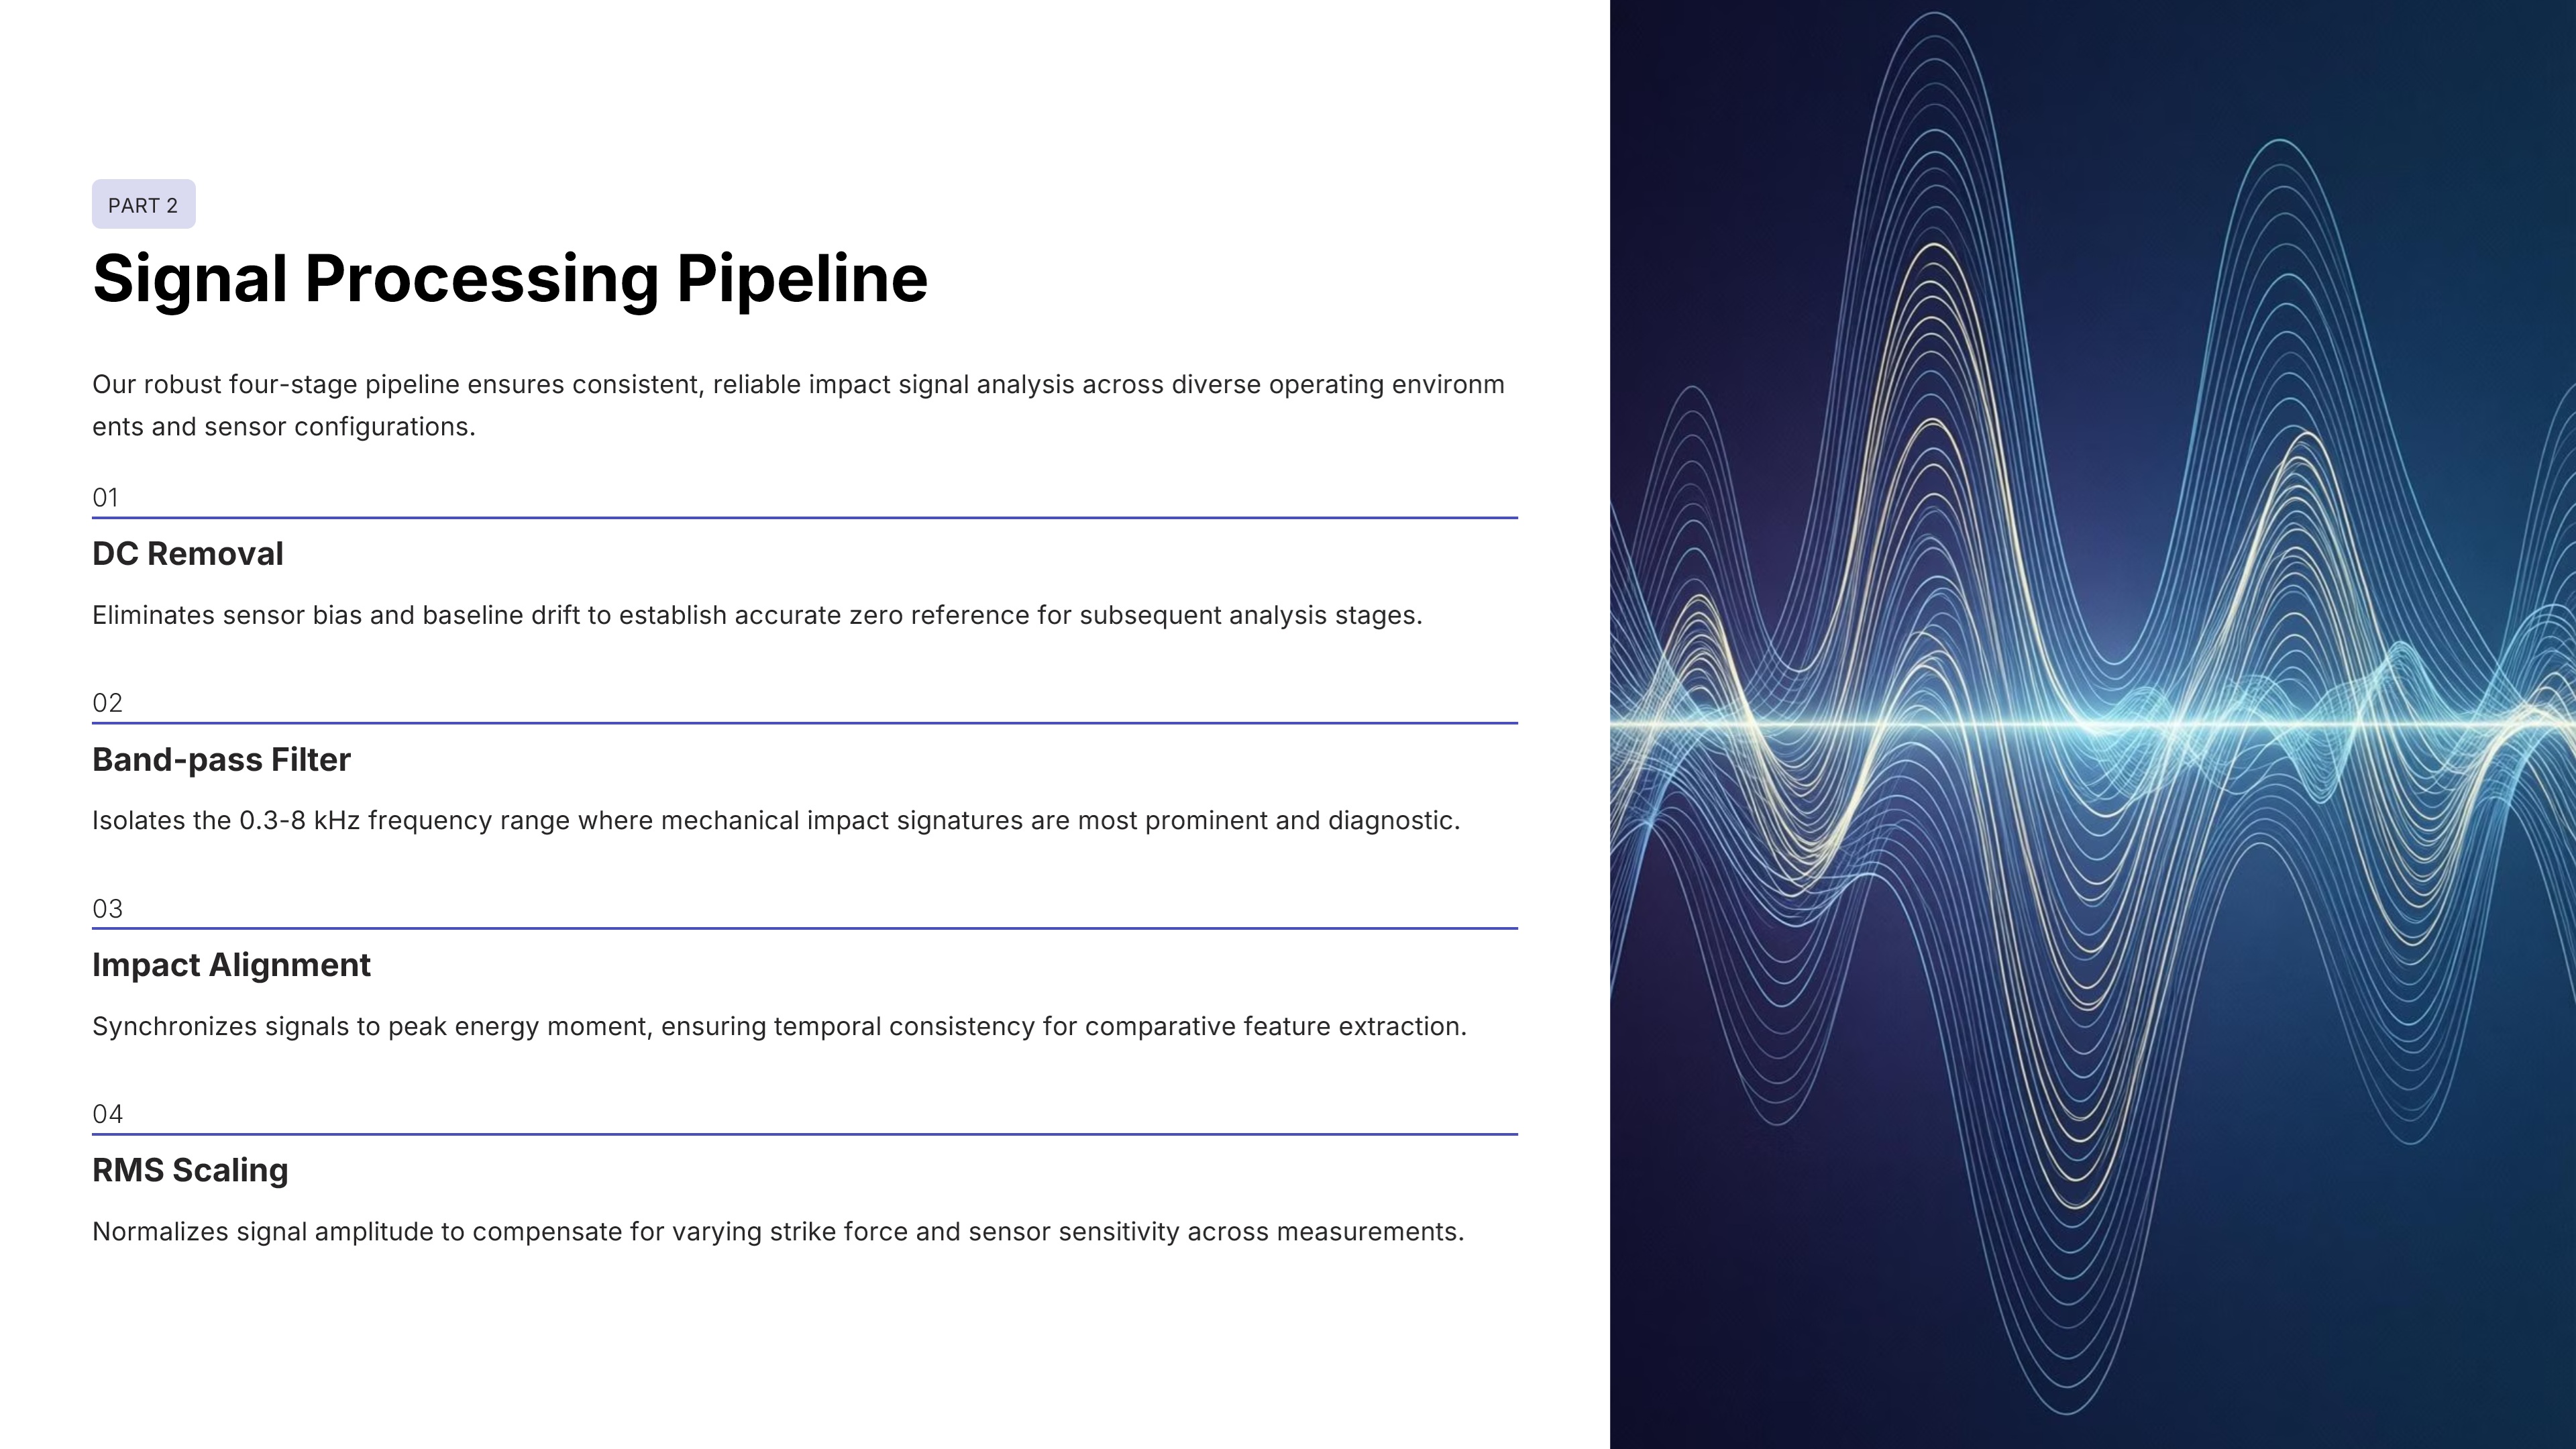 |
Now, lets look at Part 2, the Signal Processing Pipeline. We use a robust four-stage process to ensure data quality. First, DC Removal to fix any baseline drift from the sensors. Second, Band-pass Filtering, specifically from 0.3 to 8 kHz, to isolate the relevant impact sound. Third, Impact Alignment to synchronize the peak energy of every hit. And finally, RMS Scaling to normalize strike force variations. This standardization is vital, as it ensures that every signal is comparable for consistent feature extraction. |
| ICACT20260214 Slide.13
[Big Slide]
[YouTube] |
Chrome Click!! |
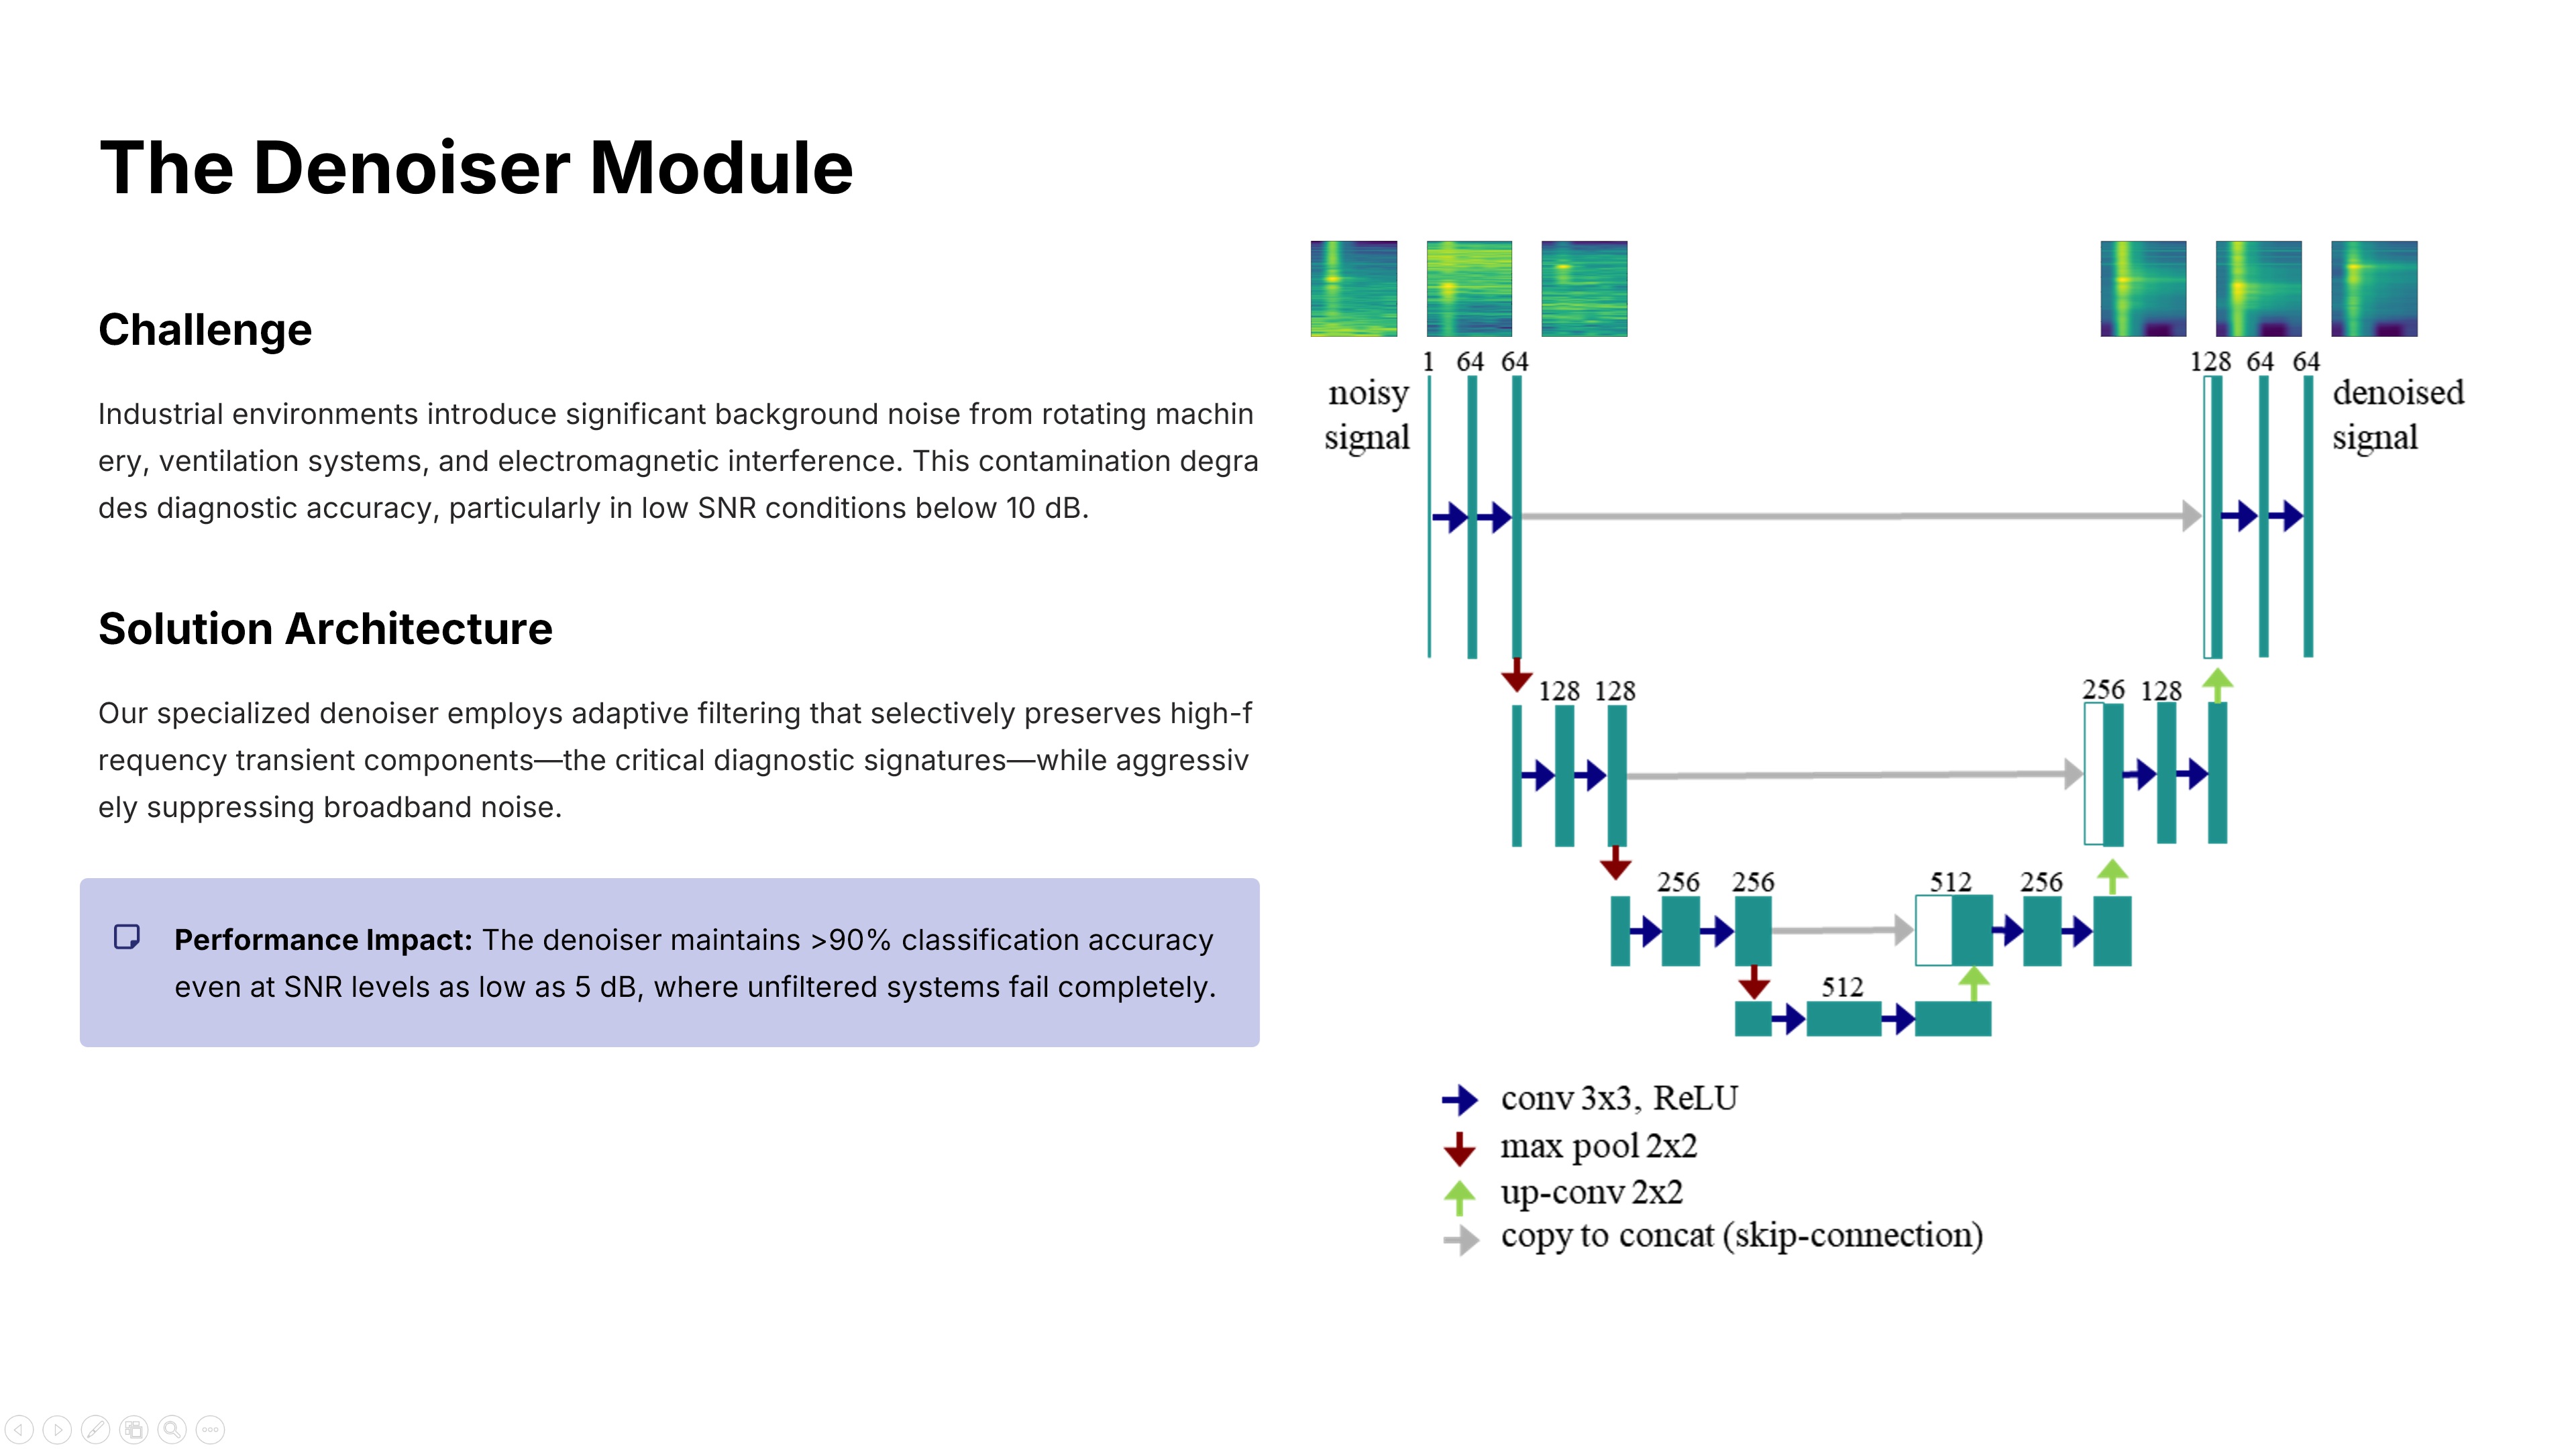 |
The biggest challenge in the field is undoubtedly noise. To combat this, we developed a specialized Denoiser using a U-Net style architecture. As you can see in the diagram, this deep learning model preserves the sharp transient impact of the strike, which contains the defect information, while aggressively suppressing broadband background noise. The result is remarkable. We maintain over 90% accuracy even at a critically low SNR of 5dB, a condition where traditional methods would fail completely. |
| ICACT20260214 Slide.14
[Big Slide]
[YouTube] |
Chrome Click!! |
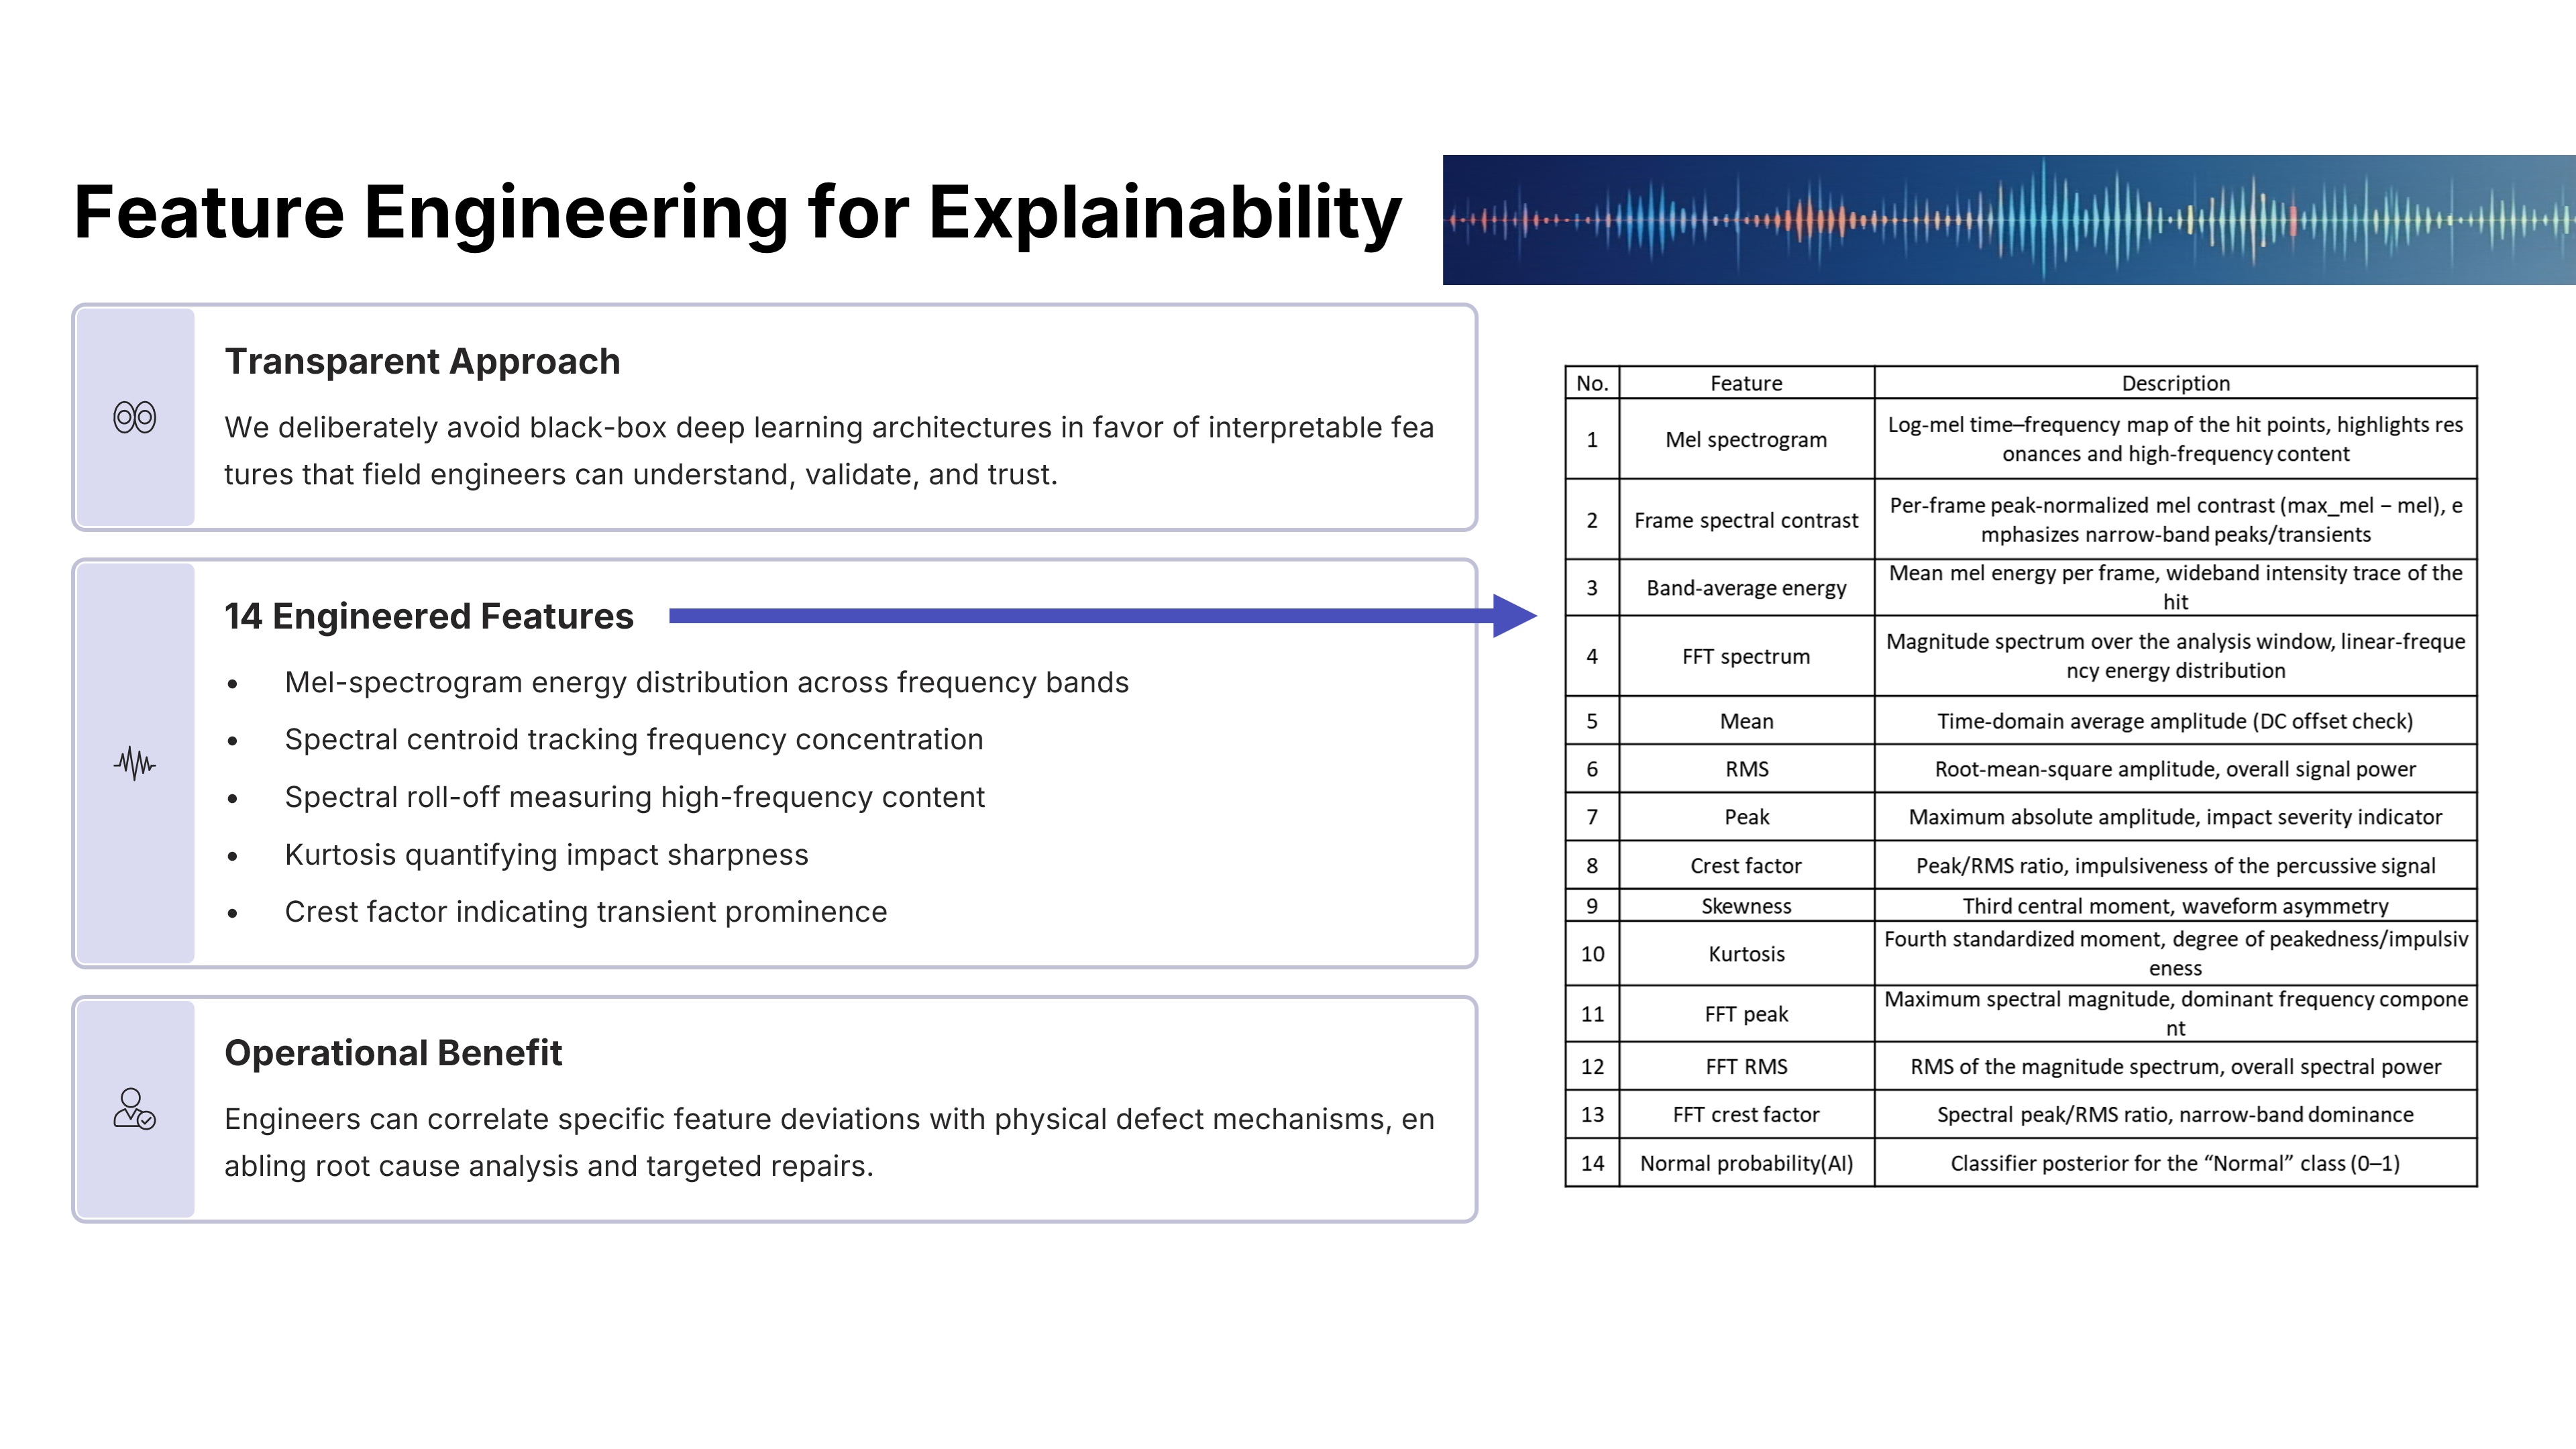 |
For the AI model, we deliberately chose Explainability over complexity. Instead of using a black-box deep learning classifier, we use 14 Engineered Features, such as Mel-spectrograms, Spectral Centroid, and Kurtosis. This allows field engineers to physically understand why an alarm was triggered. For example, a shift in the Centroid feature might directly indicate a change in the material stiffness of the wedge, providing actionable physical insight. |
| ICACT20260214 Slide.15
[Big Slide]
[YouTube] |
Chrome Click!! |
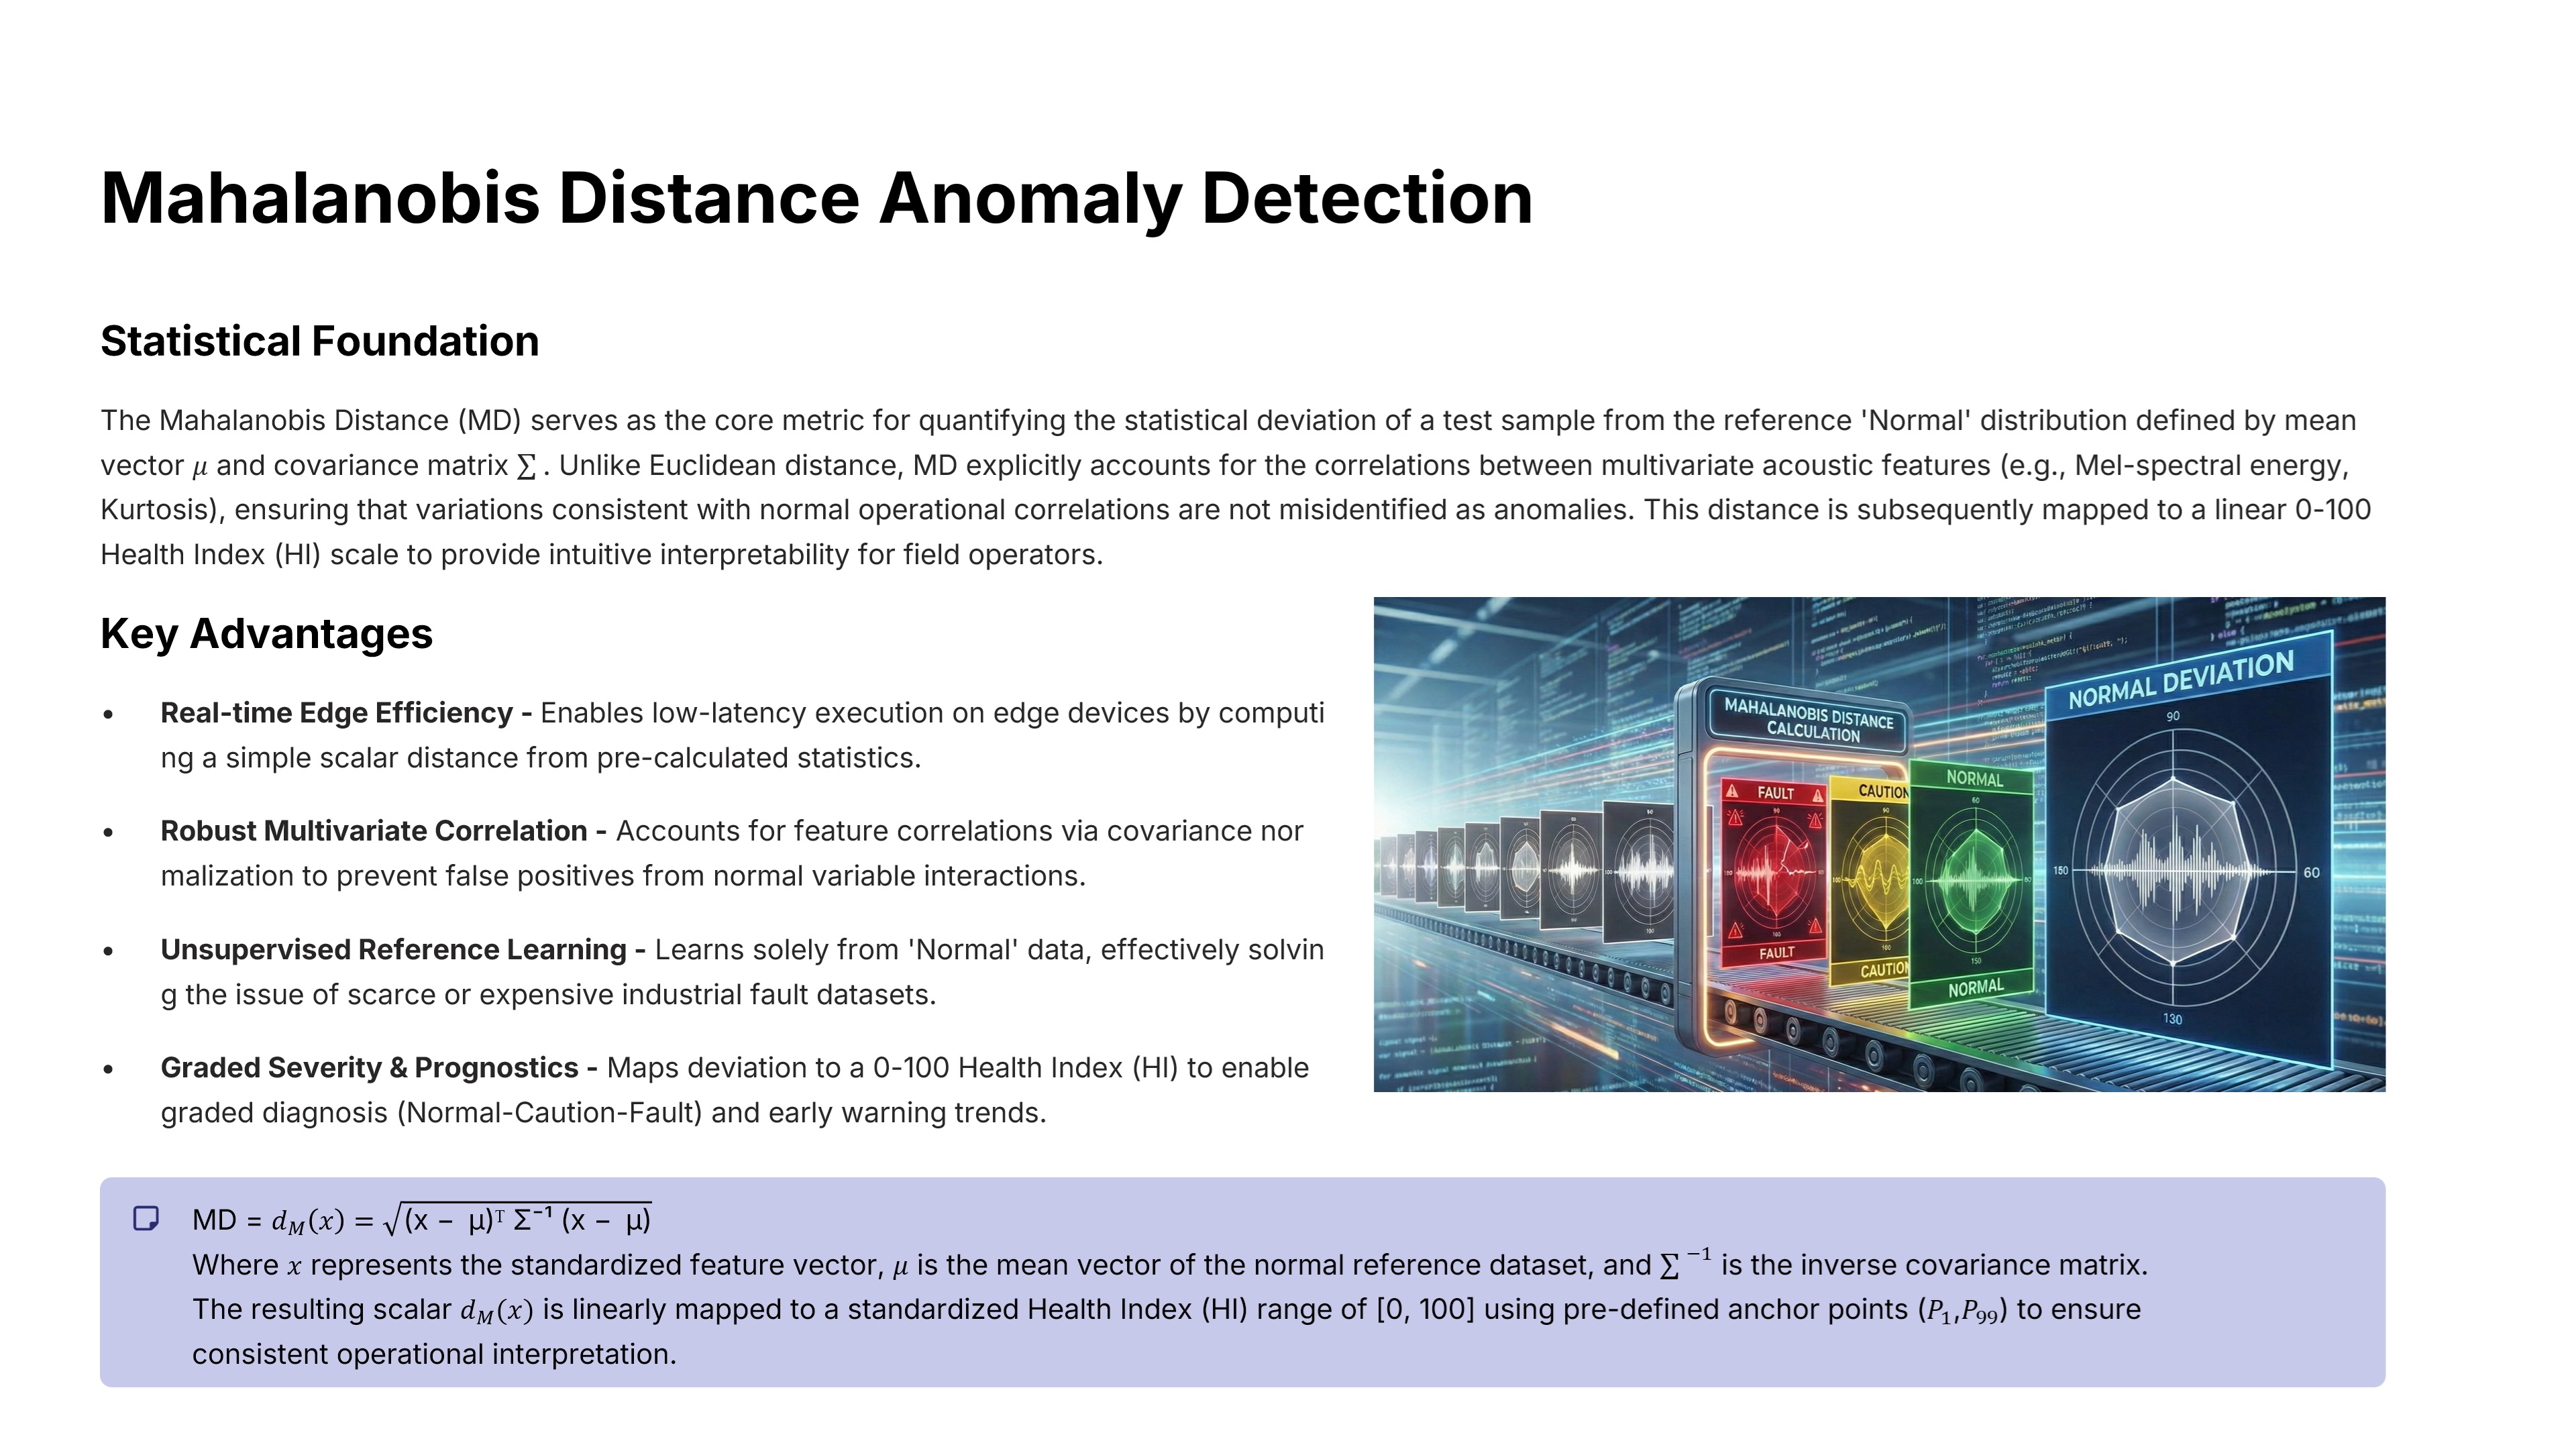 |
For anomaly detection, we employ the Mahalanobis Distance. Unlike simple Euclidean distance, MD explicitly accounts for the correlations between different features. If two features usually change together, MD recognizes that behavior as normal. We calculate this statistical distance from the normal distribution, and linearly map it to a 0-100 Health Index. This gives operators a simple, intuitive score to work with. 100 is perfect health, and 0 indicates a complete failure. |
| ICACT20260214 Slide.16
[Big Slide]
[YouTube] |
Chrome Click!! |
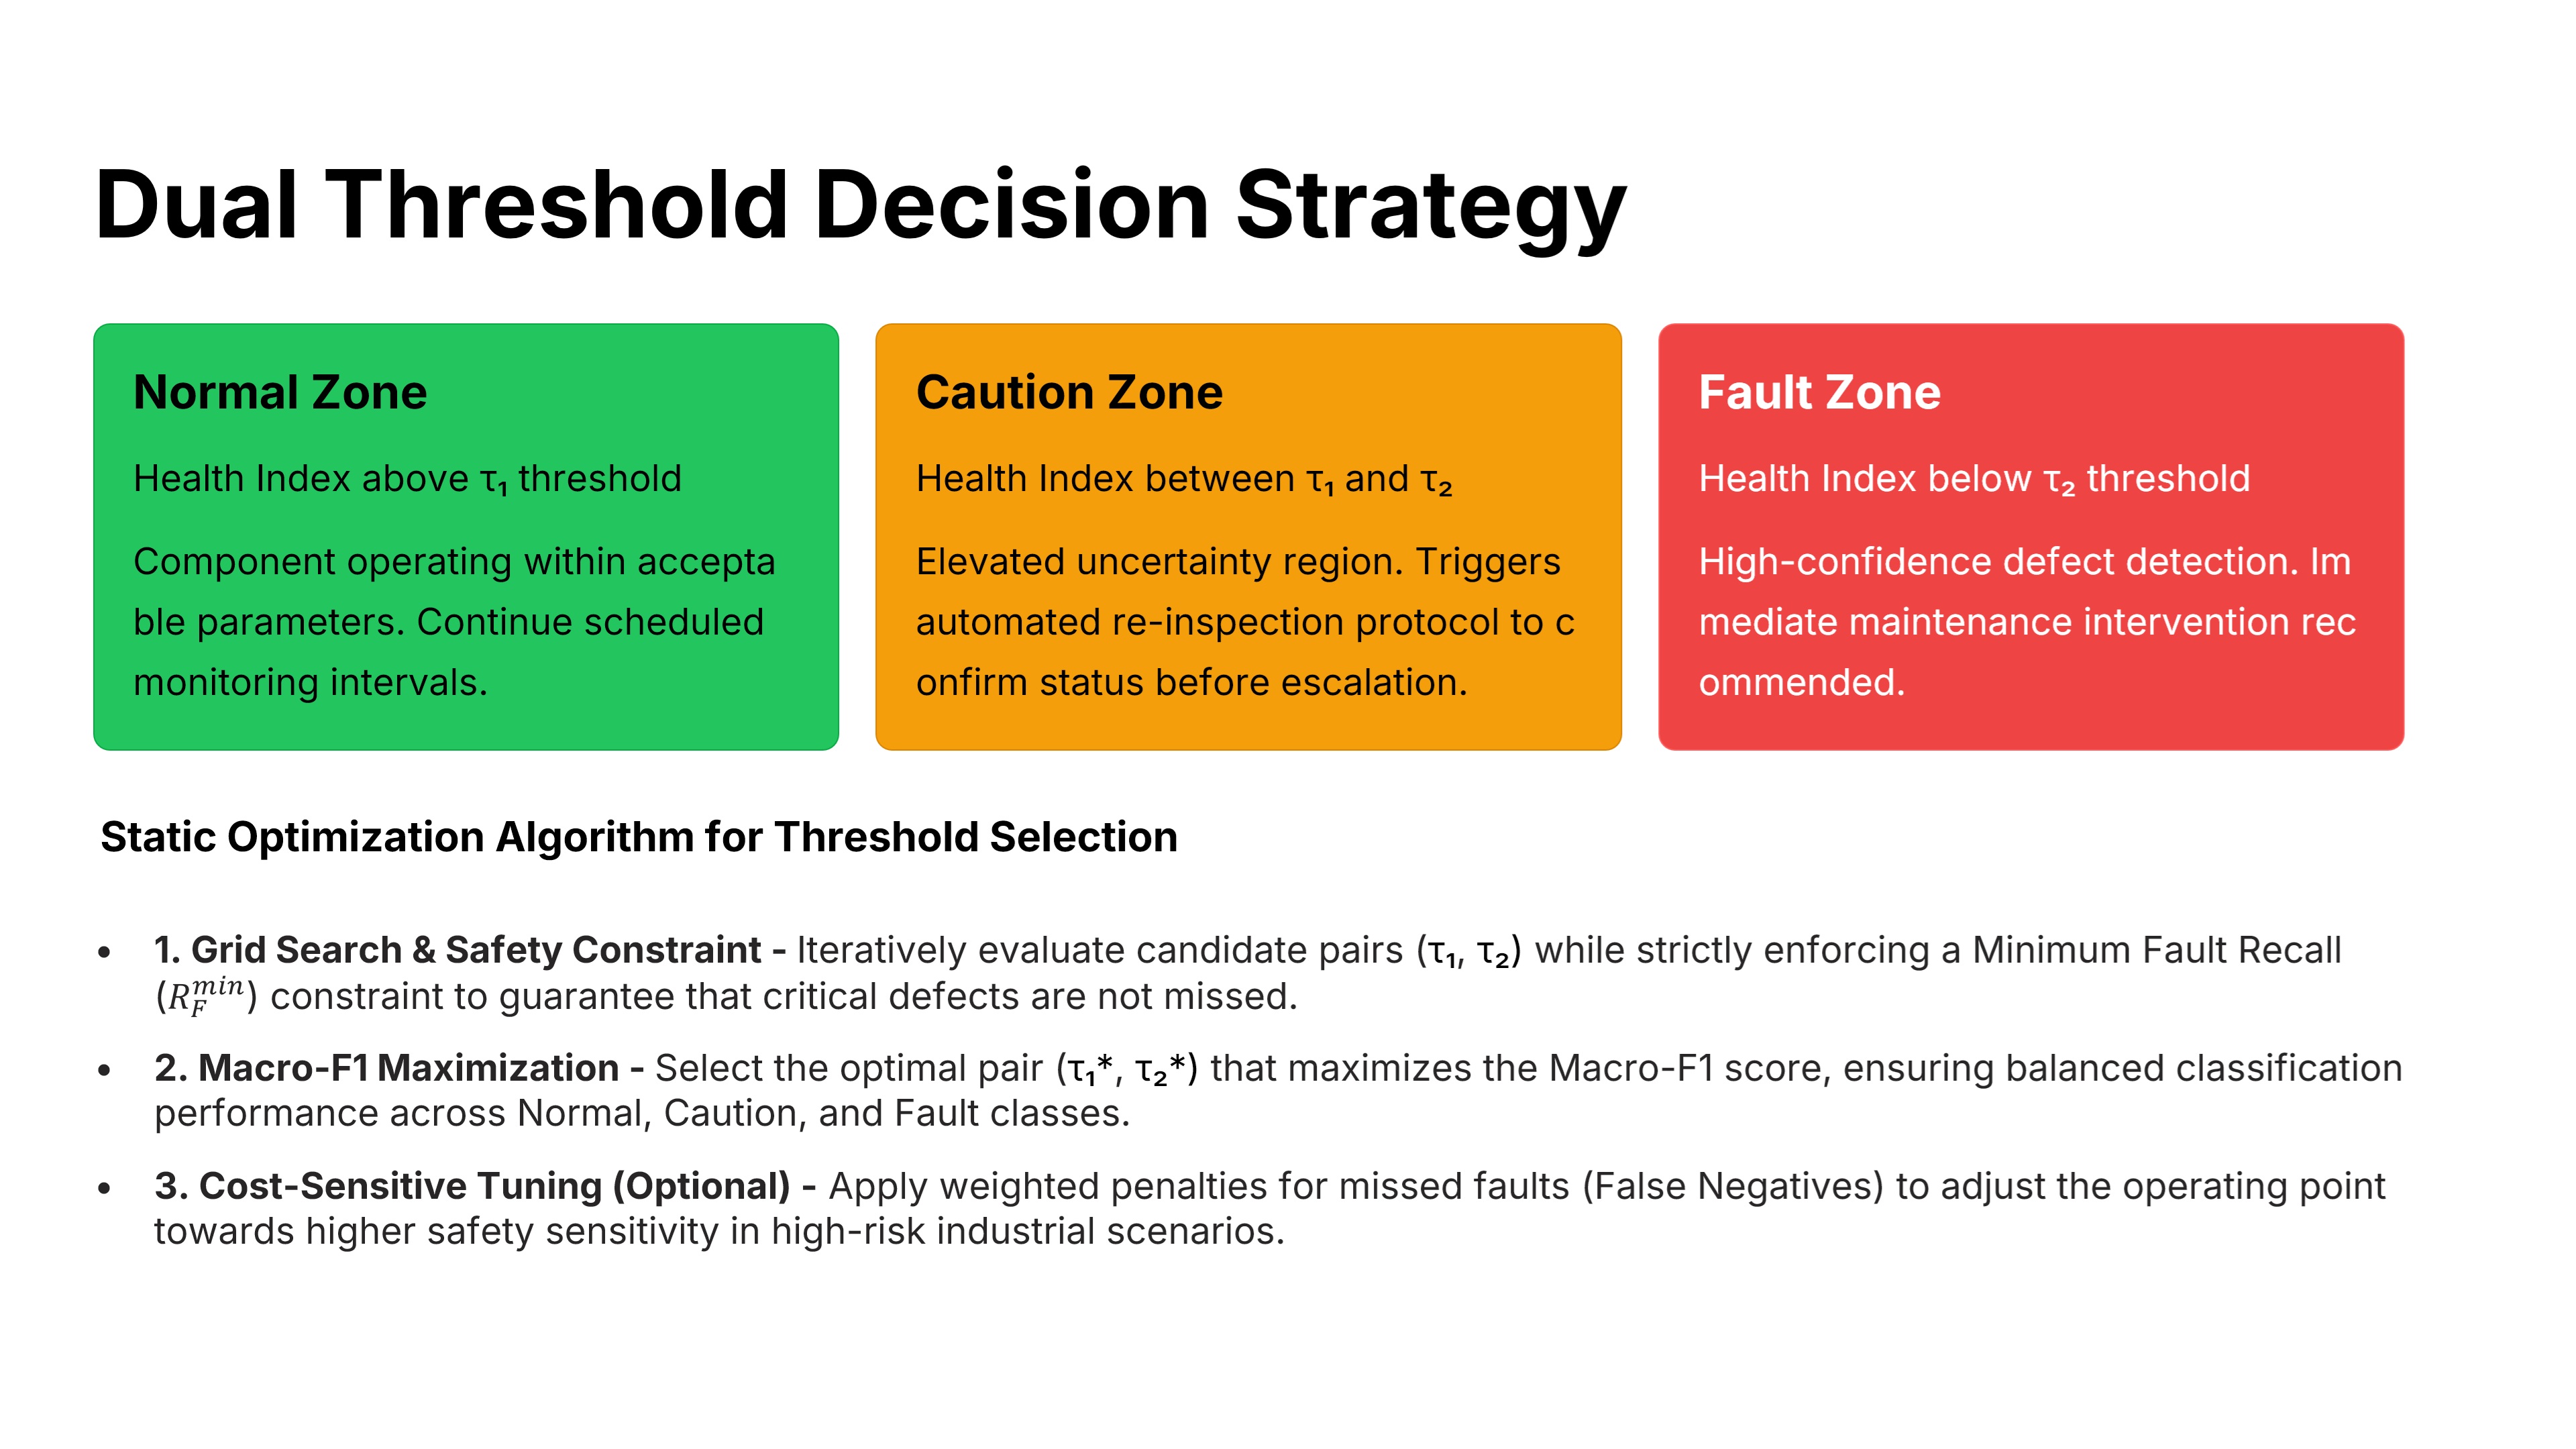 |
We dont just use a simple pass/fail binary. We implemented a sophisticated Dual Threshold Strategy, using tau 1 and tau 2. Anything below tau 2 is a clear Fault. But the region between tau 1 and tau 2, is what we call the Caution Zone. We optimize these thresholds mathematically to maximize the F1-score, while strictly enforcing a Minimum Fault Recall constraint to ensure absolute safety. |
| ICACT20260214 Slide.17
[Big Slide]
[YouTube] |
Chrome Click!! |
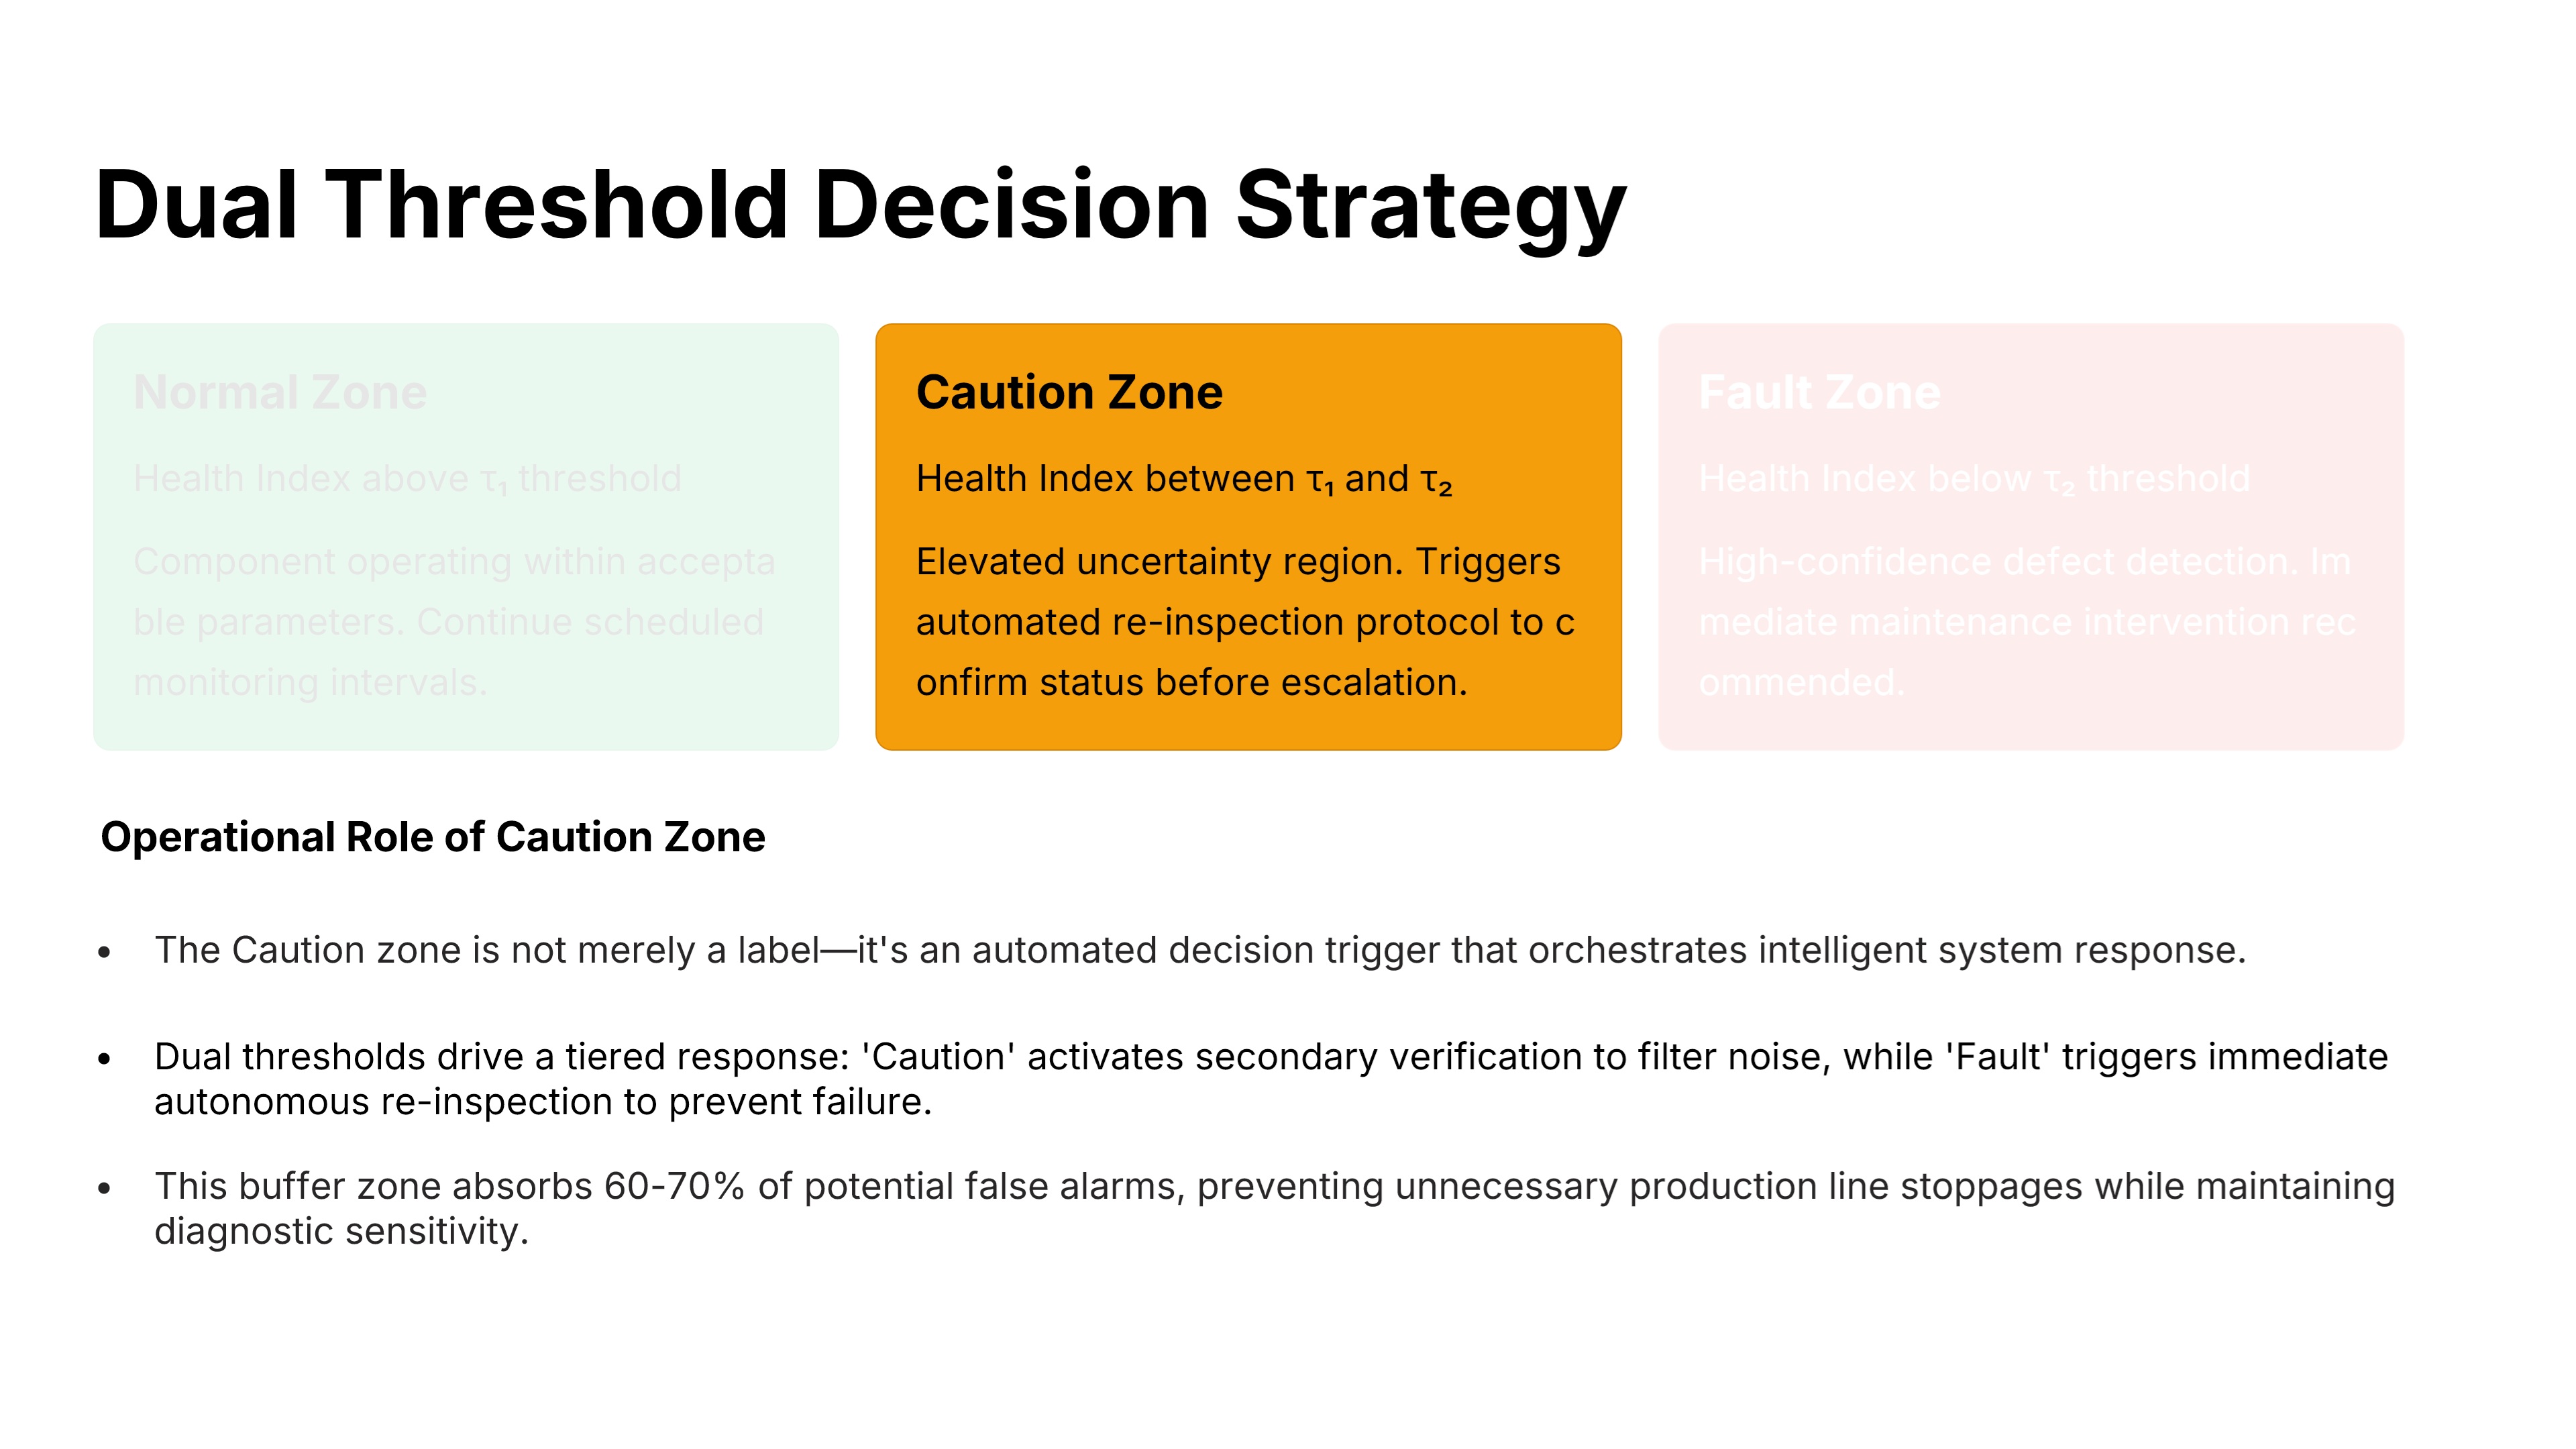 |
Why do we need a Caution Zone? It acts as a necessary operational buffer. In this zone, the uncertainty is naturally higher. Instead of stopping the production line immediately or ignoring the signal, the system triggers an Automated Re-inspection. This intelligent filter screens out false alarms and only escalates true defects, effectively balancing safety requirements with operational efficiency. |
| ICACT20260214 Slide.18
[Big Slide]
[YouTube] |
Chrome Click!! |
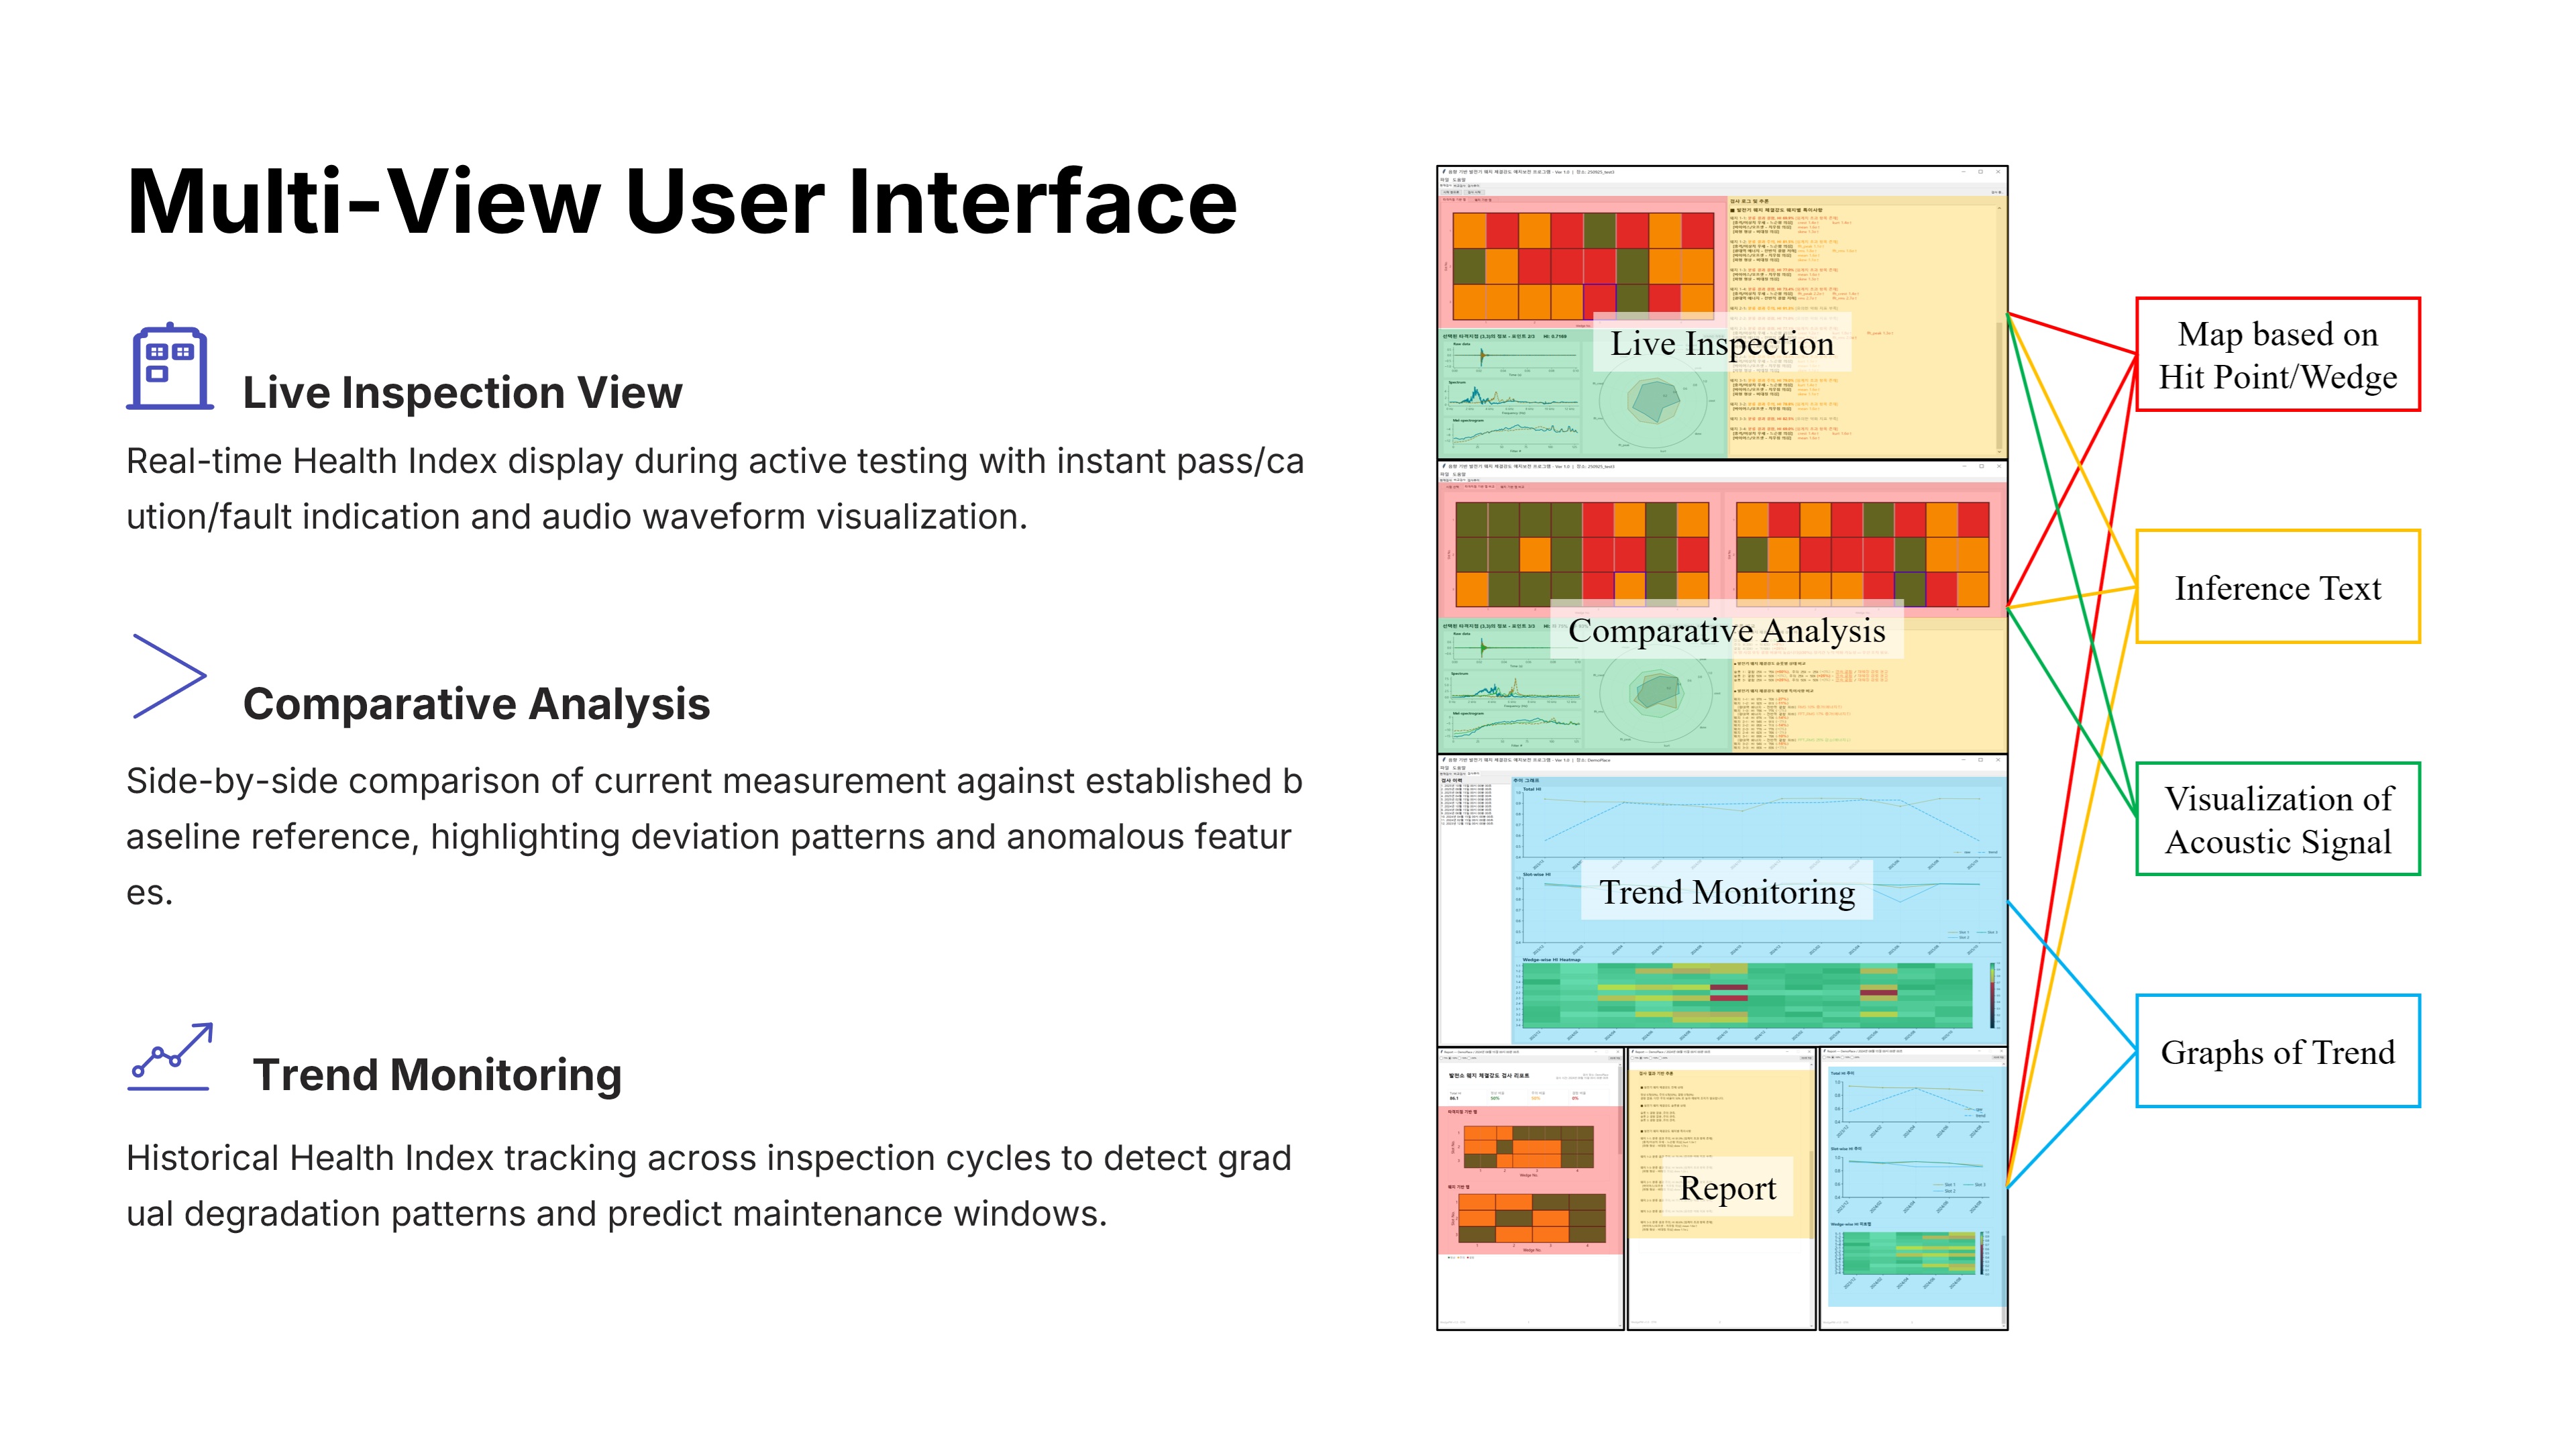 |
All this complex technology is presented through a user-friendly Multi-View UI. Operators have access to a Live View for real-time monitoring checks, a Comparative View to compare current signals against historical baselines, and a Trend View to visualize the degradation history over time. This comprehensive interface supports the operator in making informed, data-driven decisions on the spot. |
| ICACT20260214 Slide.19
[Big Slide]
[YouTube] |
Chrome Click!! |
 |
Moving on to Part 3, Validation. We rigorously tested the systems reliability and robustness to prove its readiness. |
| ICACT20260214 Slide.20
[Big Slide]
[YouTube] |
Chrome Click!! |
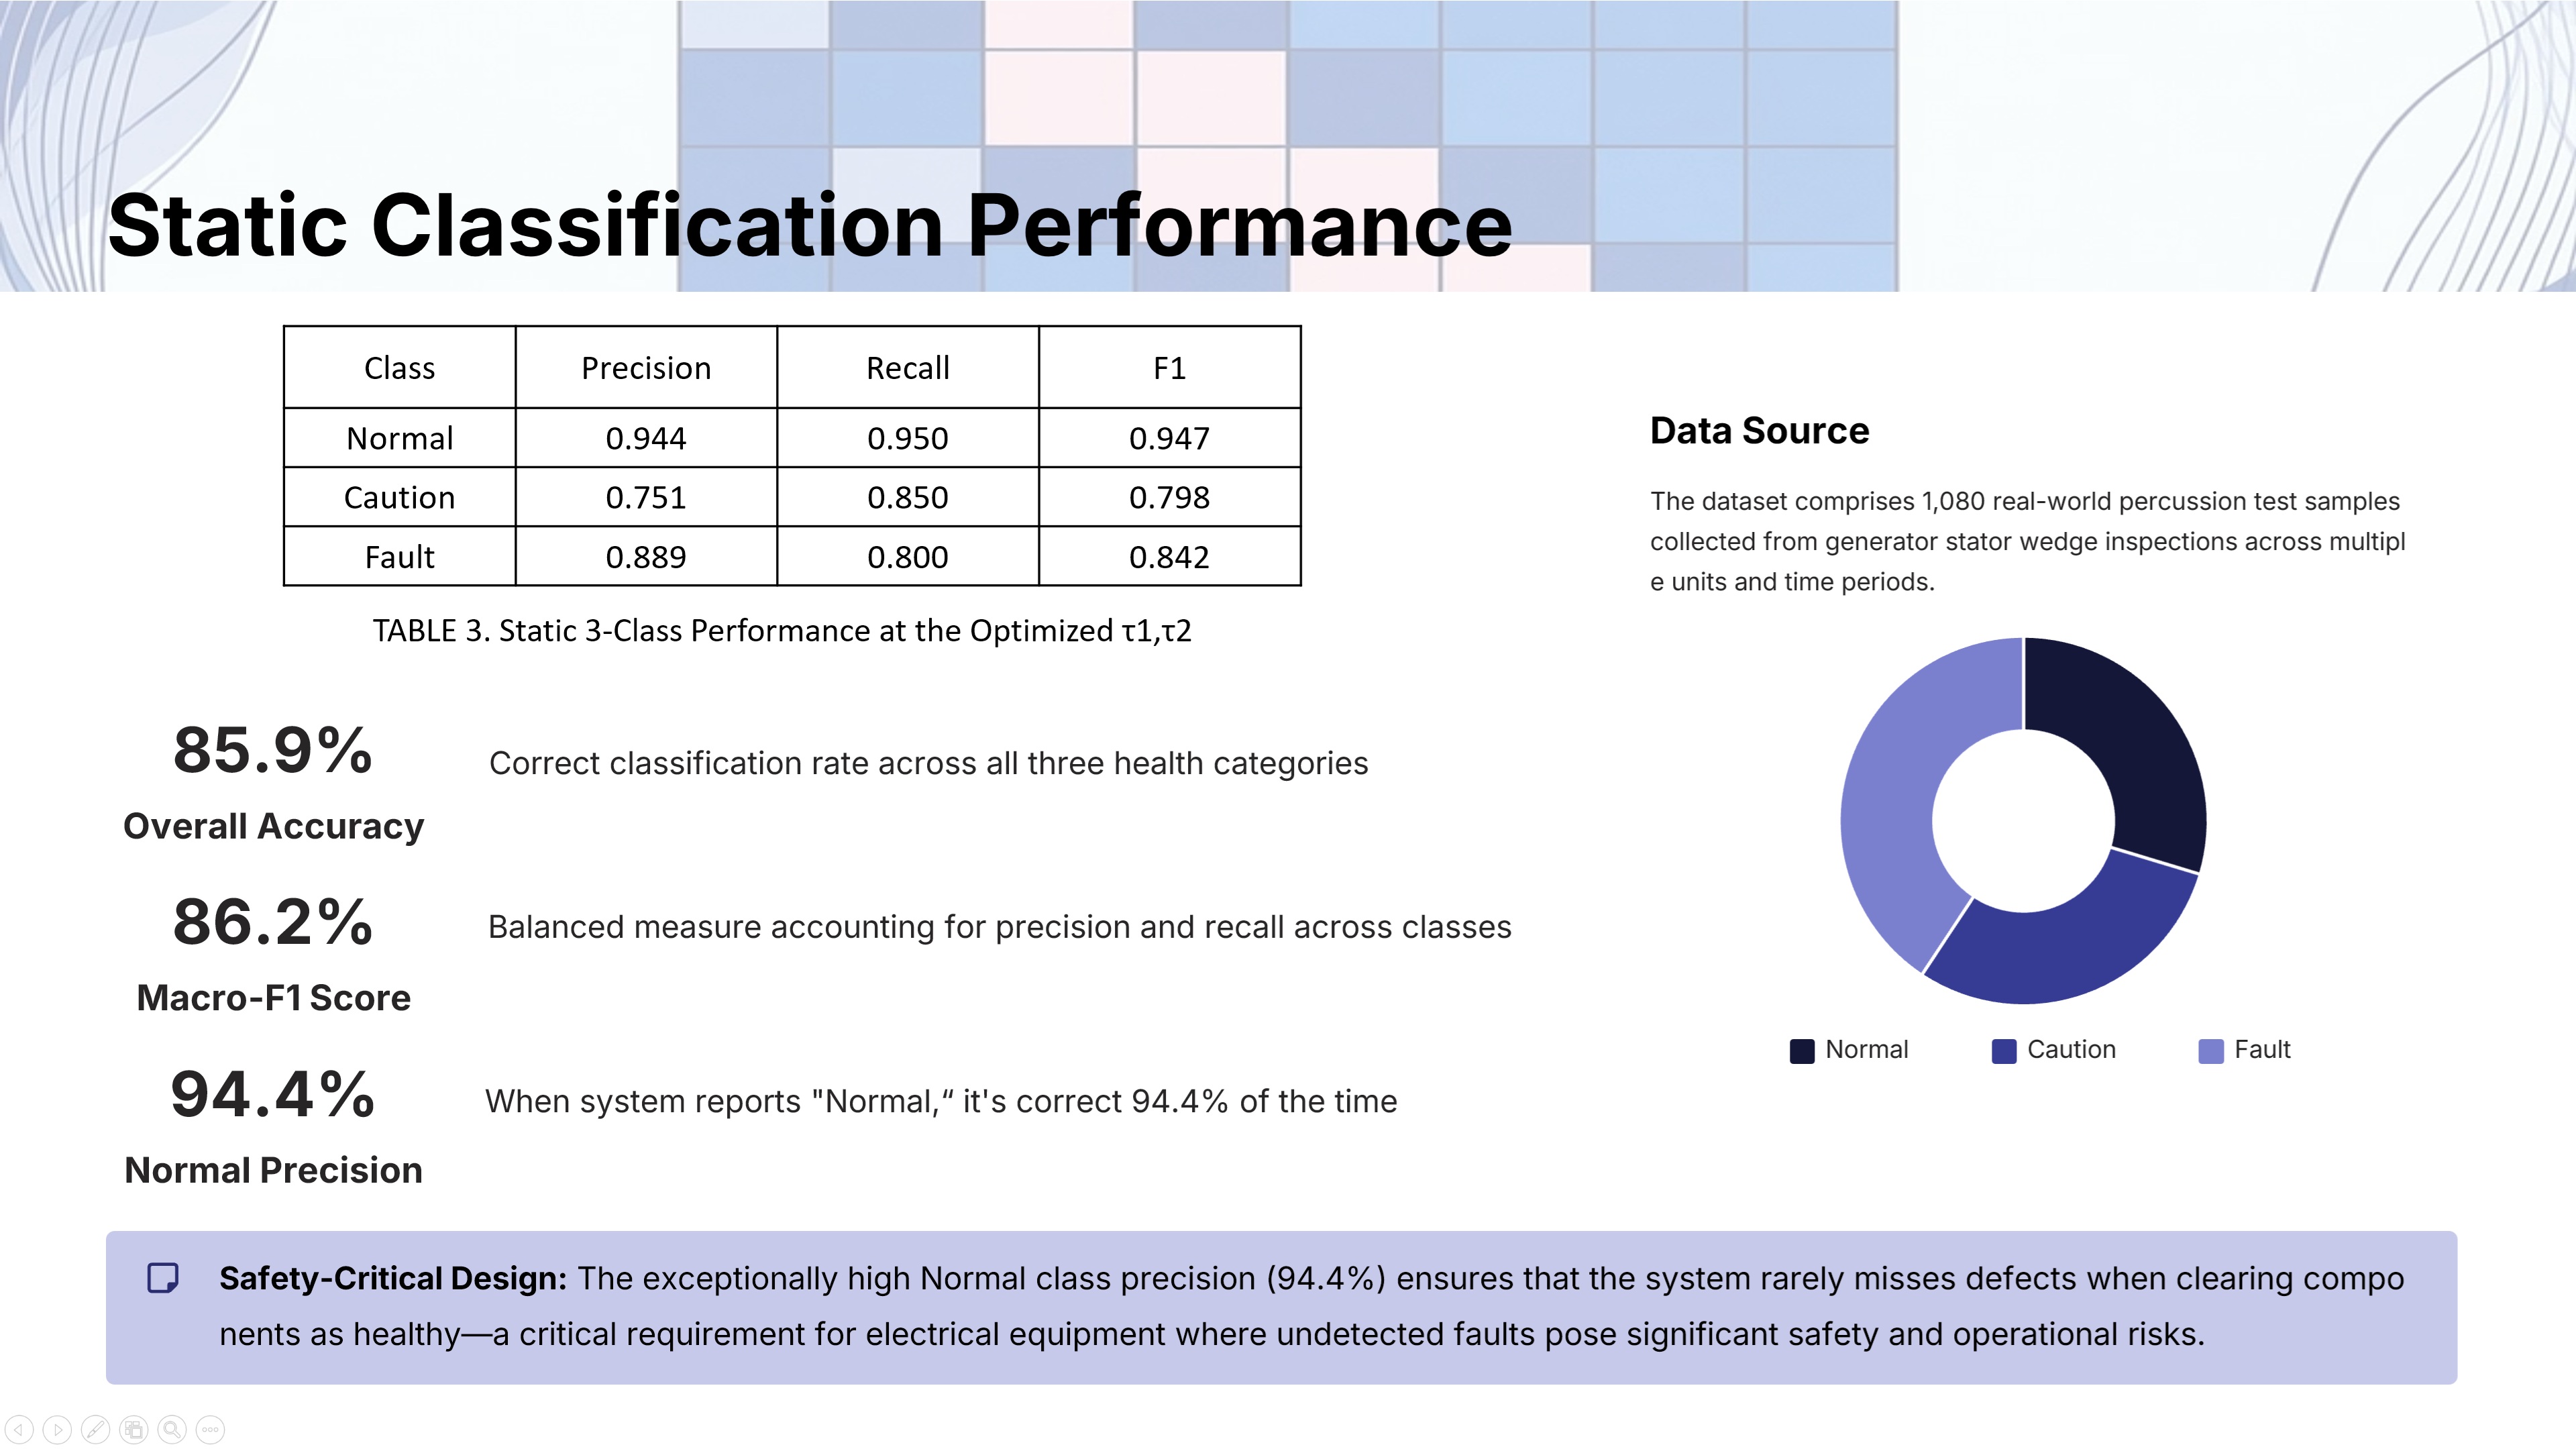 |
First, lets look at the static classification performance. The system achieved a High Precision of 94.4% for the Normal class. This represents a Safety-Critical Design philosophy. It means, if the system says a component is safe, you can trust that assessment with high confidence. We have minimized the risk of missing a potential defect to the absolute lowest level. |
| ICACT20260214 Slide.21
[Big Slide]
[YouTube] |
Chrome Click!! |
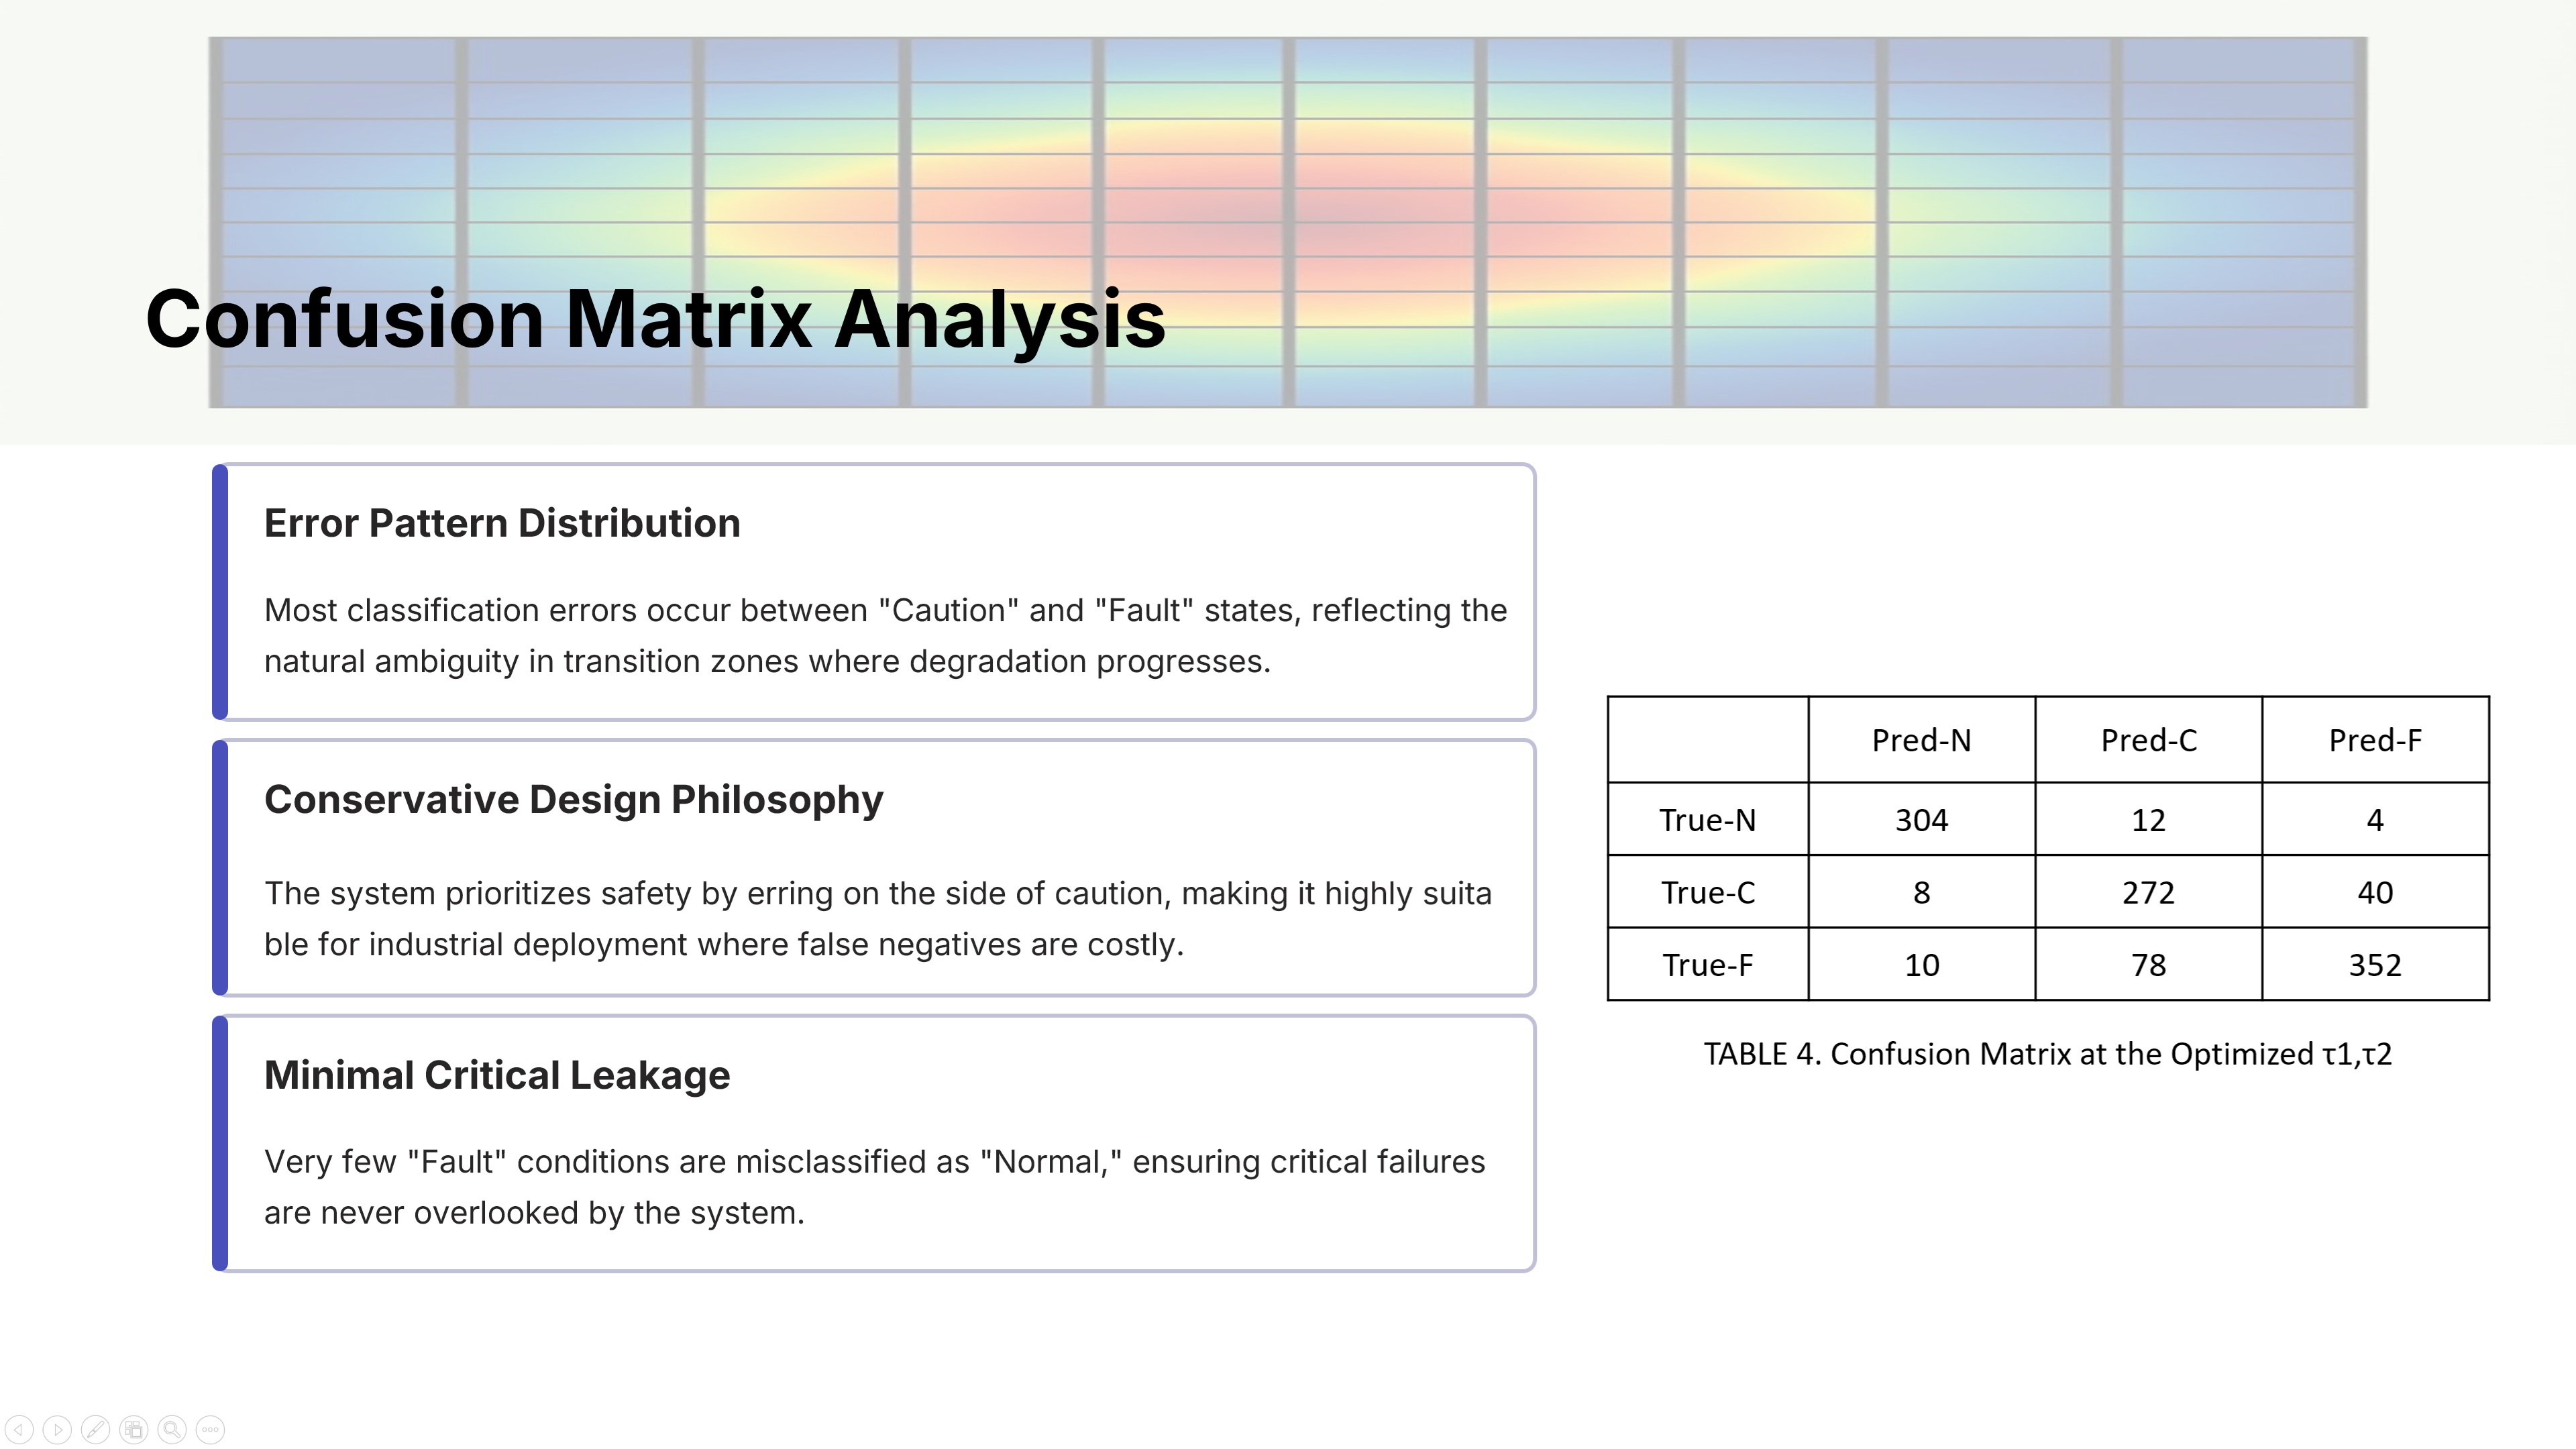 |
The Confusion Matrix further confirms our conservative design approach. Most errors are clustered between Caution and Fault, which is a natural ambiguity during the degradation process. Importantly, there is Minimal Critical Leakage. Very few Faults were misclassified as Normal. This proves the system is safe and conservative enough for real-world industrial deployment. |
| ICACT20260214 Slide.22
[Big Slide]
[YouTube] |
Chrome Click!! |
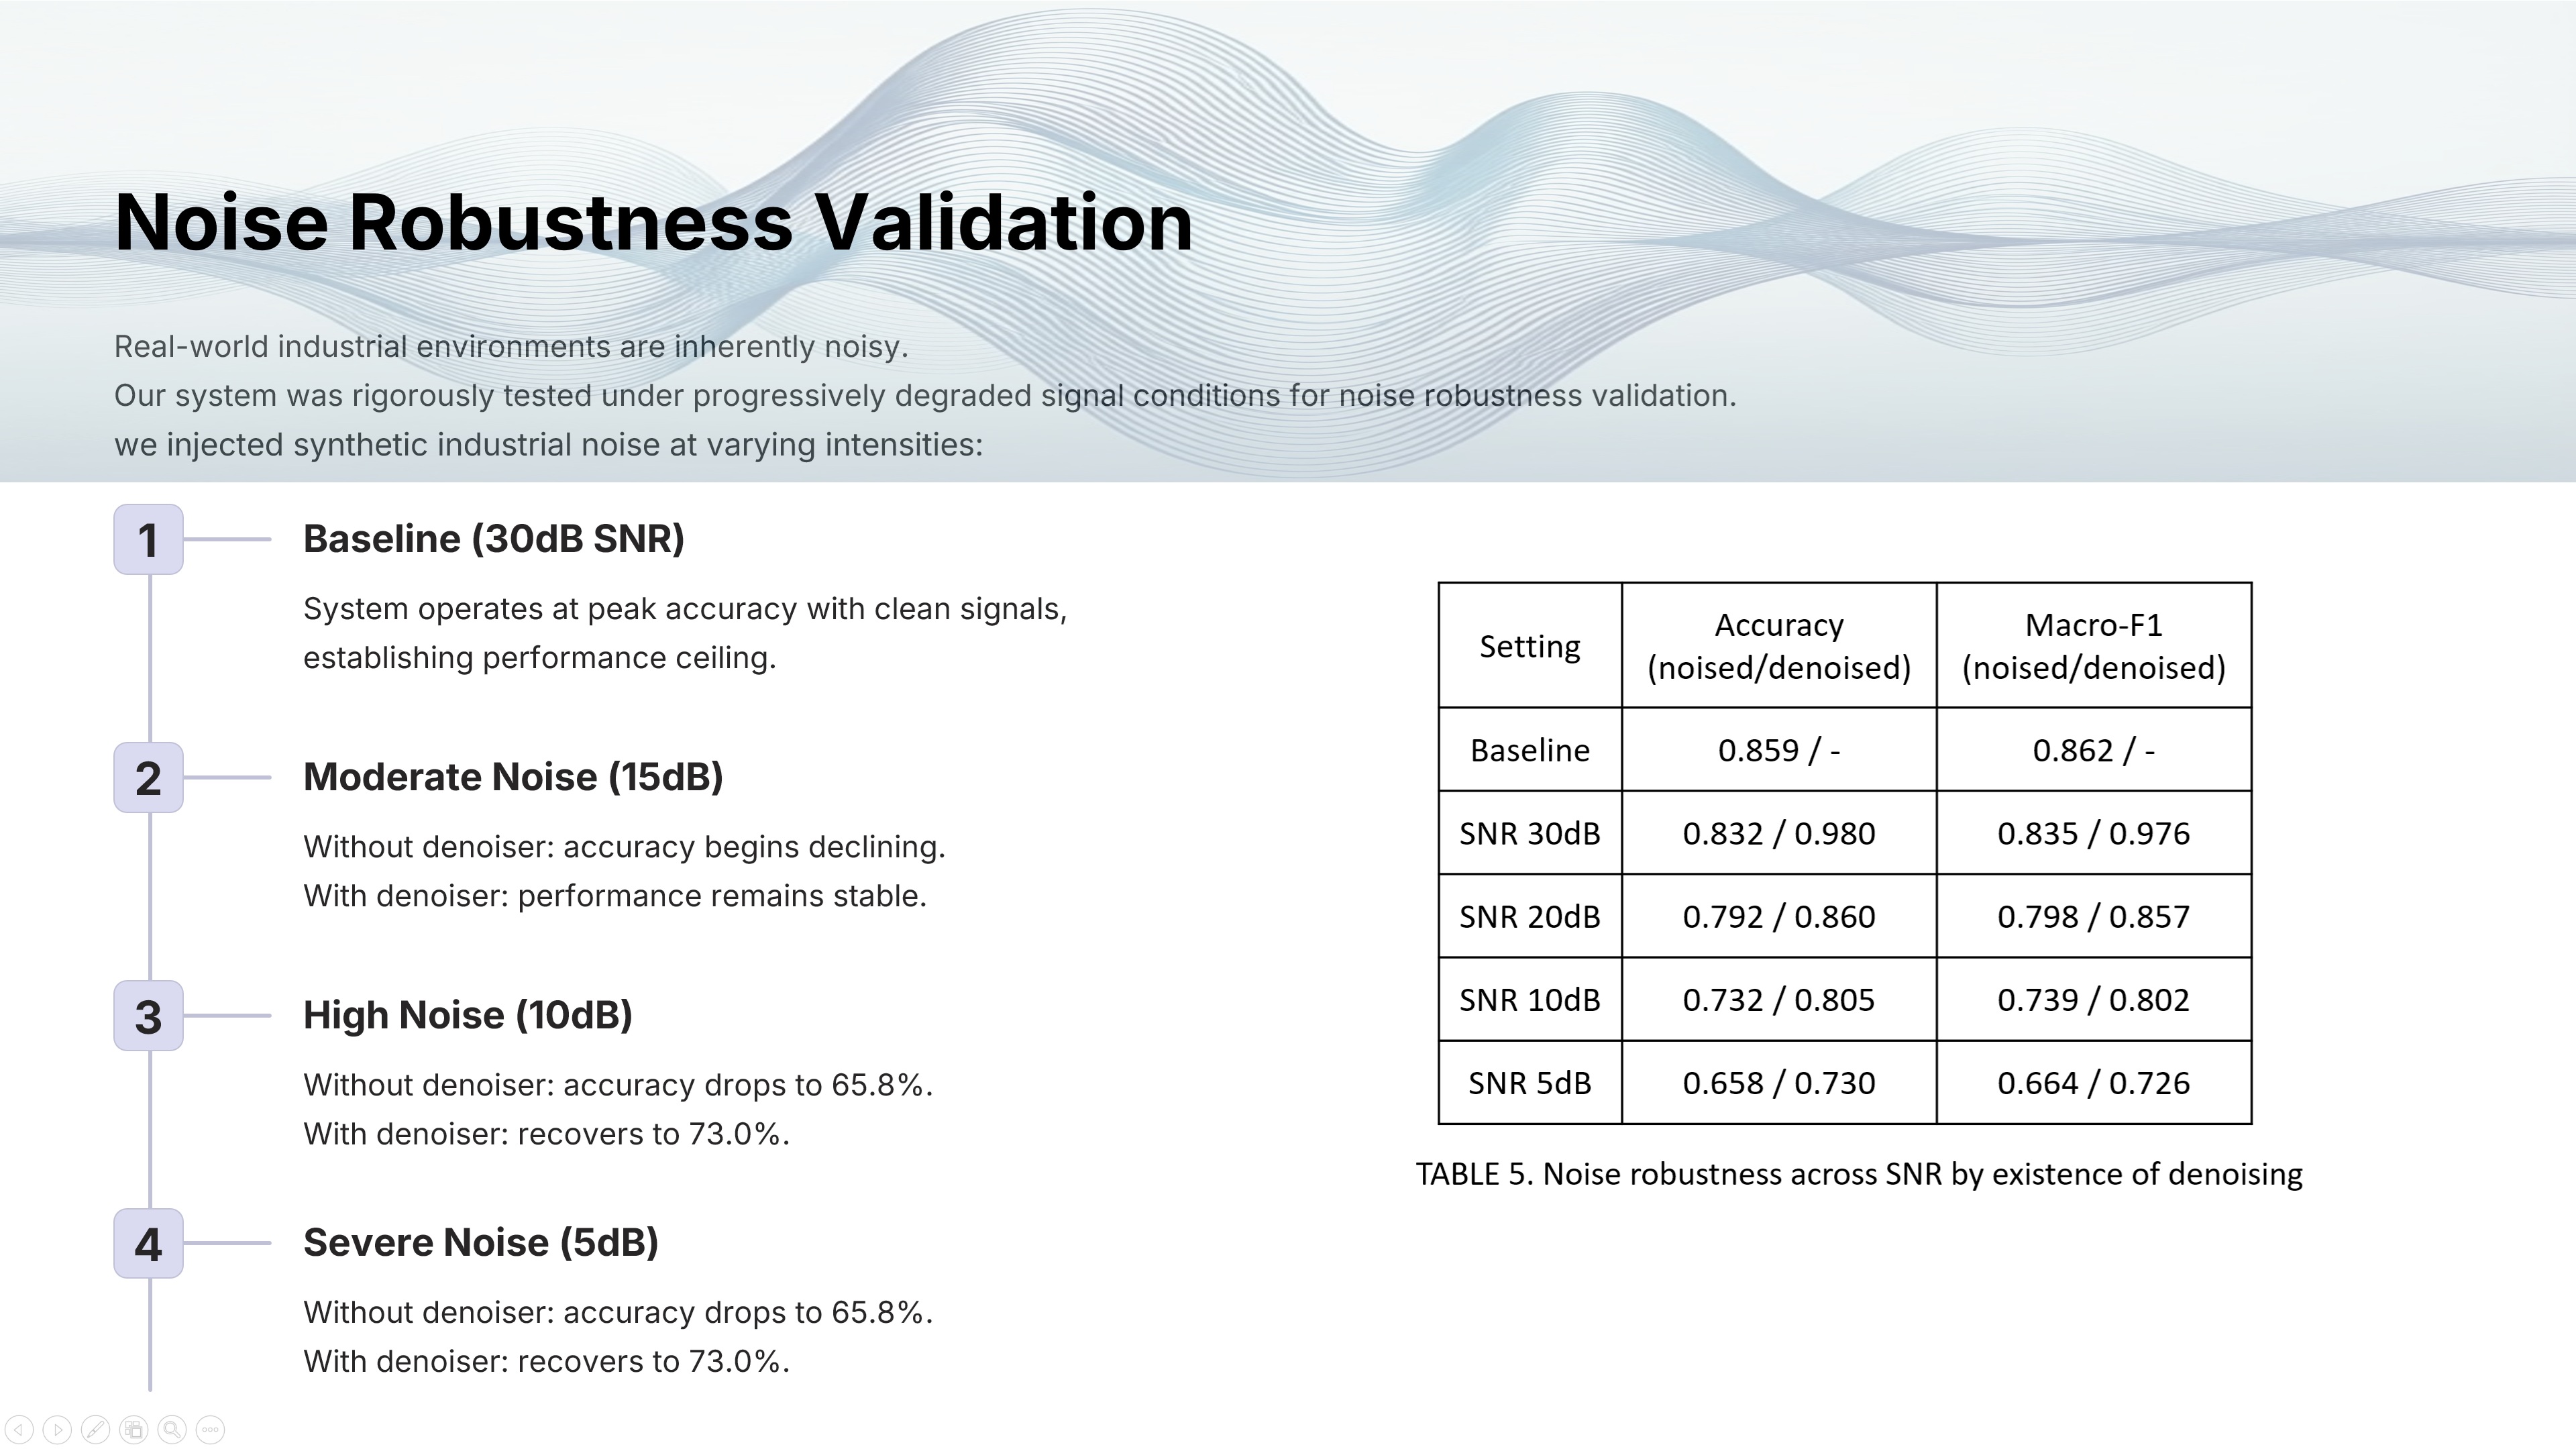 |
What about noise robustness? We tested the system at various SNR levels. As shown in the table, without the denoiser, looking at the left numbers, accuracy drops significantly at 5dB. However, with the denoiser, looking at the right numbers, we recover performance to a respectable 73% accuracy even at 5dB. This proves our system is robust against severe industrial noise conditions. |
| ICACT20260214 Slide.23
[Big Slide]
[YouTube] |
Chrome Click!! |
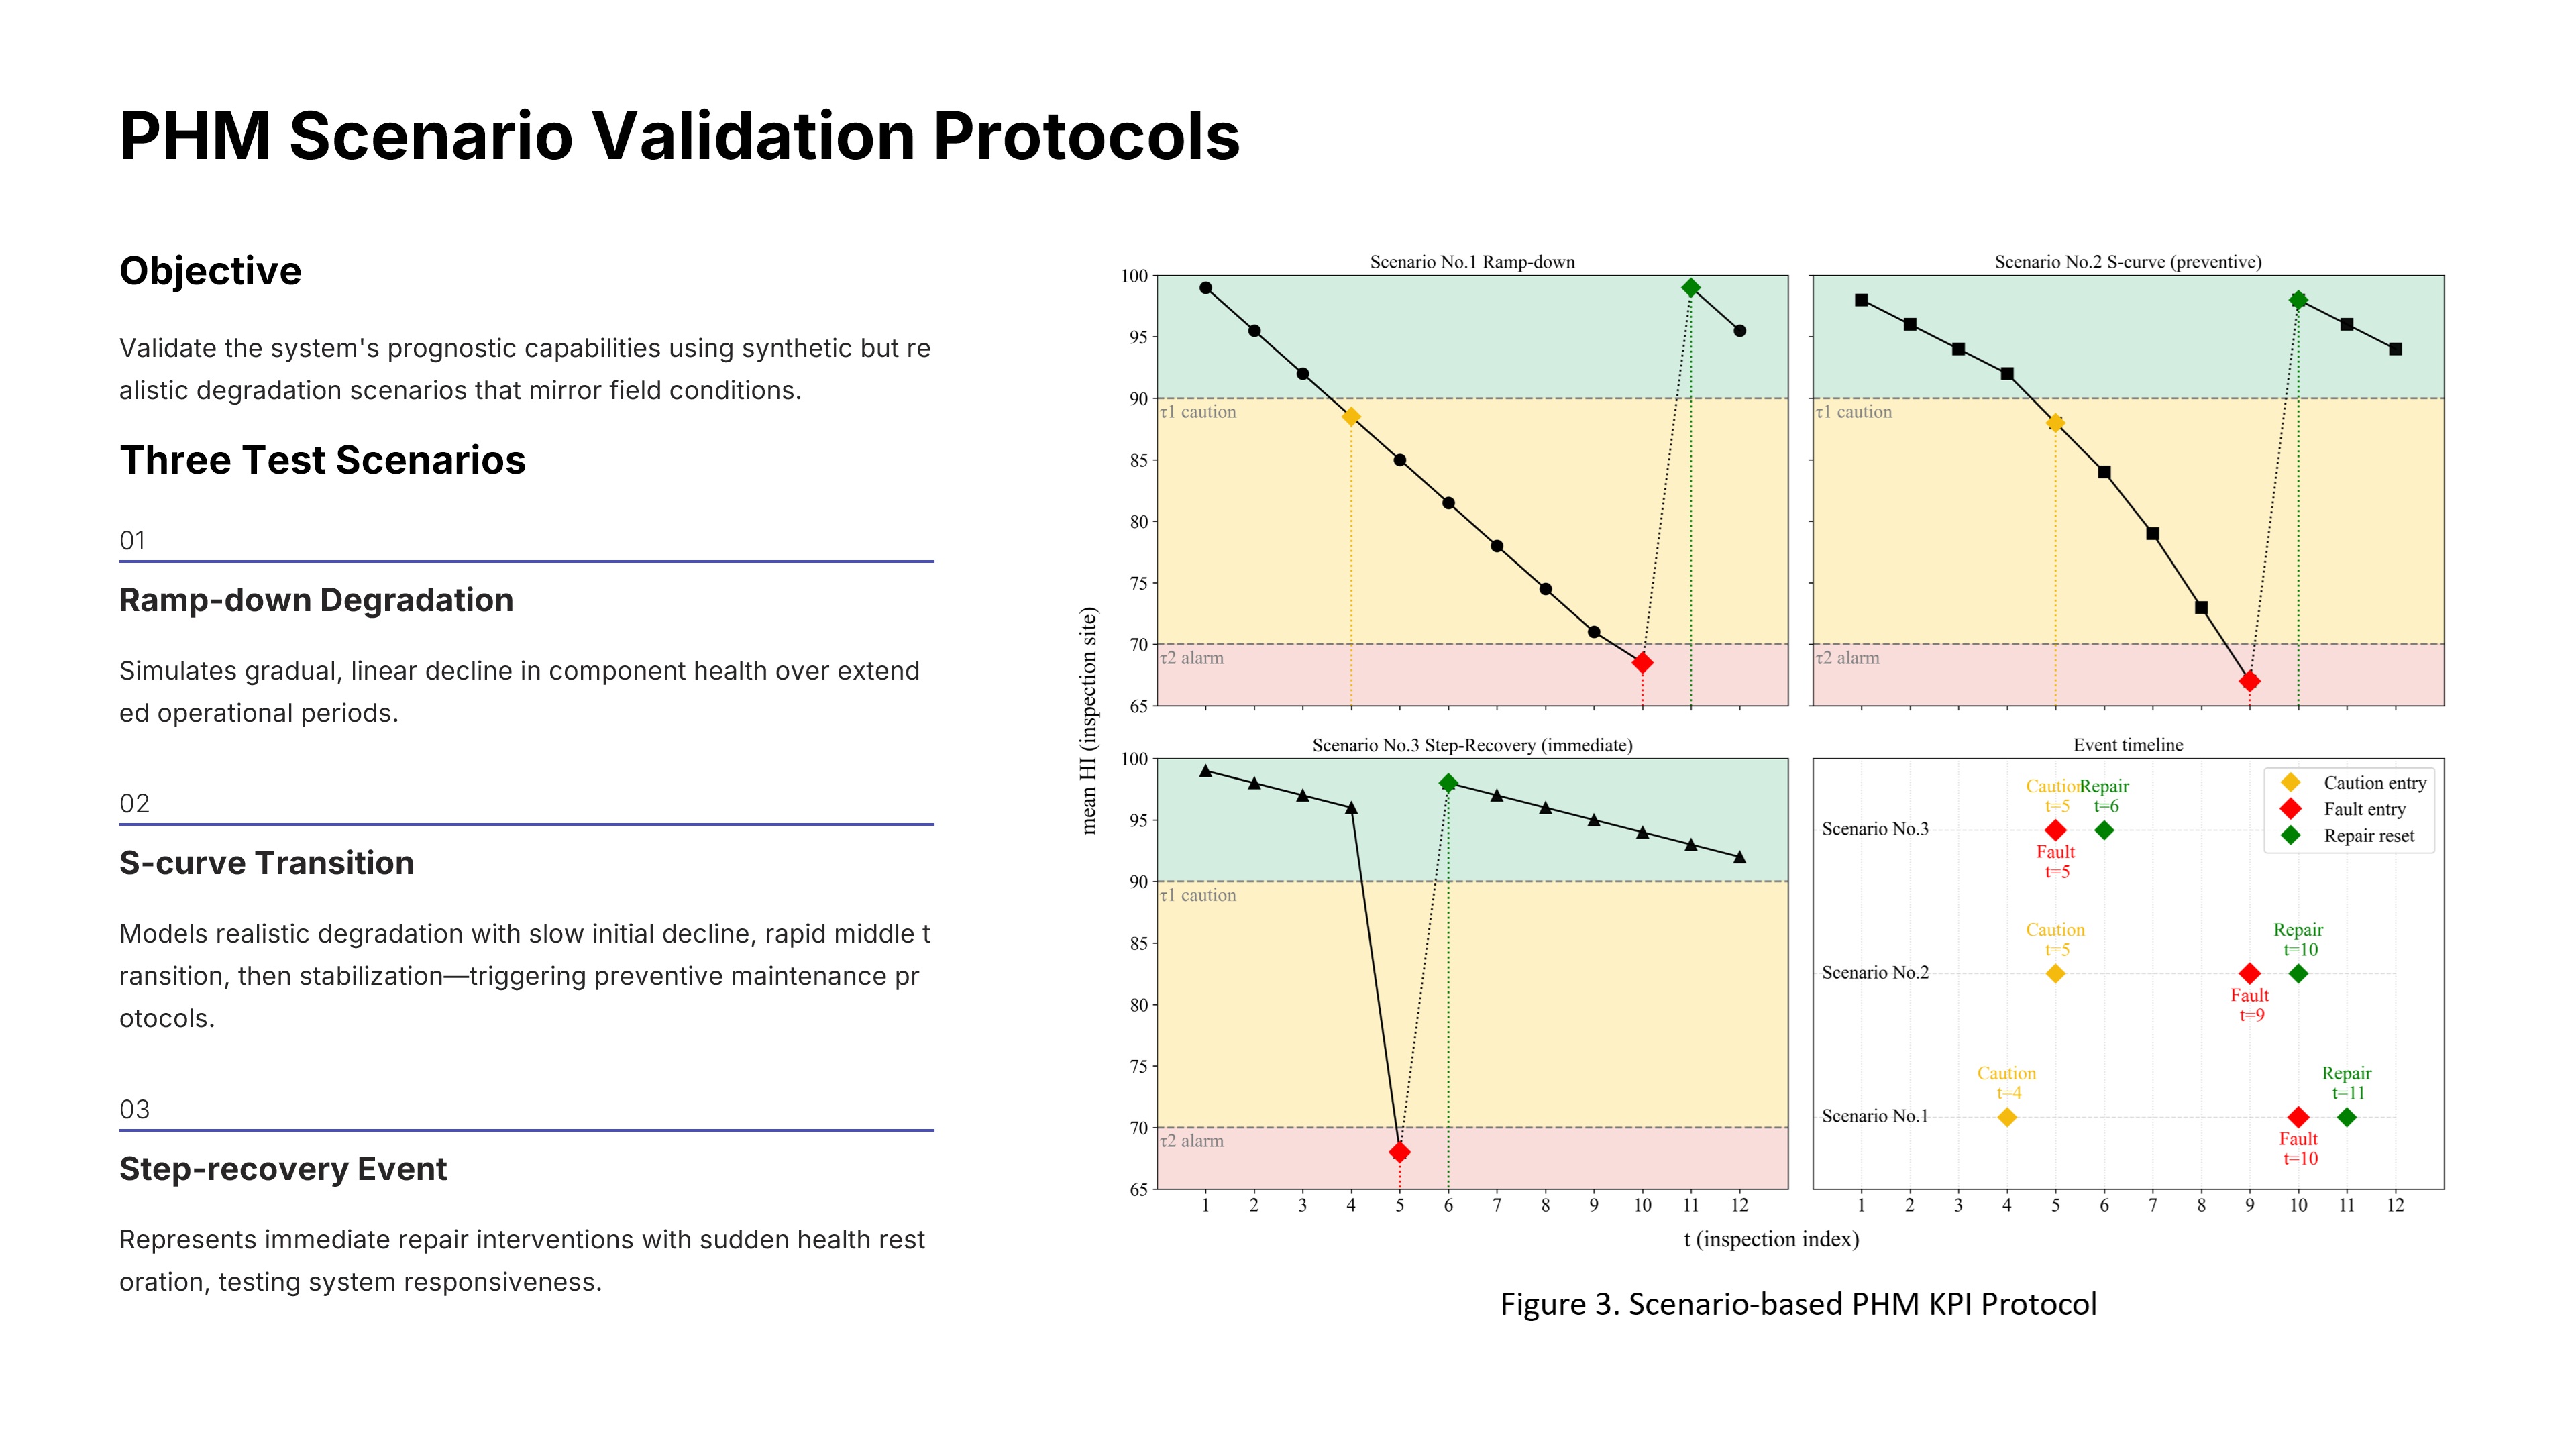 |
To validate the systems predictive capabilities, we simulated three realistic degradation scenarios. Ramp-down, S-curve, and Step-recovery. These represent the most common patterns we see in the field. We tracked how the Health Index, shown as the black line, behaves over time against our defined thresholds. |
| ICACT20260214 Slide.24
[Big Slide]
[YouTube] |
Chrome Click!! |
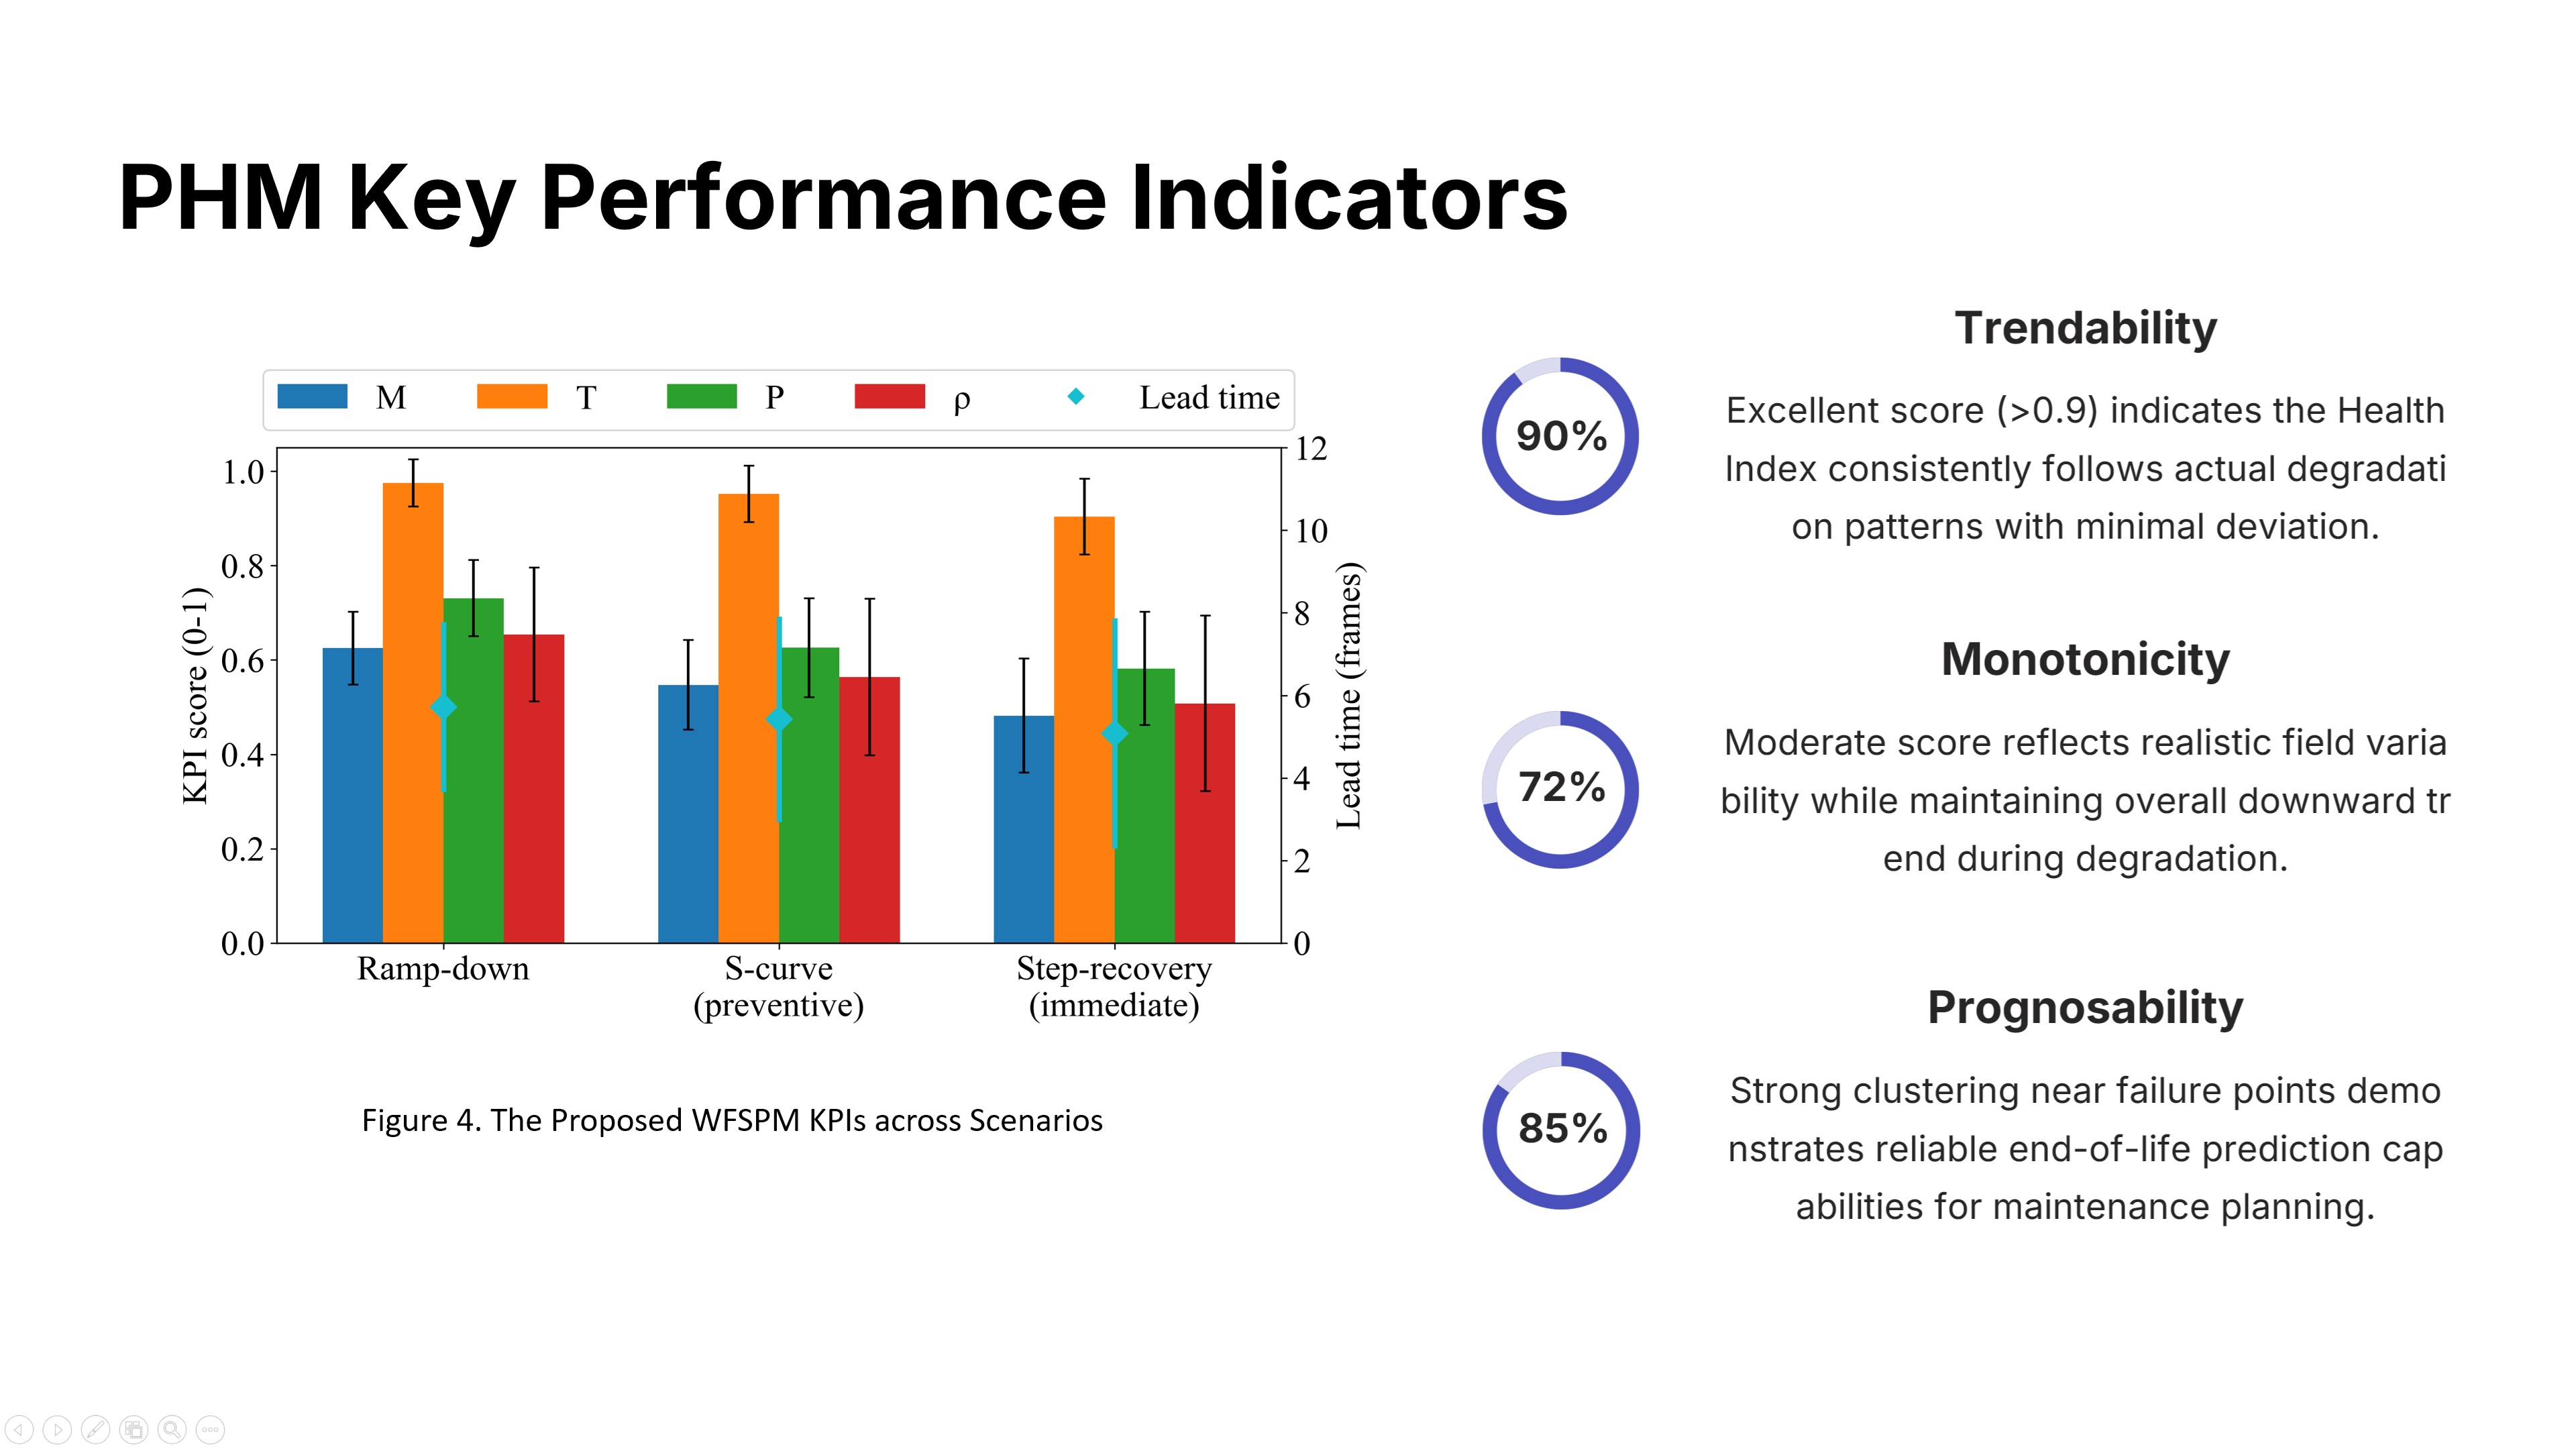 |
We evaluated this using standard PHM metrics. Trendability, represented by the Orange bar, is excellent, meaning the Health Index tracks the actual degradation accurately. Prognosability, the Green bar, shows strong clustering near failure points. This confirms that our Health Index is a reliable, trustworthy indicator of the assets health status. |
| ICACT20260214 Slide.25
[Big Slide]
[YouTube] |
Chrome Click!! |
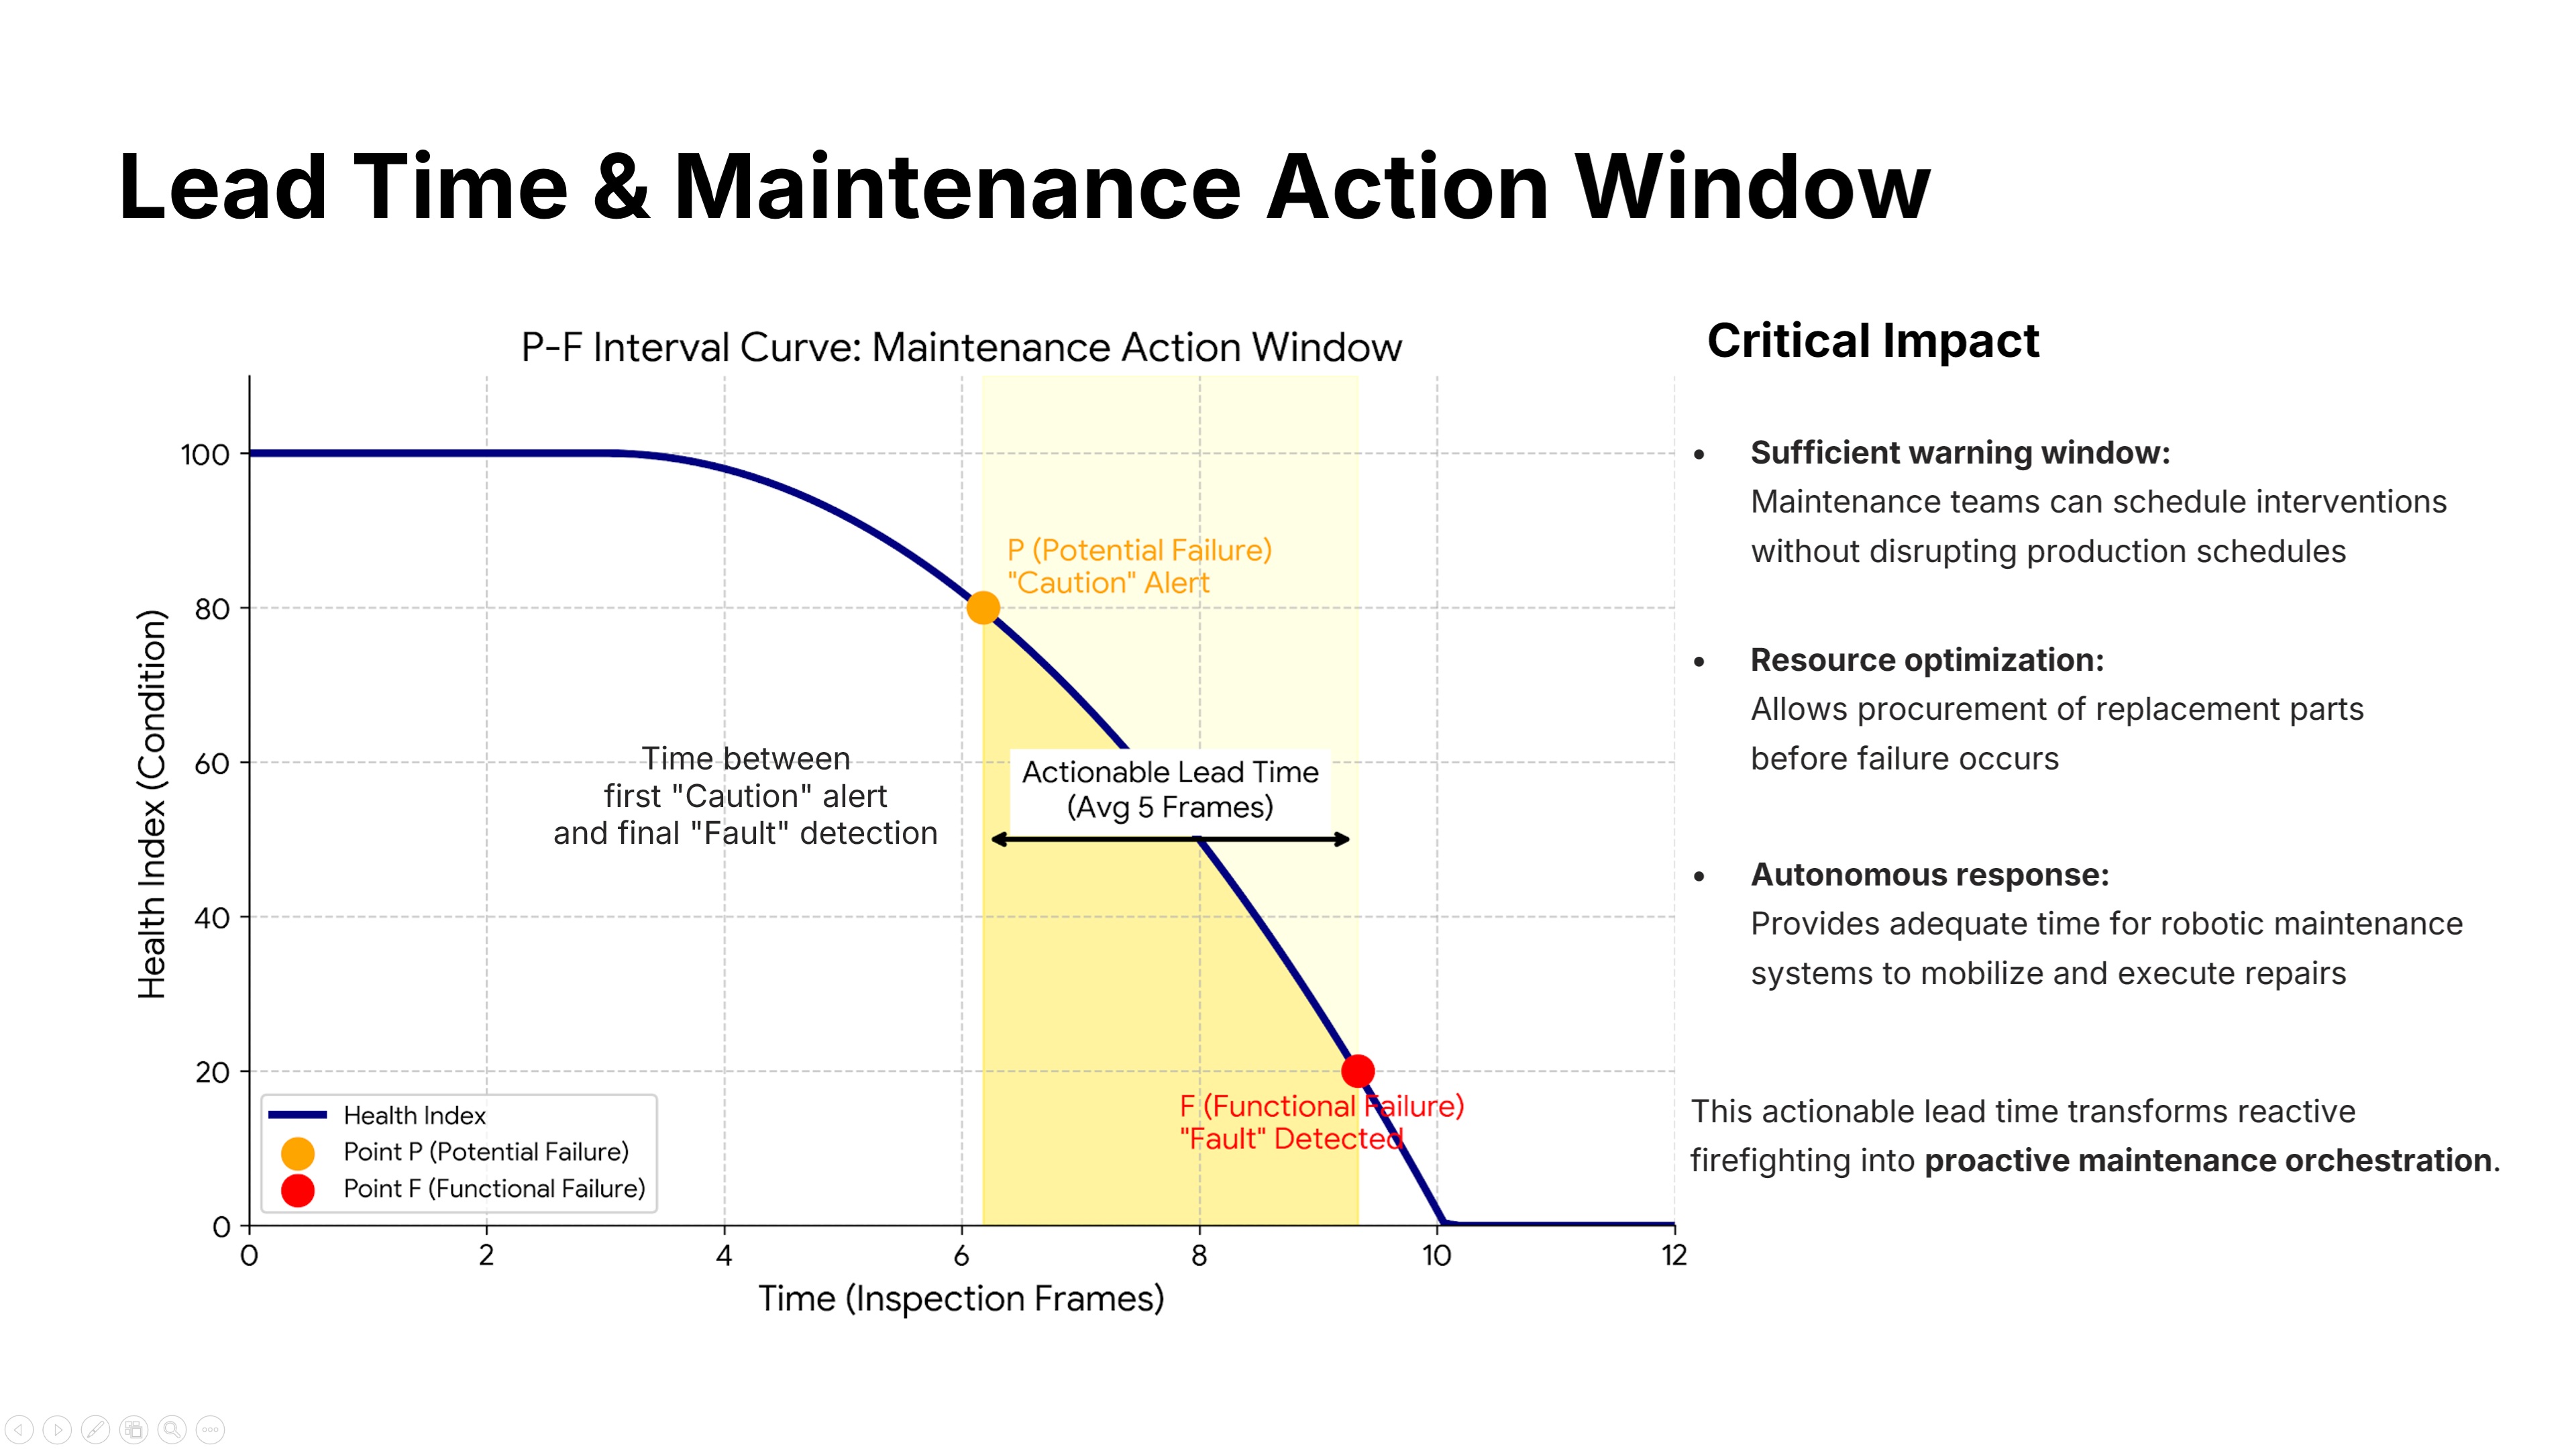 |
This is perhaps the most important slide for operations managers. The P-F Interval Curve shows the critical time between the first Caution alert, and the final Fault detection. We secured an average Lead Time of 5 Frames. This gives the maintenance team a sufficient Action Window to order parts and schedule repairs, well before a functional failure occurs. This transforms maintenance from reactive firefighting, into proactive, planned orchestration. |
| ICACT20260214 Slide.26
[Big Slide]
[YouTube] |
Chrome Click!! |
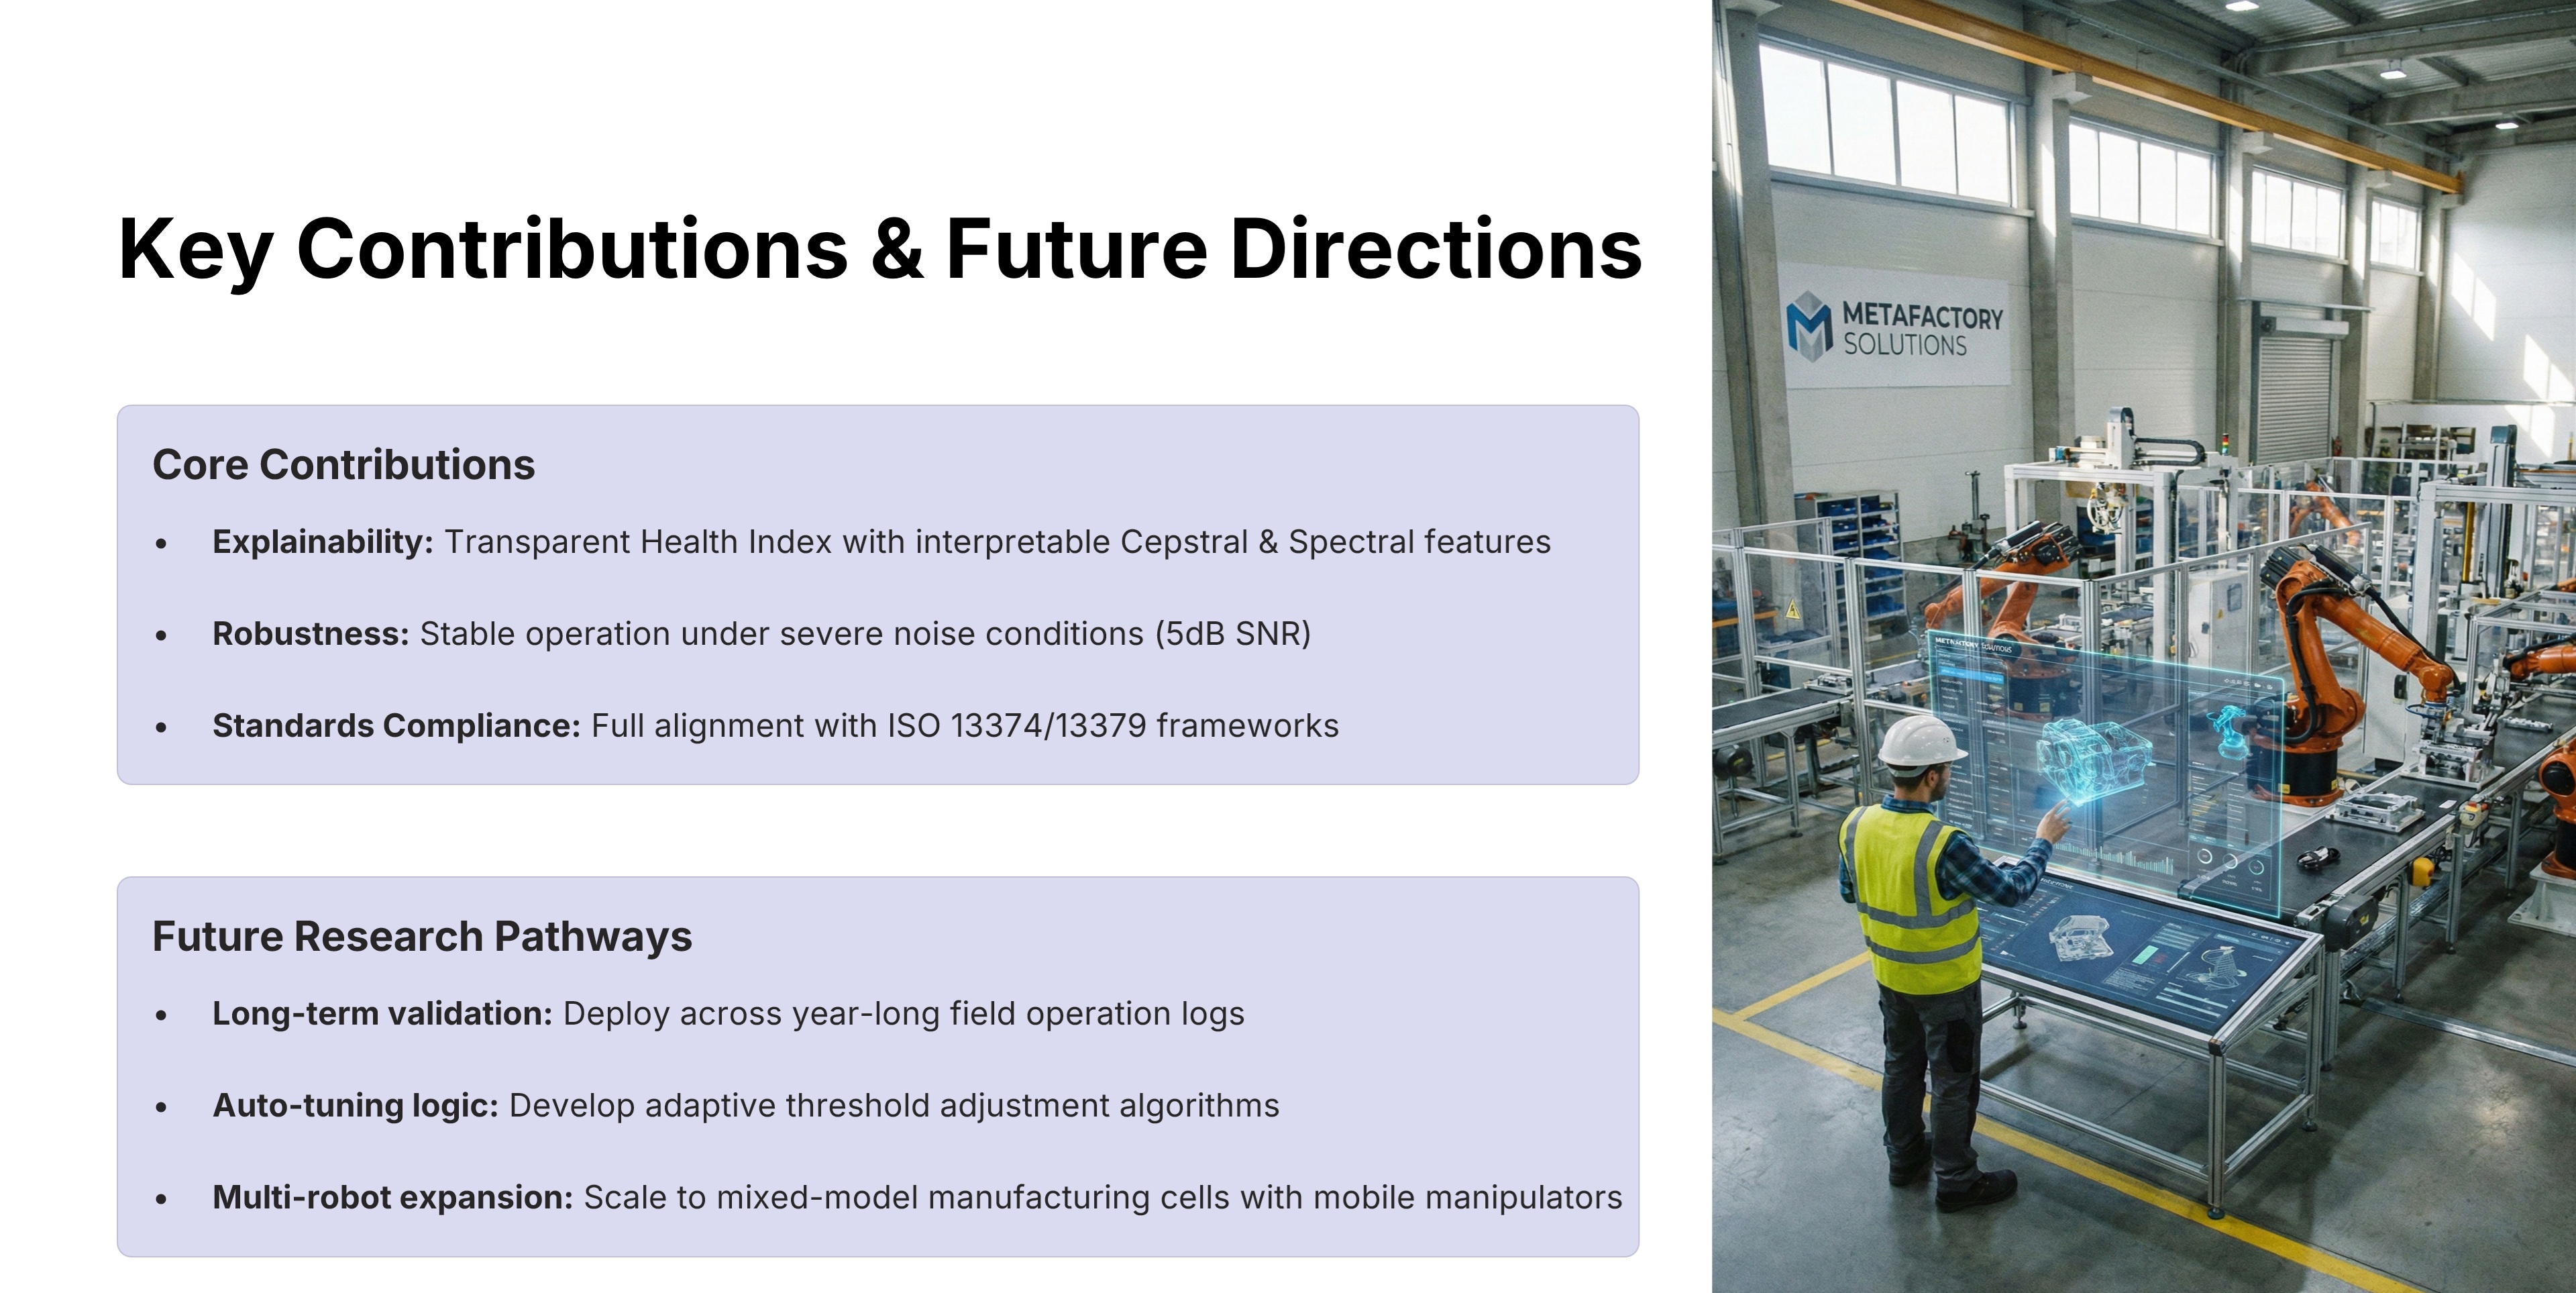 |
In conclusion, our WFSPM system delivers three core contributions to the field. First, Explainability via transparent features and an interpretable Health Index. Second, Robustness against severe industrial noise. And third, Standards Compliance for easy integration. For future work, we plan to deploy this system on long-term field operations, and expand it to multi-robot cooperative systems. |
| ICACT20260214 Slide.27
[Big Slide]
[YouTube] |
Chrome Click!! |
 |
That concludes my presentation on our End-to-End Predictive Maintenance System. Thank you very much for your attention, and I welcome any questions you may have. |















