 ICACT20260379 Slide.01
[Big Slide] |
Chrome  Click!! |
 |
Evaluation of the Classification of Higher Education Institutions by Multiclass Logistic Regression and Entropy |
| ICACT20260379 Slide.02
[Big Slide]
|
Chrome Click!! |
 |
This paper, presents Evaluation of the classification of higher education institutions by multiclass logistic regression and entropy. We examined the relationship between data item selection and entropy. By examining various item selection situations using real data, we gained insight into item selection and classification evaluation based on the entropy and f1-score of each class.
|
| ICACT20260379 Slide.03
[Big Slide]
|
Chrome Click!! |
 |
In recent years, the scope of data science applications has rapidly expanded to various fields, including business, finance, education, and other social sciences.
In addition, the amount of data and the number of data items being handled are becoming enormous.
In this paper, financial data of higher education institutions is investigated as such large data set.
|
| ICACT20260379 Slide.04
[Big Slide]
|
Chrome Click!! |
 |
Multiclass logistic regression analysis has been used as a basic method for various multi-class classification problems [1],
including image classification problems.
In recent references,
nonlinear randomized multiclass logistic regression analysis was proposed as a method to improve the classification accuracy of multiclass logistic regression by using randomization and nonlinearization [2].
Multiclass logistic regression analysis has been developed as a theoretically sophisticated method as an extension of regression analysis.
Numerous applied studies on multiclass classification have been conducted.
|
| ICACT20260379 Slide.05
[Big Slide]
|
Chrome Click!! |
 |
However, there are still issues to be resolved regarding
selection of data items, and
practical methods for evaluating classification quality.
In this paper,
we focus on the relationship between f1-score which is related to accuracy, and entropy,
and examine the followings:
We use concrete examples to examine how item selection affects results.
We also consider suggestions for improving classification.
|
| ICACT20260379 Slide.06
[Big Slide]
|
Chrome Click!! |
 |
(1) First, we will discuss the logistic regression [1].
Logistic regression is a well-known statistical method for predicting the probability of an event from multiple explanatory variables.
It is widely used in supervised classification tasks in machine learning
The output of the method is a value between 0 and 1, that can be regarded as probability of class membership.
Logistic regression makes predictions based on a linear combination of features.
(2) Multi-class logistic regression uses multiple classifiers, logistic regressions, simultaneously to perform multi-class classification tasks.
|
| ICACT20260379 Slide.07
[Big Slide]
|
Chrome Click!! |
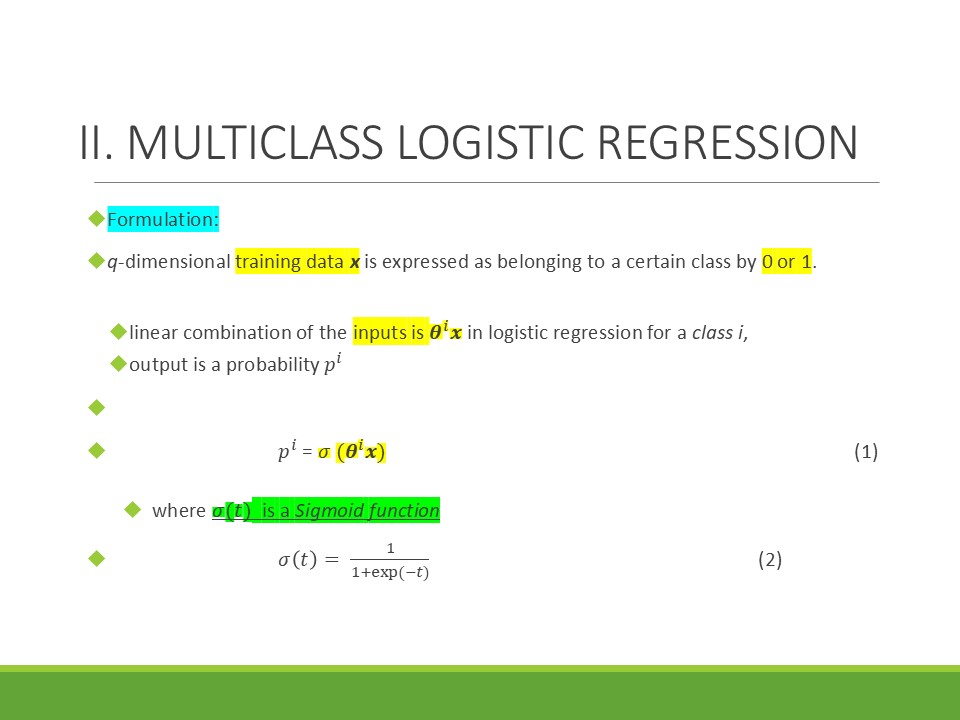 |
Formulation:
q-dimensional training data x is expressed as belonging to a certain class by 0 or 1.
linear combination of the inputs is 𝜽^𝑖 𝒙 in logistic regression for a class i,
output is a probability 𝑝^𝑖
𝑝^𝑖 = 𝜎 (𝜽^𝑖 𝒙) (1)
where 𝜎(𝑡) is a Sigmoid function
𝜎(𝑡)= 1/(1+exp(−𝑡)) (2)
|
| ICACT20260379 Slide.08
[Big Slide]
|
Chrome Click!! |
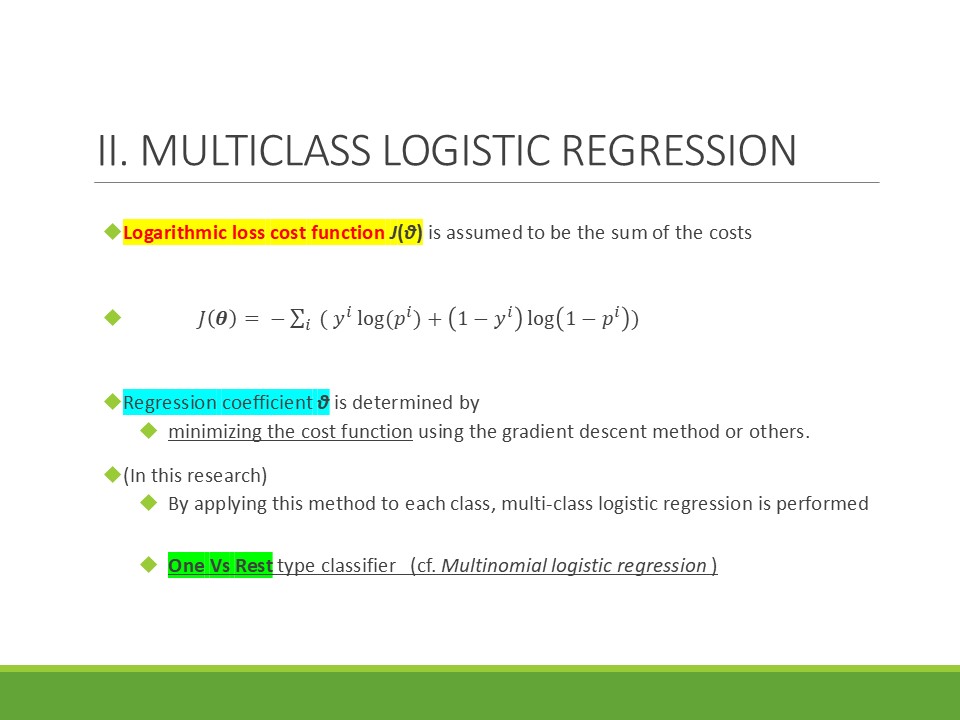 |
Logarithmic loss cost function J(θ) is assumed to be the sum of the costs
𝐽(𝜽)= −∑1_𝑖〖 ( 𝑦^𝑖 log(𝑝^𝑖)+(1−𝑦^𝑖 ) log(1−𝑝^𝑖 ))〗
Regression coefficient θ is determined by
minimizing the cost function using the gradient descent method or others.
(In this research)
By applying this method to each class, multi-class logistic regression is performed
One Vs Rest type classifier (cf. Multinomial logistic regression )
|
| ICACT20260379 Slide.09
[Big Slide]
|
Chrome Click!! |
 |
The numerical calculations partially utilize the Python libraries, which are popular tools [5]:
sklearn,
“linear_model.LogisticRegression”,
“multiclass.OneVsRestClassifier”.
We use these libraries with standard settings
class-balance correction is performed by randomly extracting data from well-balanced image data sets.
|
| ICACT20260379 Slide.10
[Big Slide]
|
Chrome Click!! |
 |
In general,
when there are many data items in a classification problem,
the selection of which data items to use is extremely important both theoretically and practically (data item selection problem).
There are various methods for analyzing the impact of the selection of data items on classification results.
In this paper, the selection of data items is investigated by spectral analysis of the input data matrix to logistic regression.
|
| ICACT20260379 Slide.11
[Big Slide]
|
Chrome Click!! |
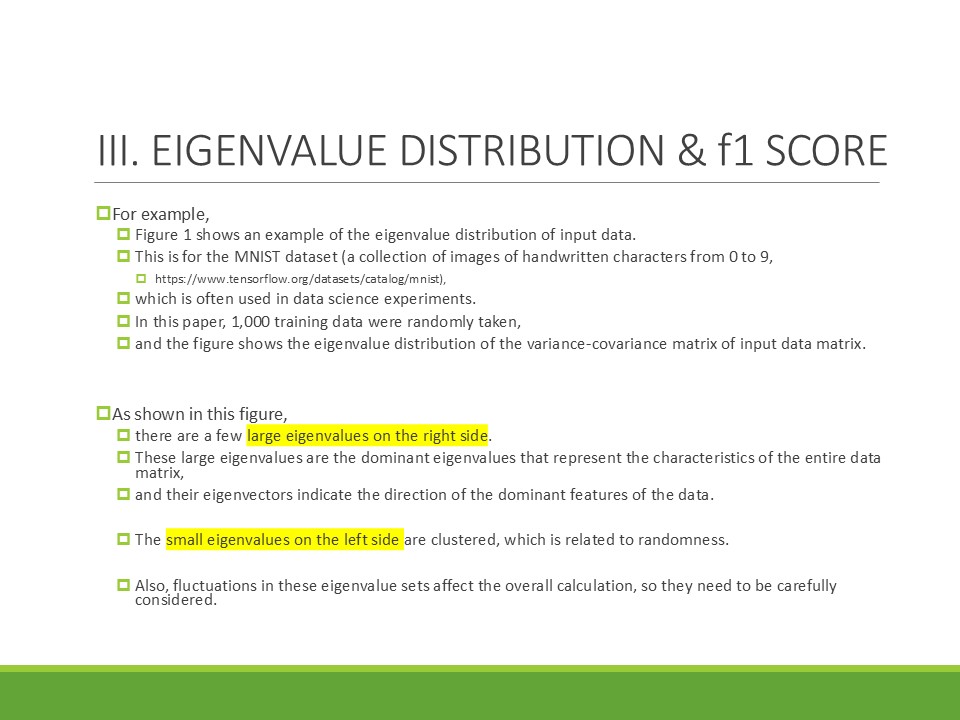 |
For example,
Figure 1 shows an example of the eigenvalue distribution of input data.
This is for the MNIST dataset (a collection of images of handwritten characters from 0 to 9), which is often used in data science experiments.
In this paper, 1,000 training data were randomly taken,
and the figure shows the eigenvalue distribution of the variance-covariance matrix of input data matrix.
|
| ICACT20260379 Slide.12
[Big Slide]
|
Chrome Click!! |
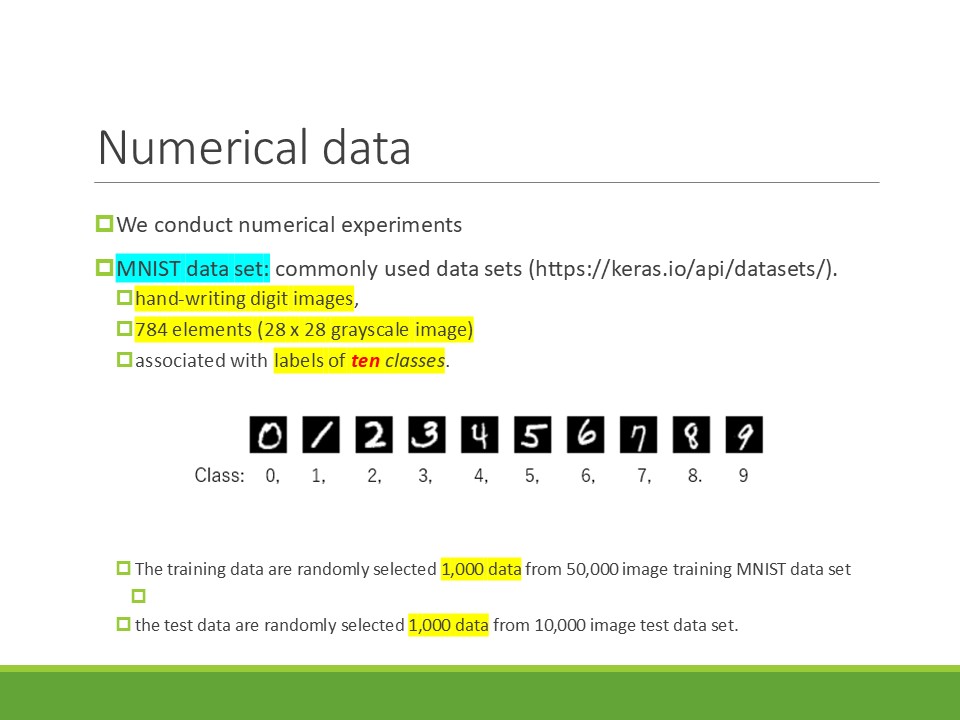 |
This is for the MNIST dataset (a collection of images of handwritten characters from 0 to 9,
https://www.tensorflow.org/datasets/catalog/mnist),
which is often used in data science experiments.
In this paper, 1,000 training data were randomly taken,
and the figure shows the eigenvalue distribution of the variance-covariance matrix of input data matrix.
|
| ICACT20260379 Slide.13
[Big Slide]
|
Chrome Click!! |
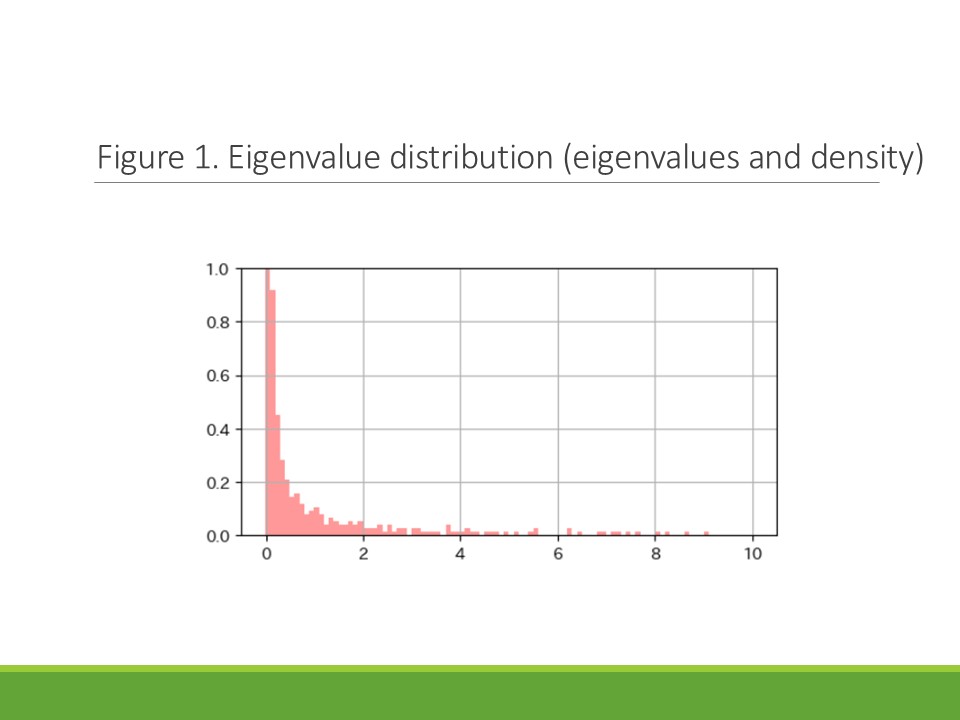 |
As shown in this figure,
there are a few large eigenvalues on the right side.
These large eigenvalues are the dominant eigenvalues that represent the characteristics of the entire data matrix,
and their eigenvectors indicate the direction of the dominant features of the data.
The small eigenvalues on the left side are clustered, which is related to randomness.
Also, fluctuations in these eigenvalue sets affect the overall calculation, so they need to be carefully considered.
|
| ICACT20260379 Slide.14
[Big Slide]
|
Chrome Click!! |
 |
Evaluating the distribution of eigenvalues,
which have various important meanings, is essential for understanding the properties of a dataset.
Possible evaluations of the input data matrix include
the trace, determinant, and statistical indices such as the mean and variance of the matrix.
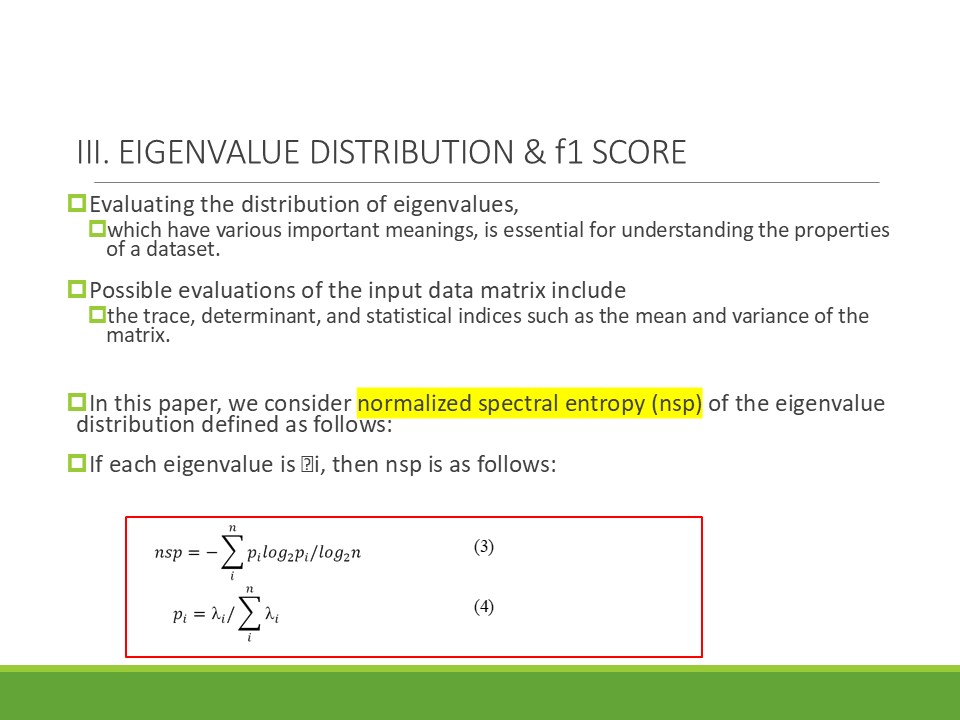
In this paper, we consider normalized spectral entropy (nsp) of the eigenvalue distribution defined as follows:
If each eigenvalue is i, then nsp is as follows:
|
| ICACT20260379 Slide.15
[Big Slide]
|
Chrome Click!! |
 |
The following relationship can be seen between spectral entropy and clustering:
A large eigenvalue indicates the variance of the data in the corresponding direction.
On the other hand, a large spectral entropy indicates that the variance is spread fairly evenly across multiple directions.
Conversely, a small spectral entropy indicates that a few directions dominate.
In the impact on clustering, when entropy is high, data spreads in many directions, making clustering difficult.
Conversely, when entropy is low, data tends to concentrate in a specific direction, making cluster boundaries clearer and making clustering easier.
In other words, the spectral entropy of the covariance matrix measures the diversity of the spread of the data and evaluates the clarity of the clusters.
|
| ICACT20260379 Slide.16
[Big Slide]
|
Chrome Click!! |
 |
In multi-class classification problems, metrics that measure the accuracy of classification are important.
For the input data matrix, we consider accuracy.
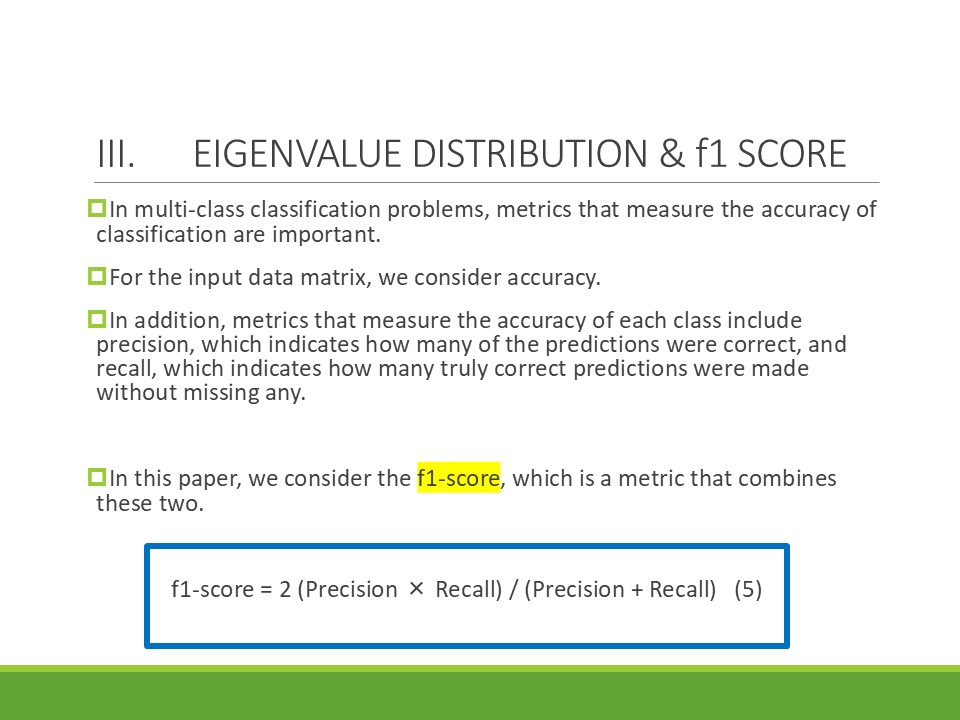
In addition, metrics that measure the accuracy of each class include precision, which indicates how many of the predictions were correct, and recall, which indicates how many truly correct predictions were made without missing any.
In this paper, we consider the f1-score, which is a metric that combines these two.
|
| ICACT20260379 Slide.18
[Big Slide]
|
Chrome Click!! |
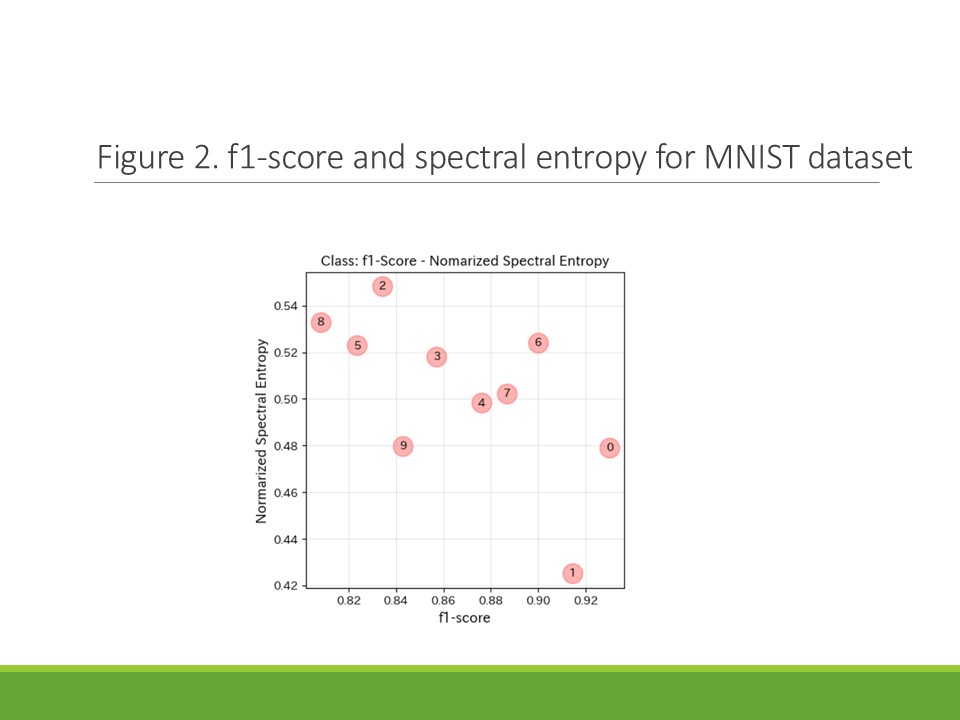 |
Figure 2 shows a numerical example for f1-score and normalized spectral entropy.
This figure is for the MNIST dataset mentioned above.
The horizontal axis is the f1-score, and the vertical axis is the spectral entropy.
The numbers in the circles correspond to single digits (e.g., 1, 2, 3, … ).
What can be seen from this figure is that
for 1 and 0, which have high f1-scores, and the entropy value is low, that indicates stable classification.
On the other hand, for 5 and 8, the entropy is high and the f1-score is low.
This case indicates that many feature directions are required to represent these complex characters, which increases the entropy and makes recognition difficult.
|
| ICACT20260379 Slide.19
[Big Slide]
|
Chrome Click!! |
 |
Generally, when entropy is low, the data is biased in a small number of directions, and if the data items related to that direction are selected, classification becomes easier, so it is thought that the f1-score will also increase.
In other words, the figure shows a line sloping downward to the right.
However, this does not necessarily the case.
The two types of indicators characterize datasets in different ways and require detailed consideration on a case-by-case basis.
|
| ICACT20260379 Slide.20
[Big Slide]
|
Chrome Click!! |
 |
In this section, we consider the real-world application of classification using multiclass logistic regression.
Note that this study is currently underway (work in progress), and the interpretation of the detailed discussion may change as it is refined in the future by the experts’ knowledge in finance field.
As mentioned above, in classification problems, when there are many data items, the selection of data items from among them is the issue.
It is important to analyze the impact of data item selection on the results.
Here, we consider the relationship between the selection of data items and the spectrum of the data matrix mentioned in the previous section.
|
| ICACT20260379 Slide.21
[Big Slide]
|
Chrome Click!! |
 |
In this section, we apply this to the actual finance field.
We attempt to classify higher education institutions (86 national universities in Japan) based on their financial indicators.
Various classifications of Japanese national universities have been considered.
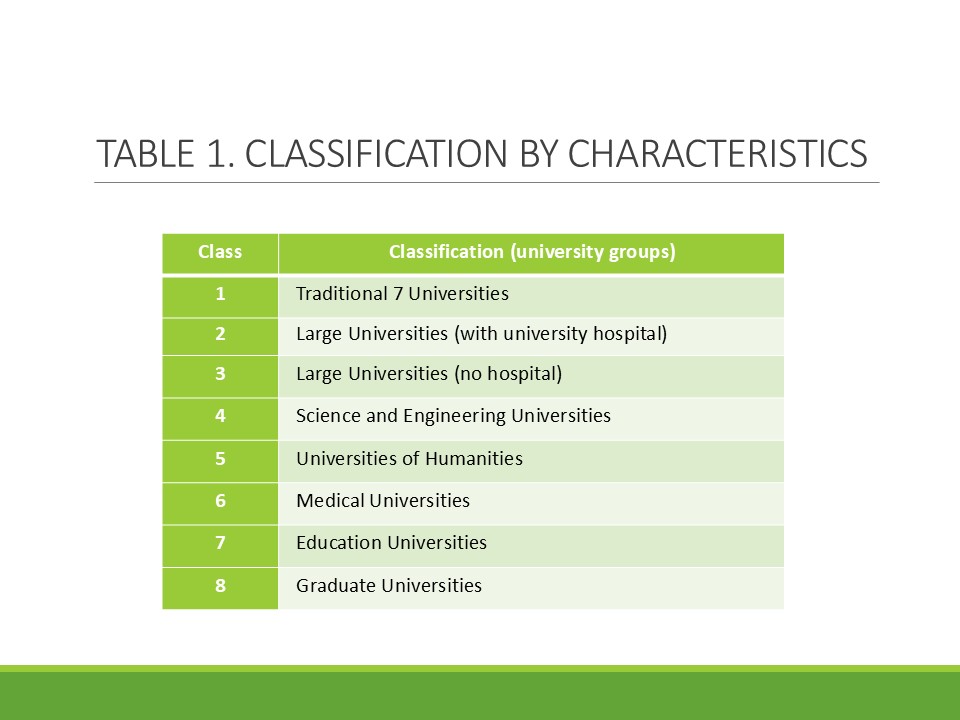
In this section, we consider a classification based on typical characteristics as follows [4].
This classification is based on the characteristics: history, size, affiliated university hospital, and field of study of the university.
|
| ICACT20260379 Slide.22
[Big Slide]
|
Chrome Click!! |
 |
Lets explain the data in a little more detail.
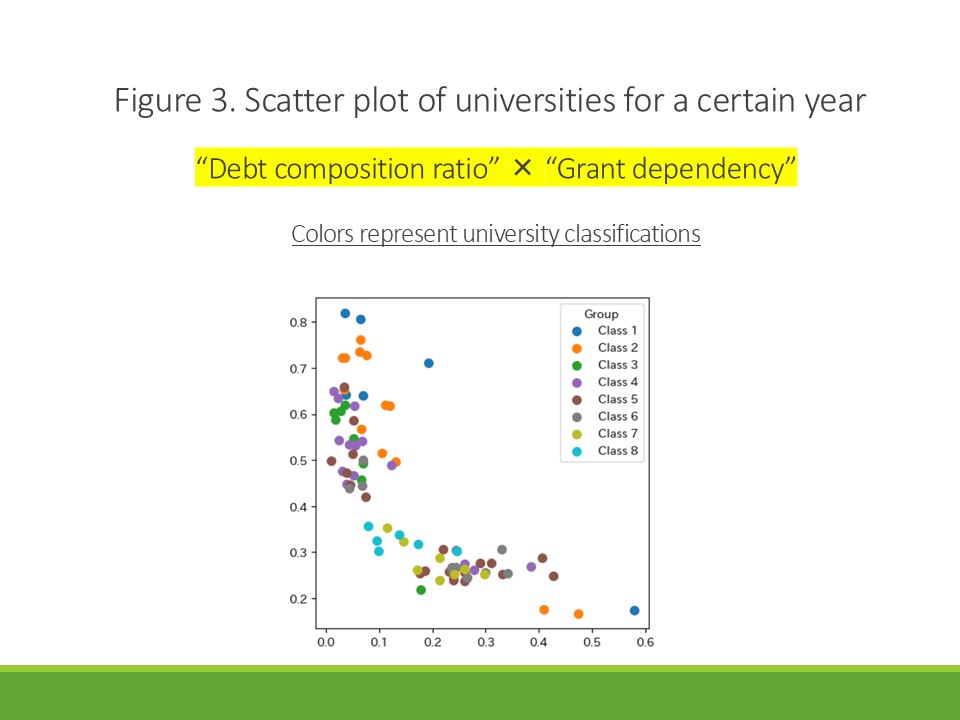
For example, Figure 3 is a scatter plot of two indicators for a particular fiscal year.
The horizontal axis represents the debt composition ratio, which represents flow, and the vertical axis represents the subsidy dependence ratio, which represents stock.
The color of each point corresponds to the eight university classes or groups.
As can be seen from this figure, universities from the same class tend to be located relatively close to each other, and similar classes tend to be located close.
However, there are also cases where this does not necessarily follow this trend.
|
| ICACT20260379 Slide.25
[Big Slide]
|
Chrome Click!! |
 |
In this paper, we consider 33 types of financial indicators (data items) . We used the data covering eight years from fiscal year 2012 to fiscal year 2019.
Since this is a research paper, the names of the universities have been anonymized.
We selected several financial indicators from the 33 available.
Below, we refer to these indicators as data items.
We used six years of data from 2012 to 2017 as training data and two years of data from 2018 and 2019 as test data, and performed classification using multiclass logistic regression.
Scatter plot of universities for a certain year �� “Debt composition ratio” × “Grant dependency”�� Colors represent university classifications |
| ICACT20260379 Slide.26
[Big Slide]
|
Chrome Click!! |
 |
In this section, we examine the relationship between the selected data items (financial indicators), accuracy, f1-score and entropy.
The numbers in the following figures indicate the corresponding university classes in Table 1.
|
| ICACT20260379 Slide.27
[Big Slide]
|
Chrome Click!! |
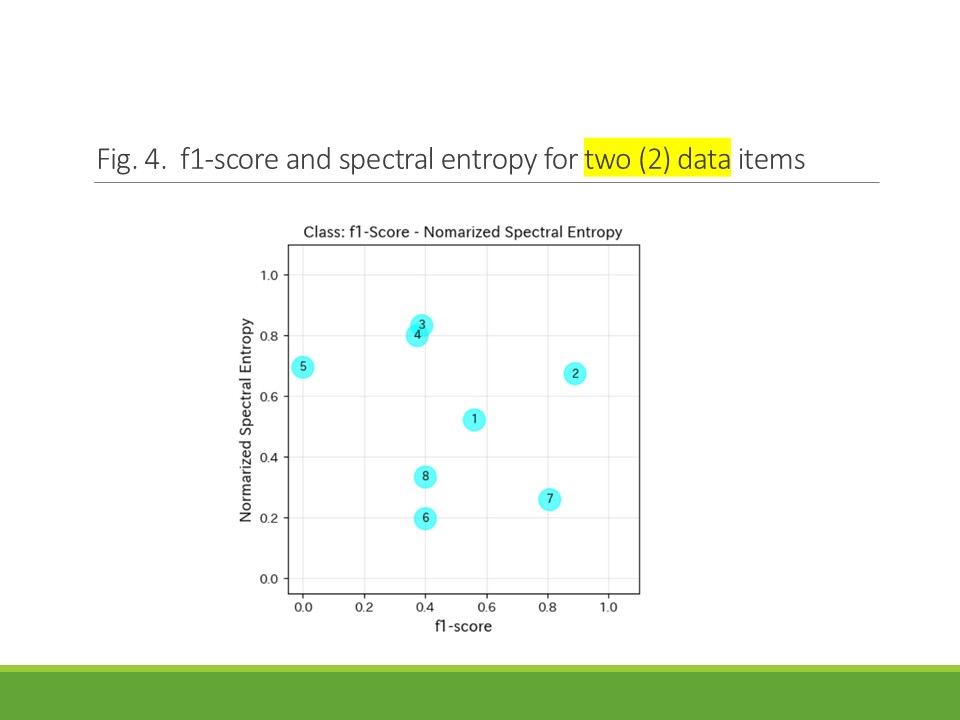 |
(1) Selection of two indicators (Fig. 4)
Indicators: Debt composition ratio, Grant dependence.
Normalized entropy of covariance matrix: 0.991.
Accuracy: 0.657.
In this simple setting, the accuracy is low due to the small number of data items (indicators). Especially, class 3 and 4 have high entropy value.
|
| ICACT20260379 Slide.29
[Big Slide]
|
Chrome Click!! |
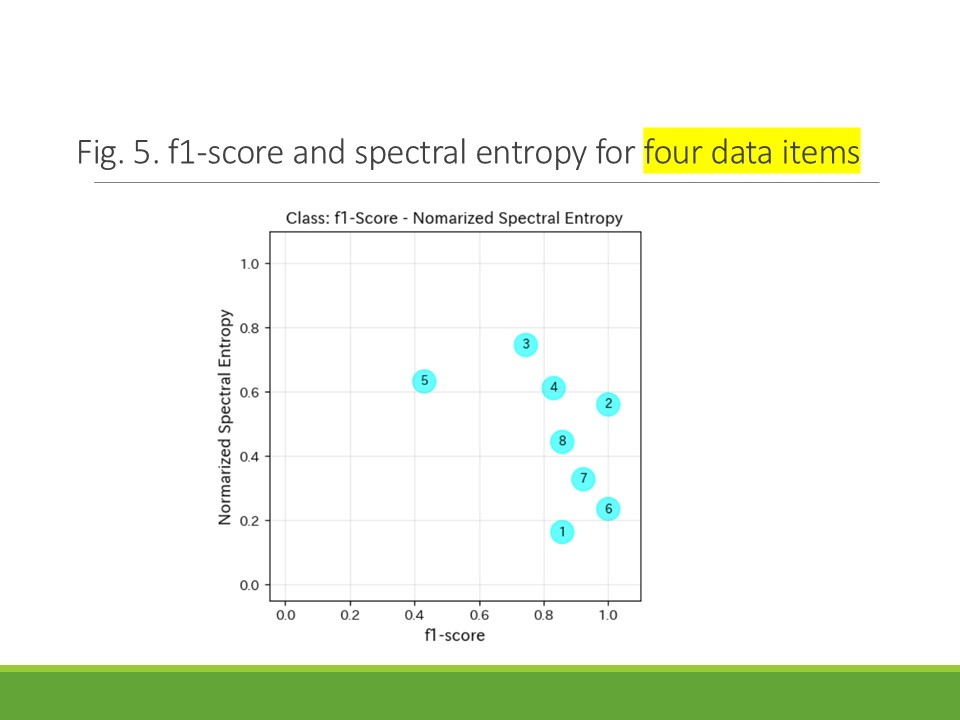 |
(2) Selection of four indicators (Fig. 5)
Indicators: Debt composition ratio, Grant dependency ratio, Education expenses ratio, Research expenses ratio.
Normalized entropy of the covariance matrix 0.859.
Accuracy: 0.889.
As the number of selected items (indicators) increased, the discrimination performance improved and accuracy increased. Regarding entropy, 1, 6 and 7 are low, and it is thought that there is a direction that clearly expresses each characteristic and so stable classified.
Class 1, 6 and 7, shown in the bottom right of the figure, are considered to be easier to discriminate because high f1-score and low entropy.
The f1-score for class 5 tends to be significantly lower (outlier).
This is likely due to the fact that class 5 is the class of humanities, and there is considerable variety in each university.
|
| ICACT20260379 Slide.31
[Big Slide]
|
Chrome Click!! |
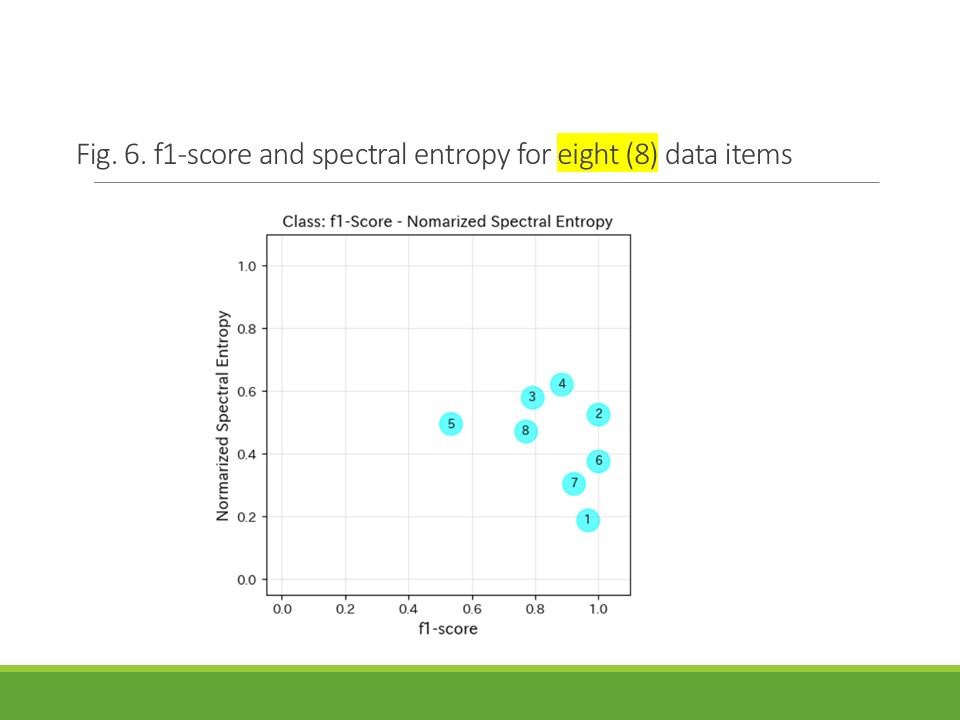 |
(3) Example of eight indicator selection (Fig. 6)
Indicators: Debt composition ratio, Grant dependency ratio, Education expenses ratio, Research expenses ratio, Research expenses per full-time faculty member, Growth rate of operating income, Personnel expenses ratio, Self-generated income ratio.
Normalized Entropy: 0.724.
Accuracy: 0.913.
Although the accuracy and whole entropy have improved, as can be seen from Fig. 5 and 6,
there is little change in entropy of each class.
Therefore, the data structure is thought to be similar to that in Figure 5.
|
| ICACT20260379 Slide.32
[Big Slide]
|
Chrome Click!! |
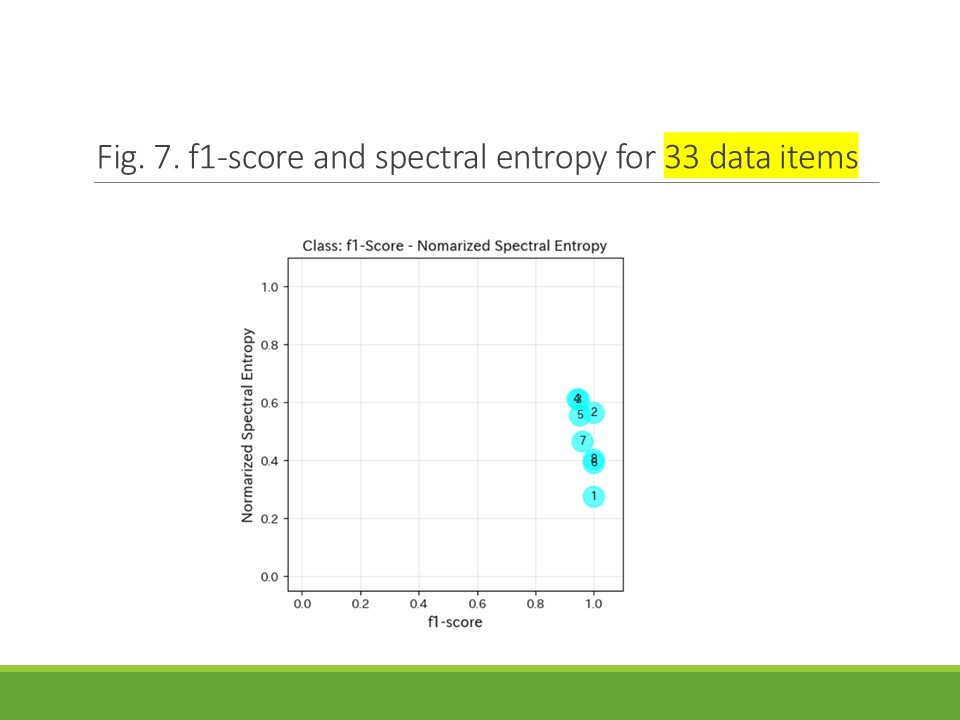 |
(4) Selection of all (33) indicator selection (fig. 7)
Normalized Entropy of Covariance matrix: 0.725
Accuracy: 0.977
Basically, the f1-score increases as the number of data items increases.
However, the entropy is not much different from that in Figure 6.
It is thought that there is not much change in the data structure.
Therefore, the appropriate number of items (indicators) to represent the data structure is thought to be smaller.
|
| ICACT20260379 Slide.33
[Big Slide]
|
Chrome Click!! |
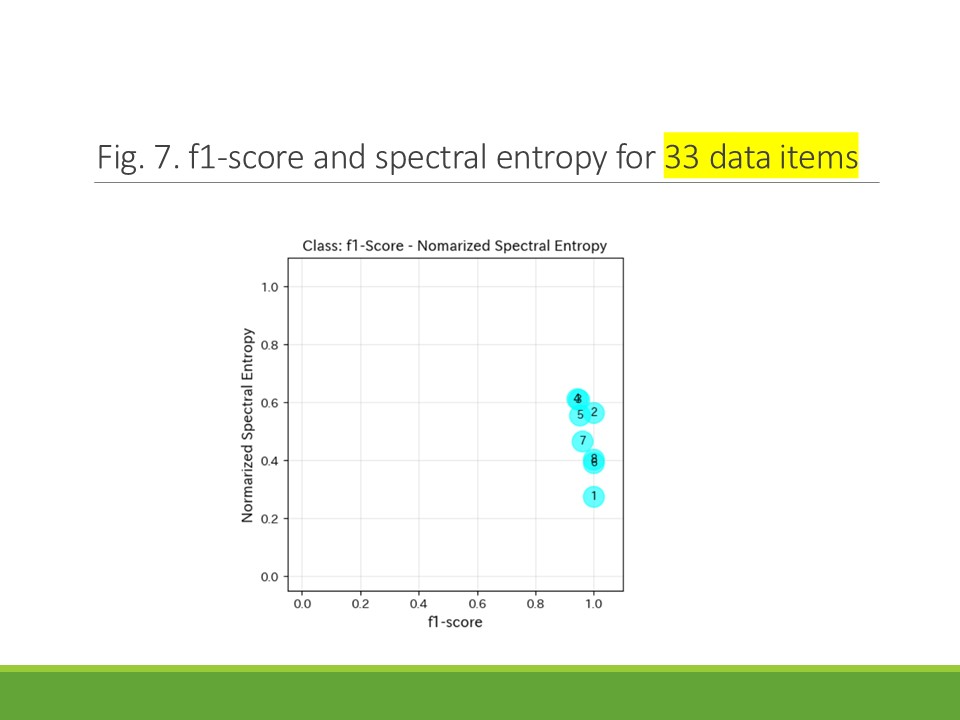 |
(4) Selection of all (33) indicator selection (fig. 7)
Normalized Entropy of Covariance matrix: 0.725
Accuracy: 0.977
Basically, the f1-score increases as the number of data items increases.
However, the entropy is not much different from that in Figure 6.
It is thought that there is not much change in the data structure.
Therefore, the appropriate number of items (indicators) to represent the data structure is thought to be smaller.
|
| ICACT20260379 Slide.34
[Big Slide]
|
Chrome Click!! |
 |
(5) Selections of other four indicator selection. Next, we investigate the differences in the selected items. |
| ICACT20260379 Slide.35
[Big Slide]
|
Chrome Click!! |
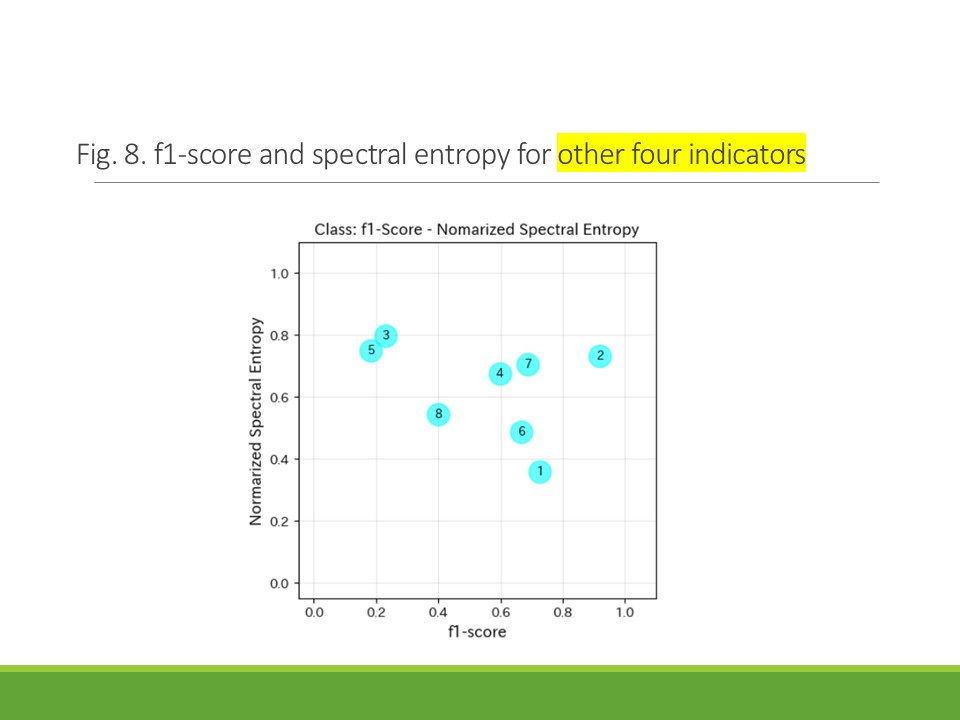 |
In this case, the selected indicators are from the set of similar financial indicators. Therefore, the f1-score is not so much high and the entropy is high. |
| ICACT20260379 Slide.36
[Big Slide]
|
Chrome Click!! |
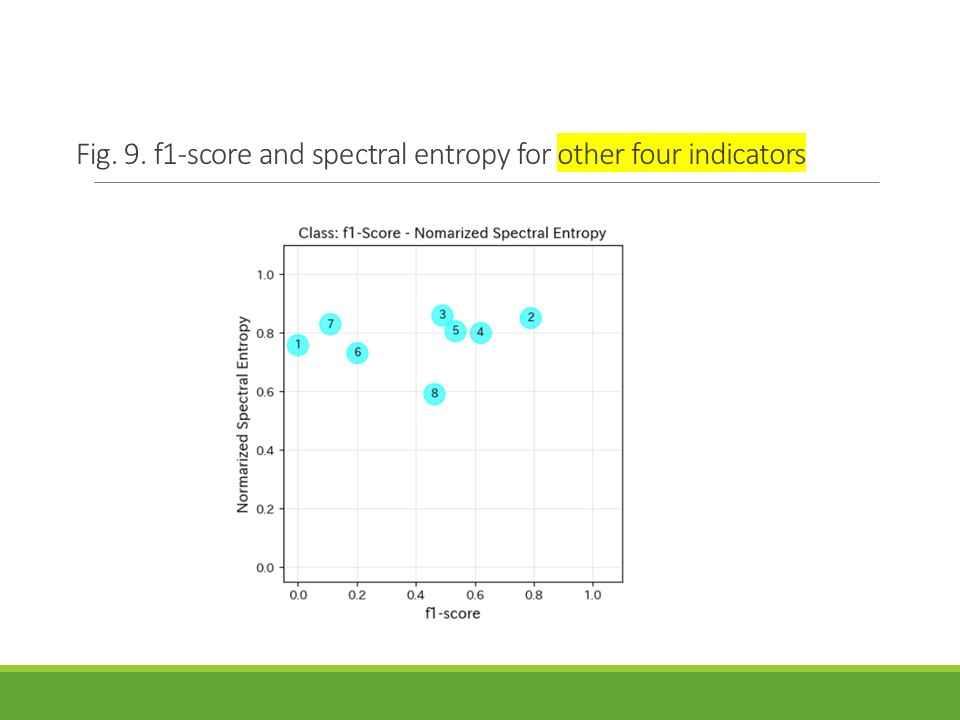 |
Next, in case when we select the following four items: Indicators; Maintenance and management cost ratio, Utilities cost ratio, Labor costs per full-time administrative and technical staff, and General administrative cost ratio. These indicators are related to the management indicators common to the entire university set, and are not closely related to university classification. Therefore, as a result, the f1-score further decreases and entropy increases as seen from the Fig.9. |
| ICACT20260379 Slide.37
[Big Slide]
|
Chrome Click!! |
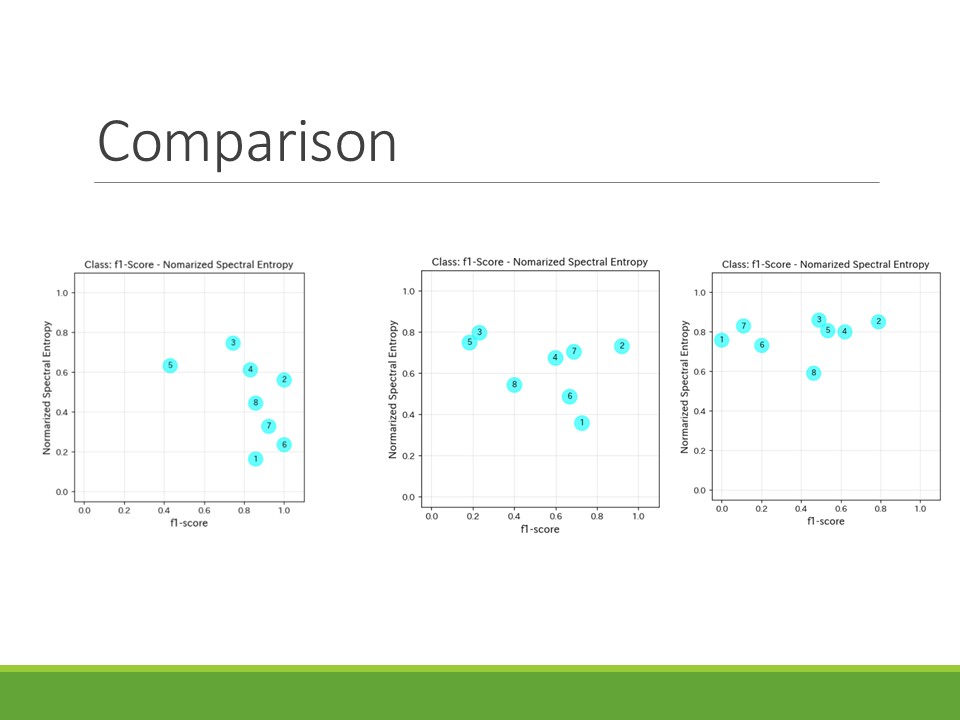 |
This slide shows a comparison of selection of four different indicators. |
| ICACT20260379 Slide.38
[Big Slide]
|
Chrome Click!! |
 |
In this paper,
we investigated the effective evaluation method for classification by multiclass logistic regression.
We also examine the relationship between data item selection and entropy.
By examining multiple item selection situations using real data, we gained insights into the evaluation method of data item selection and classification using the entire data and class data, entropy and f1-score.
These insights were verified using specific numerical examples.
|
| ICACT20260379 Slide.39
[Big Slide]
|
Chrome Click!! |
 |
REFERENCES |















